
Analysis and Design of Smart Components in Digital Energy Twins
Katharina Legler, Muhammad Sheheryar Jajja and Klaus Volbert
Faculty of Computer Science and Mathematics, Ostbayerische Technische Hochschule (OTH) Regensburg, Germany
Keywords:
Digital Twins, Internet of Things, Machine Learning Models, Data Visualization.
Abstract:
The energy crisis, energy demand growth, and dependence on fossil fuels worldwide have made urgent action
necessary for us to seek sustainability in energy production and use. Digital technologies, especially Digital
Energy Twins, have immense potential to reduce energy consumption, thereby reducing environmental im-
pacts, particularly in the building sector. This paper presents the development of a digital energy twin that
supports sustainable energy consumption analysis and optimization. Our study begins with a comprehensive
analysis of the energy consumption data, the weather data, and the building plans as a solid basis for the anal-
ysis. We identify key energy consumption trends and patterns across different timescales and device-specific
details that could be optimized, such as base load consumption and device-specific inefficiencies. A key part
of our work is forecasting energy consumption using time series models, such as the ARIMA model, which
promises to be useful in identifying patterns for improving energy efficiency. Overall, our study provides
valuable insights into energy optimization and could form the base for further advances in digital energy twins
at OTH Regensburg, helping to contribute to its sustainable development goals and smart campus initiatives.
1 INTRODUCTION
The current energy crisis is one of the most signif-
icant global challenges. The increasing energy de-
mand, coupled with the widespread use of fossil fu-
els, has led to a significant rise in energy prices
and increased uncertainty regarding energy availabil-
ity. In 2021, the European Union imported more
than 45% of its natural gas, highlighting its depen-
dence on external energy sources (International En-
ergy Agency, 2024). In addition, using fossil fuels is
a major contributor to the increase in carbon dioxide
(CO2) emissions that drive climate change (Farghali
et al., 2022). These circumstances emphasize the ur-
gency of rethinking global energy consumption pat-
terns and developing sustainable energy systems to
achieve long-term climate targets and ensure energy
security (Farghali et al., 2023).
A decisive step towards transforming the energy
sector in Germany was taken with the Heat Planning
and Decarbonization of Heating Networks Act, which
was passed on 17 November 2023. This law obliges
cities and municipalities to draw up municipal heat-
ing plans to accelerate the transition to the use of re-
newable energies and improve energy efficiency in the
heating sector. The aim is to achieve a climate-neutral
building stock by 2045 (Federal Ministry for Housing
and Construction, 2024).
The energy efficiency in the building sector is
crucial in the context of the current energy crisis,
as this sector represents about 30%-40% of the to-
tal energy consumption worldwide (Invidiata et al.,
2018). Almost a third of the total greenhouse gas
emissions come from building use, which emphasizes
the need to promote sustainable building practices
(Danish et al., 2019; Hafez et al., 2023).
1.1 Digital Twins
Digitalization is a cross-industry trend that is of-
ten associated with concepts such as the Internet of
Things, cyber-physical systems, and the digital twin
(Newrzella et al., 2021). In recent years, the digital
twin has become increasingly important in industry
and science and is being used increasingly (Tao et al.,
2019). A digital twin is generally understood as a vir-
tual replica of physical objects or systems (do Amaral
et al., 2023).
The adoption of digital technologies, particularly
Digital Energy Twins, presents a promising solution
for optimizing energy use in buildings and minimiz-
ing environmental impacts. Digital Energy Twins en-
able precise monitoring and management of energy
flows, offering substantial potential for CO2 reduc-
Legler, K., Jajja, M. S. and Volbert, K.
Analysis and Design of Smart Components in Digital Energy Twins.
DOI: 10.5220/0013289900003944
In Proceedings of the 10th International Conference on Inter net of Things, Big Data and Security (IoTBDS 2025), pages 263-272
ISBN: 978-989-758-750-4; ISSN: 2184-4976
Copyright © 2025 by Paper published under CC license (CC BY-NC-ND 4.0)
263

tion and cost savings (do Amaral et al., 2023).
Amaral et al.do Amaral et al. (2023) argue that us-
ing digital energy twins offers numerous advantages
for energy management. A digital energy twin en-
ables the monitoring and control of energy systems in
(near) real time. This allows performance to be opti-
mized, downtimes to be reduced, and operating costs
to be lowered.
Digital twins of energy generation and consump-
tion can provide invaluable insights from simulations.
In addition, they improve the efficiency of operations
while minimizing environmental impact. Through
these capabilities, smart city applications can address
urban energy challenges with substantial potential for
sustainable urban development.
1.2 Smart City
In recent years, the smart city concept has attracted
significant interest from governments, companies,
and research institutions. The primary goal of a smart
city is to enhance the efficiency, sustainability, and
livability of cities. This is achieved by implement-
ing modern digital twin technologies alongside infor-
mation and communication technologies (ICT) (Yin
et al., 2015).
Implementing digital twins offers a powerful way
to improve efficiency and quality of life in smart cities
(Farsi et al., 2023). By accurately modeling and
monitoring urban systems, these virtual replicas en-
able better decision-making, which, then applied in
focused environments such as university campuses,
showcase their benefits in controlled, research-based
settings.
1.3 Smart Campus
A campus consists of several buildings with differ-
ent years of construction, energy sources, and energy
consumers. By optimizing the energy system on cam-
pus, goals such as reducing the carbon footprint and
minimizing energy costs can be achieved (Lesnyak
et al., 2023).
As stated by Alghamdi et al. (Alghamdi et al.,
2020), they claim that controlling and managing en-
ergy along with the resource flows is a core function
of a smart campus. With the help of sensors and
the use of IoT technologies, energy and water con-
sumption alongside carbon emissions can be tracked
in real time. Such data allows the efficient monitoring
and management of resource flows hence resulting in
reduction of emissions and consumption (Afram and
Janabi-Sharifi, 2014).
To conclude, enhancing and incorporating intel-
ligent parts for the digital energy twin deployed on
campus is viewed as one of the ways of improving
environmental performance and creating operational
efficiencies. This research will delve into how these
technologies can be adapted for the Computer Sci-
ence and Mathematics faculty building at OTH Re-
gensburg, leveraging the digital twin concept to opti-
mize energy management on campus.
1.4 Smart City Project of OTH
Regensburg
The Smart City project at OTH Regensburg focuses
on developing a digital energy twin for the mid-sized
city in Germany. The project’s central goal is to create
a web-based platform that visualizes various energy
data in an interactive 3D map. This platform is in-
tended to help the city administration, homeowners,
tenants, and other stakeholders by providing trans-
parency in energy consumption and the potential for
energy savings (Thelen et al., 2023). The platform
will be referred to as the Cesium platform.
The Cesium platform integrates various data
sources including electricity, hot water, heating con-
sumption, and solar data (Thelen et al., 2023).
Figure 1 shows a screenshot of the platform with
an exemplary selection of diagrams. The buildings
and districts are colored based on energy consump-
tion, using a color spectrum from red (high consump-
tion) to green (low consumption).
The platform’s user interface is designed to be
customizable and expandable to many users with dif-
ferent requirements (Thelen et al., 2023). Thanks to
this foundation and its adaptability, this platform rep-
resents the basis for integrating the idea of a Smart
Campus at OTH Regensburg into this Smart City
project.
1.5 Objective of the Work
This work aims to design and analyze smart com-
ponents for a digital energy twin, using the campus
building as a case study. Initially, the work involves
analyzing current energy consumption, including data
collection and evaluation, and examining relevant fac-
tors such as weather and building usage.
From this analysis, specific requirements for the
digital energy twin’s smart components will be iden-
tified and tailored to meet the needs of different user
groups. In addition to technical aspects, the work will
focus on the user interaction with the digital twin and
its integration within the university’s overall system.
IoTBDS 2025 - 10th International Conference on Internet of Things, Big Data and Security
264
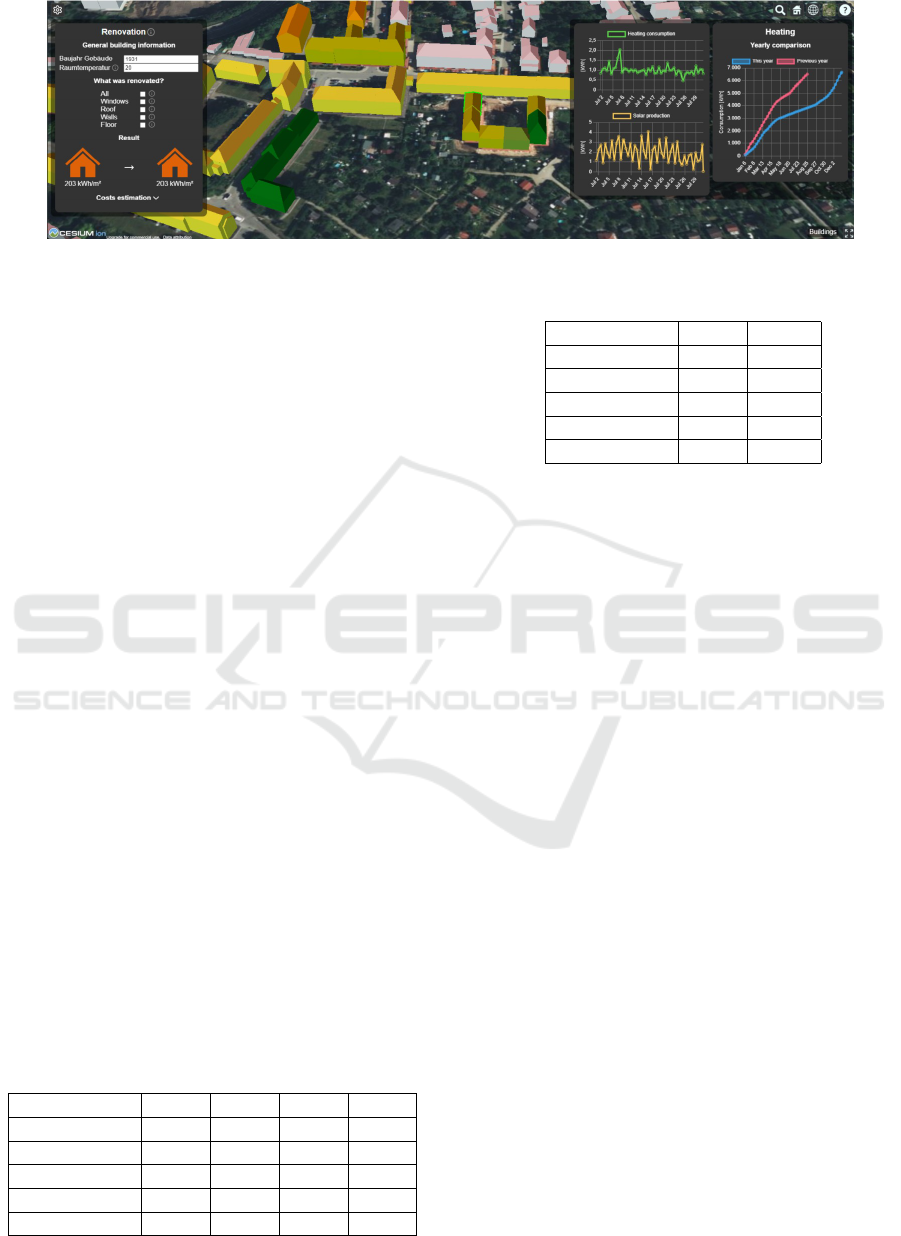
Figure 1: Cesium Web Platform (Thelen et al., 2023).
Core to this work is developing a predictive algo-
rithm for forecasting future energy use. The system’s
architecture will be designed to support real-time data
access, enabling enhanced energy management.
Ultimately, this analysis and design process will
contribute to the ongoing development of the Digital
Energy Twin, supporting sustainable energy analysis
and optimization efforts at the campus.
2 ANALYSIS
This section presents the main results of the data set
analysis, focusing on identifying and understanding
notable patterns and trends in energy consumption.
The analysis begins with evaluating key metrics, fol-
lowed by a detailed quarterly and annual examina-
tion. All analyses are based on data gathered from
sensors installed in the buildings and the main build-
ing distribution system, considering various temporal
and device-specific aspects.
2.1 Key Metrics
Table 1 lists the key parameters of the main building
distribution system from 2019 to 2022. In Table 2, the
data for the years 2023 and 2024 are shown. The first
thing that stands out is the total annual energy con-
sumption in megawatt hours (MWh). The year 2020,
in particular, shows a significant deviation, which is
attributable to the coronavirus pandemic and is there-
fore considered in further analysis.
Table 1: Key Figures (2019-2022).
Year 2019 2020 2021 2022
∑
E (MWh) 548 480 519 531
AVG I (A) 51.83 45.60 46.35 48.61
AVG P (kW) 62.60 54.61 59.27 60.64
AVG S (kVA) 70.77 62.67 67.05 68.88
AVG cos ϕ 0.877 0.872 0.887 0.884
Table 2: Key Figures (2023-2024).
Year 2023 2024
∑
E (MWh) 552 > 275
AVG I (A) 53.95 55.57
AVG P (kW) 63.06 64.42
AVG S (kVA) 71.63 73.73
AVG cos ϕ 0.889 0.882
From 2021 onward, however, an upward trend will
reach and exceed the 2019 level by 2023. The differ-
ence between apparent power and active power has
remained relatively constant, except for 2024. As this
year was not yet complete at the time of the analysis,
this could still change over the year.
Finally, the average power factor cos(phi) is an-
alyzed. Here, there is only a noticeable change of
0.015 between 2020 and 2021, indicating that electri-
cal energy has been used more efficiently since then.
However, some general conditions must be con-
sidered when evaluating these figures. The steady in-
crease in values is due to the expansion of the faculty
and not because of inefficient energy use. As a tech-
nical faculty, which has numerous computer rooms,
server rooms, and a quantum computer project (Re-
gensburg, 2024), larger base loads can occur. These
facilities are not only in operation during regular
opening hours but also during quiet periods, which
increases the energy demand accordingly.
2.2 Quarterly-Level Analysis
In this section, the differences in energy consumption
by quarter were analyzed. The year 2024 was not in-
cluded as it is incomplete and could, therefore, distort
the percentage shares. Firstly, the percentage share
of each quarter in total consumption is analyzed, as
shown in Figure 2. The fourth quarter has the highest
share, followed by the first quarter. This shows that
the winter semester consumes more electricity than
the summer semester
Figure 3 visualizes the monthly consumption in
comparison. The months of October to March ac-
Analysis and Design of Smart Components in Digital Energy Twins
265
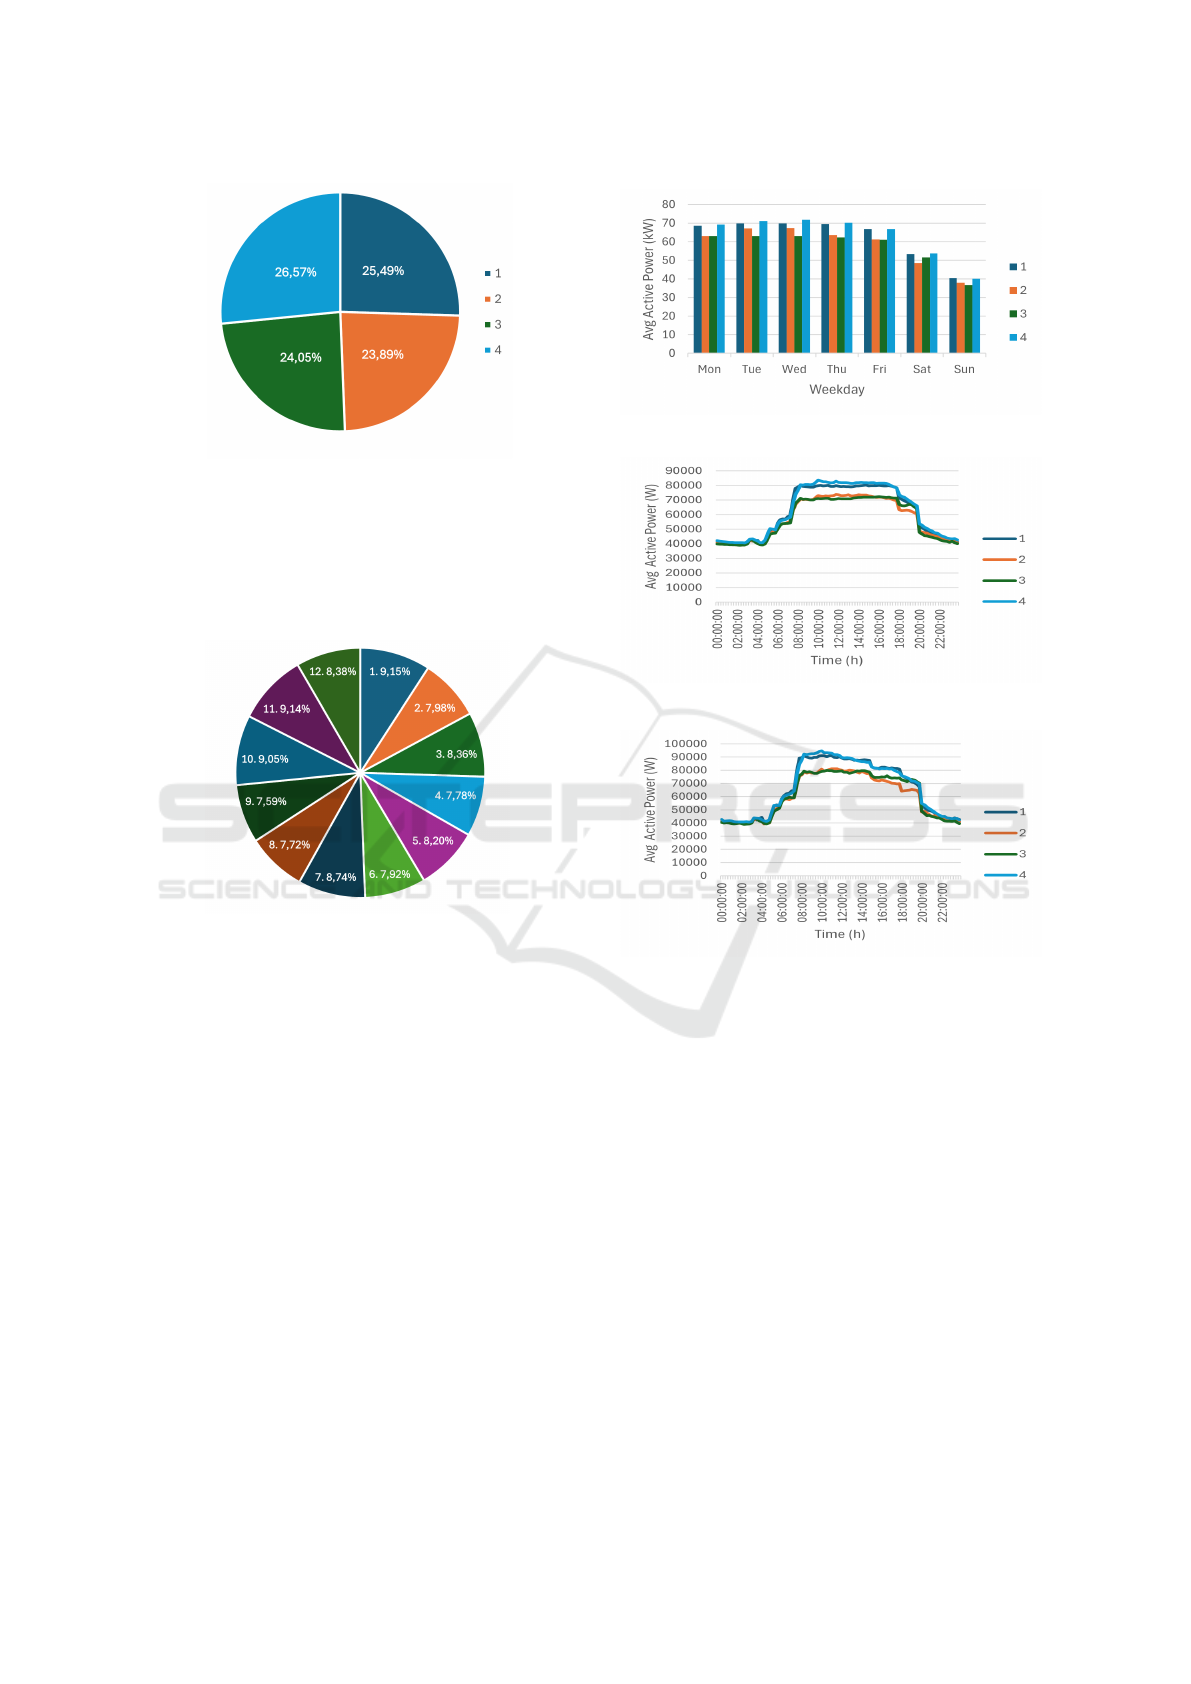
Figure 2: Quarterly Percentage of Total Consumption.
count for 52.06% of total consumption, while April to
September account for 47.94%. The higher consump-
tion in winter can be explained by shorter lecture-free
periods. October and January have the largest shares,
which coincide with the start of the semester and the
examination phase of the winter semester.
Figure 3: Monthly Consumption Percentage.
Figure 4 shows the average daily active power by
quarter. A comparison with the daily view shows that
the active power is particularly high in the first and
last quarters, indicating increased energy utilization
in winter. A slight curve can be seen from Monday to
Friday, with Wednesday as the peak. Saturdays show
lower values in the second quarter, while an unusual
increase can be observed in the third quarter, which
could indicate an increase in events and courses on
Saturdays. Sundays show a similar distribution to the
other weekdays, suggesting a higher base load during
the first and fourth quarters.
An analysis of the daily curves for the individual
quarters, as shown in Figure 5, makes it even clearer
that the first and fourth quarters have a higher aver-
age effective capacity. As these quarters comprise
the winter semester, it could be argued that the winter
semester is generally more heavily attended.
As the daily analysis revealed Friday to be partic-
ularly conspicuous, Figure 6 looks at Friday in detail.
This figure shows even more clearly than Figure 5 that
Figure 4: Quarterly Average Daily Active Power.
Figure 5: Yearly Avg. Daily Active Power.
Figure 6: Seasonal Friday Variations.
the values in the third quarter rise in the evening to the
level of the first and fourth quarters.
2.3 Annual-Level Analysis
This analysis at the annual level included not only the
years but also the months and their trends.
The monthly differences in energy consumption
over the years are shown in Figure 7. The dotted trend
line shows a steady increase in electricity consump-
tion, which can be attributed to the growing num-
ber of students and the expansion of the technical
infrastructure. October and November are particu-
larly energy-intensive months, while July and January
also show peak values. Overall, the winter semester
shows higher energy consumption than the summer
semester. The year 2020, characterised by the coron-
avirus pandemic, differs significantly from the others.
The start of the semester in March is also noticeable
but not as pronounced as in October.
IoTBDS 2025 - 10th International Conference on Internet of Things, Big Data and Security
266
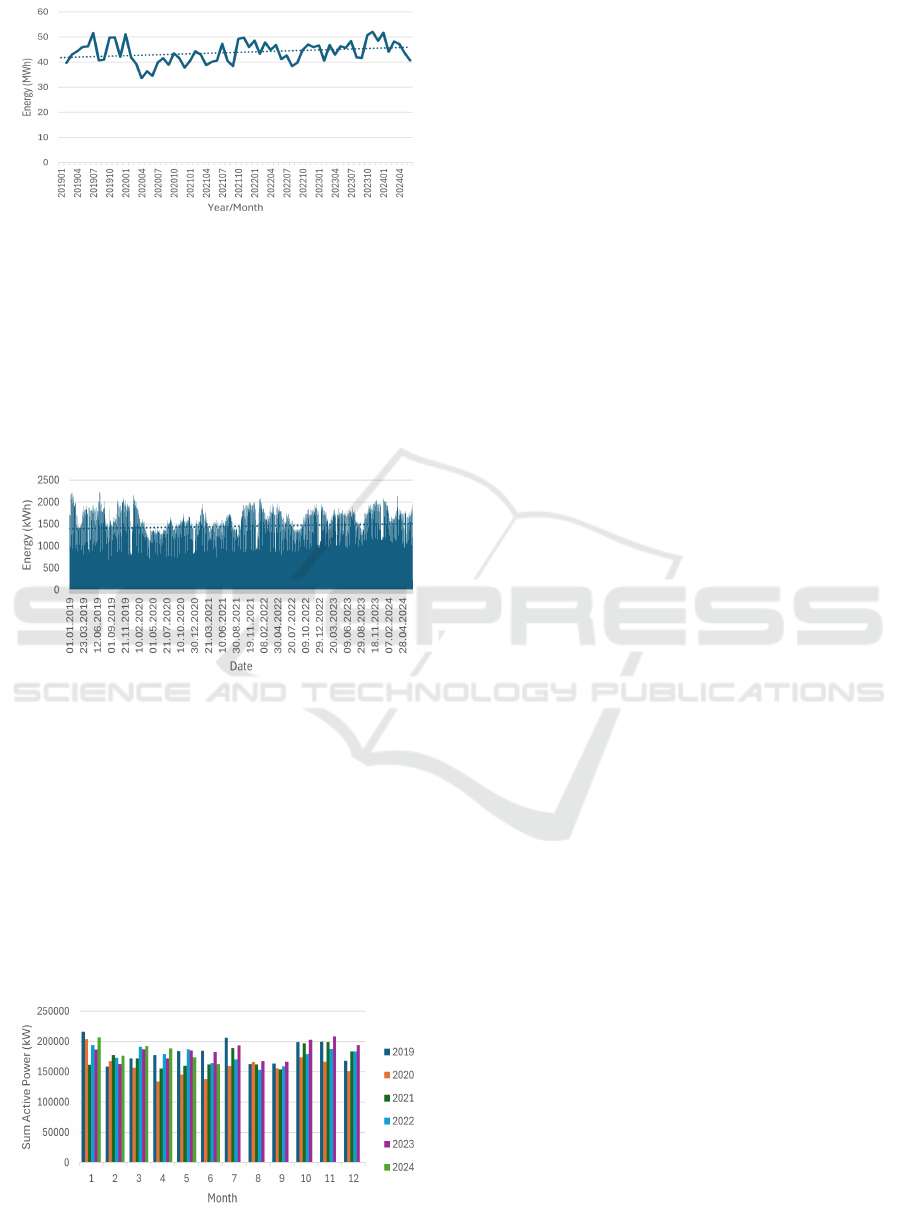
Figure 7: Annual Monthly Energy Differences (MWh).
Figure 8 shows the development of daily energy
consumption over the years. The Christmas holidays
are clearly recognisable, while the months of August
and September show a gradual decrease in consump-
tion without abrupt drops. Sundays are clearly iden-
tifiable. In March, daily consumption in the second
half of the month is lower than in winter, especially
compared to December and January.
Figure 8: Yearly Daily Energy Consumption.
An interesting comparison of monthly energy con-
sumption over the years can be seen in Figure 9. The
year 2020 again stands out in particular due to the
coronavirus pandemic. In contrast, 2023 shows con-
sistently higher consumption values than the previ-
ous years. The year 2022 shows unusual fluctuations,
with higher and lower consumption values than the
other years. Particularly in the examination phases in
January and July and at the beginning of the winter
semester in October and November, clear consump-
tion peaks can be seen.
Figure 9: Annual Monthly Energy Comparison.
2.4 Conclusions
The analysis of energy consumption at different ob-
servation levels and on an appliance basis has pro-
vided several interesting findings.
The quarterly analysis showed that the fourth
quarter had the highest energy consumption, followed
by the first quarter. This indicates that the win-
ter semester requires more energy than the summer
semester due to the shorter lecture-free periods and
more intensive use. The higher consumption during
the winter was also confirmed at an annual level, with
a steady increase in total consumption.
The power factor (cos (phi)) varied considerably
over the course of the day and, in some cases, fol-
lowed the operating times of the appliances. Notice-
able peaks and fluctuations in the cos (phi) value, es-
pecially in the early morning, suggest that further re-
search would be useful to identify optimization op-
portunities for air conditioning or ventilation systems.
Overall, the analysis provides valuable insights
into the temporal distribution of energy consumption.
The results can be used as a basis for future measures
to optimize energy use and improve energy efficiency.
3 FORECAST OF FUTURE
ELECTRICITY CONSUMPTION
VALUES
Predicting future electricity consumption is crucial
for energy and resource management, especially in
large institutions like universities. A precise forecast
makes it possible to take measures to optimize energy
use in order to both reduce costs and promote sus-
tainability (Khan et al., 2023). Different prediction
methods can be applied based on historical consump-
tion data collected over several years. These include
both classical statistical methods and machine learn-
ing (ML) approaches.
3.1 Model Selection
The choice of model for energy forecasting depends
largely on the type of data available and the required
forecast accuracy. Appropriate approaches include
statistical models such as linear regression (LR) and
ARIMA models and the application of ML algo-
rithms. The LR is a simple statistical model that de-
scribes a linear relationship between historical con-
sumption data and time. It assumes that electricity
consumption depends on time in a linear manner. It is
particularly effective when the data to be forecast fol-
lows a clear linear trend but is less suitable for more
Analysis and Design of Smart Components in Digital Energy Twins
267

complex or non-linear patterns and for data with sea-
sonal fluctuations (Kim et al., 2020).
A common model for forecasting time series is
the ARIMA model. It combines autoregressive (AR)
components, which use past values for forecasting,
with moving average components based on past fore-
cast errors. Differentiation removes long-term trends
or seasonal patterns to make the data stationary, a ba-
sic requirement of the model. This model has proven
itself in numerous use cases for forecasting energy
consumption data, especially when considering sea-
sonal and recurring patterns (Mahia et al., 2019).
In this work, a time series model, specifically an
ARIMA model, was used as a basis because it is par-
ticularly well suited to detect seasonal and recurring
patterns in the energy data. Due to the historical data
being distorted by the Corona pandemic, the use of
ML is less advantageous as model’s ability to gen-
eralize and identify reliable patterns is compromised.
Accordingly, the ARIMA model is the better choice
for making precise and reliable forecasts.
3.2 ARIMA Model
The ARIMA model is a popular method for time se-
ries forecasting, consisting of three main components:
autoregressive (AR), integrated (I), and moving aver-
age (MA). These elements form the basis for the anal-
ysis and forecasting of time series data. The AR com-
ponent describes the relationship between the current
data point and several of its previous values, assuming
that past values influence future values. This makes
the AR model particularly useful when a clear trend
can be seen in historical data (Shumway and Stoffer,
2017).
The I component ensures the differentiation of the
time series to achieve stationarity. Stationary data
have constant means and variances over time, which
is a prerequisite for many time series models. Dif-
ferentiation eliminates long-term trends and seasonal
effects, making the data easier to analyze (Hirschle,
2021).
The MA component uses the prediction errors of
previous models to correct future values. By analyz-
ing the differences between actual and predicted val-
ues, this component increases the accuracy of pre-
dictions by smoothing out unforeseen fluctuations
(Shumway and Stoffer, 2017).
The Seasonal ARIMA (SARIMA) model extends
the classic ARIMA model to include seasonal pat-
terns. While ARIMA covers linear trends and short-
term fluctuations, SARIMA includes periodic pat-
terns like those seen in energy consumption. The
model considers seasonal autoregressive, differenti-
ated and moving average components to enable more
precise forecasts. SARIMA is particularly useful
for data that show recurring patterns over the years
(Hirschle, 2021).
Overall, the SARIMA model provides a solid ba-
sis for predicting time series with pronounced sea-
sonal patterns, as occur in energy consumption.
3.3 Application of the SARIMA Model
The SARIMA model was used in this work to fore-
cast energy consumption. The process was divided
into several steps. Several Python libraries were uti-
lized for the analysis and evaluation. For data ma-
nipulation and analysis, pandas NumPy, and mat-
plotlib.pyplot were used. Time series analysis was
performed using the SARIMAX model from the
statsmodels library. The Augmented Dickey-Fuller
(ADF) test was conducted to check stationarity. The
influxdb client library was used to retrieve data from
the InfluxDB database. The sklearn.metrics functions
mean absolute error and mean squared error evalu-
ated model performance.
The raw data was retrieved from the InfluxDB.
Due to significant fluctuations in daily data, which can
be caused by factors such as holidays or operational
variations, weekly aggregation was chosen. This ap-
proach smooths peaks and captures seasonal patterns
without focussing short-term volatility.
The autocorrelation function (ACF) measures the
correlation between a time series value and its previ-
ous values over different lags, while the partial auto-
correlation function (PACF) measures direct correla-
tions adjusted for shorter lags McKinney et al. (2011).
Figure 10 and Figure 11 show the ACF and PACF
values of the daily and weekly aggregated data. The
ACF plot of the daily data shows periodic peaks indi-
cate a seasonal dependence. In contrast, weekly ag-
gregated values show a clear final peak at the 2nd in-
terval, making them especially useful for forecasting.
The PACF plot of weekly data shows a clear fi-
nal peak at 2nd interval, indicating a strong two-week
dependency. Weekly aggregation captures seasonal
fluctuations more precisely than monthly data.
Figure 10: ACF and PACF Plots for Daily Aggregates.
IoTBDS 2025 - 10th International Conference on Internet of Things, Big Data and Security
268
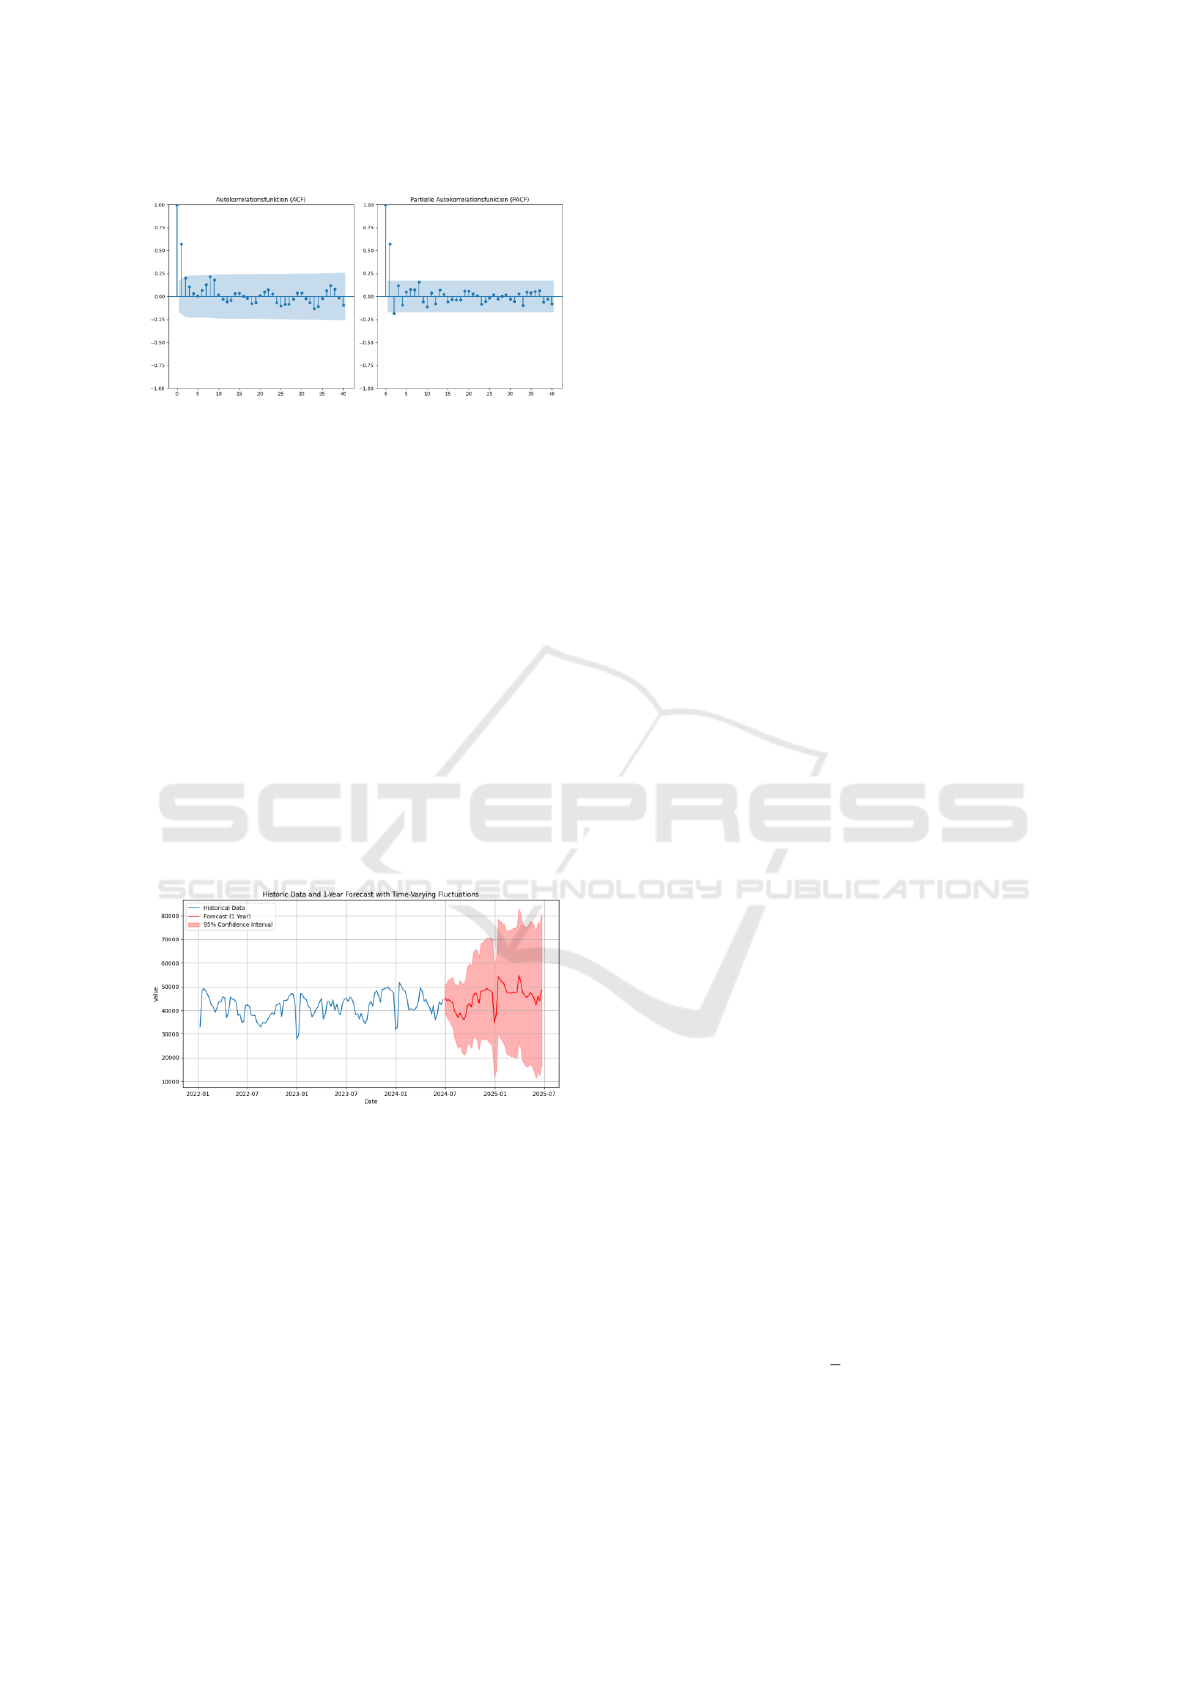
Figure 11: ACF and PACF Plots for Weekly Aggregates.
After aggregation, stationarity tests such as the
ADF test was performed to check the need for differ-
entiation (Shumway and Stoffer, 2017). These results
indicate no need for additional differentiation The re-
sults of the ADF test for the weekly aggregated data
were as follows:
• ADF statistics: -4,682
• p-value: 9.08e-05
Exogenous variables such as holidays and univer-
sity vacation periods, that affect energy consumption,
were aggregated weekly to match the time series data.
To reflect realistic fluctuations, time-varying scal-
ing of noise was implemented, with noise scaled more
strongly in the last third of the period.
Figure 12 shows historical data and forecasted val-
ues for the next year with a 95% confidence interval.
This forecast starts from January 2, 2022.
Figure 12: Energy Consumption Forecast.
The SARIMA model combined with weekly ag-
gregation and exogenous variables provides a robust
method for forecasting energy consumption. Seasonal
patterns and careful tuning allowed accurate predic-
tions. Future improvements will refine the model
based on new data.
3.4 Validation of the Forecast
To evaluate the accuracy of the forecast, various vali-
dation methods were applied. While the previous sec-
tion focused on the visual representation of the model,
this section provides a detailed performance evalua-
tion using specific metrics.
• Log-Likelihood: This metric measures the
model’s goodness of fit to the data, with higher
(less negative) values indicating a better fit Burn-
ham and Anderson (2004). In this case, the Log-
Likelihood value is -2103.813, suggesting that the
model moderately describes the data.
• Akaike Information Criterion (AIC): The AIC
assesses model quality by balancing goodness of
fit against model complexity. It is calculated as
AIC = −2 · Log-Likelihood + 2 · k
where k is the number of estimated parameters, a
lower AIC value indicates a better model (Burn-
ham and Anderson, 2004). The AIC value of
4213.626 given here can serve as a basis to com-
pare it with other models.
• Bayesian Information Criterion (BIC): Similar
to the AIC, the BIC considers model complexity,
but with a stronger penalty term for the number of
parameters. It is calculated as
BIC = −2 · Log-Likelihood + log(n) · k
where n is the number of observations, a lower
BIC value indicates a better model (Burnham and
Anderson, 2004). The BIC value of 4222.182 is
higher than the AIC value, suggesting that the
model may be too complex and should perhaps
be reduced to achieve a better balance between
model complexity and fit.
• Hannan-Quinn Information Criterion
(HQIC): The HQIC takes into account both
the number of parameters and the number of data
points and is calculated as
HQIC = −2 · Log-Likelihood + 2 · log(log(n)) · k
The HQIC value of 4217.102 is between the AIC
and BIC values, indicating that the model has a
balanced level of complexity and fit (Ding et al.,
2018).
The performance of the model was additionally
evaluated using the following metrics:
• Mean Absolute Error (MAE): The MAE mea-
sures the average absolute difference between the
actual and the forecast values. It is calculated as:
MAE =
1
n
n
∑
t=1
|y
t
− ˆy
t
|
where y
t
represents the actual values, and ˆy
t
repre-
sents the forecasted values. In this case, the MAE
Analysis and Design of Smart Components in Digital Energy Twins
269

is 3877.523, meaning that the average absolute
deviation between the actual and forecasted val-
ues is approximately 3877.523 kW.
• Mean Squared Error (MSE): The MSE cal-
culates the mean square difference between the
actual and the forecast values. The MSE is
22,333,269.584. This high MSE value indicates
that larger errors have a significant impact on the
model evaluation.
• Root Mean Squared Error (RMSE): The
RMSE is the square root of the MSE and indi-
cates the average size of the errors in the units of
the data. The RMSE is 4725,809 units. This in-
dicates the average size of the errors in the same
units as the data.
The validation of the model’s forecasting perfor-
mance shows mixed results. The Log-Likelihood
of -2103.813 and the calculated information criteria
(AIC of 4213.626, BIC of 4222.182, and HQIC of
4217.102) indicate that the model needs to be eval-
uated in terms of its complexity and fit. The signif-
icant parameters such as ma.L1 and ma.S.L52 con-
firm the relevance of seasonal and moving average ef-
fects. The error metrics (MAE of 3877.523, MSE of
22,333,269.584, and RMSE of 4725.809) show that
the model gives acceptable predictions but has high
error dispersion. These results suggest that the model
could be improved with more data and optimization.
4 VISUALIZATION
The implementation of the web interface for visualiz-
ing energy consumption requires careful attention to
design principles and graphic standards to ensure a
clear, understandable and interactive presentation of
the data. In addition, the workflow from the database
to the web interface must be explained.
4.1 Design Principles
Figure 13 shows the current view of the electricity
data forecast and heat estimate. The colour scheme is
consistent with existing elements. A close button al-
lows easy return, and closing is also possible by click-
ing outside the window. The graphs can be zoomed,
and the individual lines can be shown or hidden.
A key principle in visualizing energy data is clar-
ity. Visualizations must highlight the most important
information and allow for quick interpretation. This
includes presenting the data clearly and understand-
ably without creating excessive complexity.
Figure 13: Cesium Platform: Forecasting and Estimation.
Consistency is also very important. Uniform col-
ors and symbols should consistently represent similar
data types and categories. This increases usability and
simplifies data interpretation. The design is based on
the existing platform to ensure consistency. To im-
prove clarity, an overlay screen takes up most of the
screen and allows complete insight at a glance.
Interactive elements play a crucial role in visual-
izing energy data. Features like hiding/showing data
and zooming allow users to gain deeper insights into
the data and query specific information, promoting
detailed analysis and a better understanding.
To improve the user experience, the data display
has been linked to a button in the navigation bar. This
simplifies the search for the building on the map and
enables faster access to the desired data.
When graphically displaying energy data, certain
standards must be observed. Uniform scales for axes
facilitate comparisons between different diagrams.
Clear and understandable labels for axes, legends and
data points are essential to enable precise interpreta-
tion of the data presented. The choice of colors also
plays an important role: colors should be aesthetically
pleasing and easily distinguishable for all users, in-
cluding those with color vision deficiency.
4.2 Workflow
The workflow from data source to visualization on
the web interface starts with storing and managing the
data in an InfluxDB database. Next, the InfluxDB is
integrated with the backend service, which is written
in Python. This backend service connects to the In-
fluxDB via its API to perform data queries and pro-
cess, retrieve, and prepare the necessary information.
Once processed, the data is sent to the frontend.
The frontend uses ChartJs to display the data visually.
It handles receiving data from the backend, formatting
it appropriately for ChartJs, and rendering interactive
and informative visualizations on the web interface.
ChartJs presents the data in clear appealing charts,
IoTBDS 2025 - 10th International Conference on Internet of Things, Big Data and Security
270

giving users with clear insights into energy data.
This workflow enables efficient data collection,
processing, and visualization, offering users a seam-
less and user-friendly experience for analyzing and
interpreting energy data.
5 CONCLUSION
This work focused on implementing and analyzing
smart components within a digital energy twin for
the Computer Scince and Mathematics faculty build-
ing at OTH Regensburg, aiming to support the de-
velopment of the digital twin and facilitate sustain-
able energy analysis and optimization possibilities.
The comprehensive investigation into the building’s
current energy consumption yielded valuable insights
into energy flows and highlighted areas for potential
improvement. While the analysis revealed intriguing
trends and statistics, many anomalies were only spec-
ulative, as several underlying factors remain unexam-
ined. The analysis covered various levels, though a
more in-depth exploration of specific aspects is still
required. Two main requirements emerged from the
analysis and were further explored:
Forecasting Future Energy Consumption: This
requirement aims to predict future energy usage to an-
ticipate peak loads and take preventive actions. The
SARIMA algorithm was selected for this task, prov-
ing the available data was suitable for forecasting.
While the model showed promising initial results,
the limited historical data suggests that more time is
needed to establish a robust predictive foundation.
Visualization of Forecast and Estimation
Results: The integration of forecast and estimation
visualizations into the Cesium platform’s frontend
was successfully implemented. Although the back-
end was tested locally, it requires further adaptation
for deployment in a live environment.
In conclusion, this work has significantly con-
tributed to the development of the digital energy twin,
providing practical insights to enhance energy effi-
ciency and supporting smart campus’s vision of be-
coming a model for sustainable practices. The project
has laid a strong foundation for future research and
delivered initial functionalities that can be expanded
and refined in subsequent initiatives.
ACKNOWLEDGEMENTS
This work was supported by the Regensburg Center of
Energy and Resources (RCER). Further information
under www.rcer.de
REFERENCES
Afram, A. and Janabi-Sharifi, F. (2014). Theory and appli-
cations of hvac control systems – a review of model
predictive control (mpc). Building and Environment,
72:343–355.
Alghamdi, A., Hu, G., Haider, H., Hewage, K., and Sadiq,
R. (2020). Benchmarking of water, energy, and car-
bon flows in academic buildings: A fuzzy clustering
approach. Sustainability, 12(11):4422.
Burnham, K. P. and Anderson, D. R. (2004). Multi-
model inference. Sociological Methods & Research,
33(2):261–304.
Danish, M. S. S., Senjyu, T., Ibrahimi, A. M., Ahmadi, M.,
and Howlader, A. M. (2019). A managed framework
for energy-efficient buildings. Journal of Building En-
gineering, 21:120–128.
Ding, J., Tarokh, V., and Yang, Y. (2018). Model selec-
tion techniques: An overview. IEEE Signal Process-
ing Magazine, 35(6):16–34.
do Amaral, J., dos Santos, C., Montevechi, J., and Queiroz,
A. (2023). Energy digital twin applications: A re-
view. Renewable and Sustainable Energy Reviews,
188:113891.
Farghali, M., Osman, A. I., Mohamed, I. M., Chen, Z.,
Chen, L., Ihara, I., Yap, P.-S., and Rooney, D. W.
(2023). Strategies to save energy in the context of the
energy crisis: a review. Environmental Chemistry Let-
ters, 21(4):1–37.
Farghali, M., Osman, A. I., Umetsu, K., and Rooney, D. W.
(2022). Integration of biogas systems into a carbon
zero and hydrogen economy: a review. Environmental
Chemistry Letters, 20(5):2853–2927.
Farsi, M., Daneshkhah, A., Hosseinian-Far, A., and Ja-
hankhani, H. (2023). Digital Twin Technologies and
Smart Cities.
Federal Ministry for Housing, U. D. and Construction
(2024). Act on heat planning and the decarbonisation
of heating networks. Accessed: 2024-11-11.
Hafez, F. S., Sa’di, B., Safa-Gamal, M., Taufiq-Yap, Y.,
Alrifaey, M., Seyedmahmoudian, M., Stojcevski, A.,
Horan, B., and Mekhilef, S. (2023). Energy effi-
ciency in sustainable buildings: A systematic review
with taxonomy, challenges, motivations, methodolog-
ical aspects, recommendations, and pathways for fu-
ture research. Energy Strategy Reviews, 45:101013.
Hirschle, J. (2021). Machine Learning f
¨
ur Zeitreihen: Ein-
stieg in Regressions-, ARIMA- und Deep-Learning-
Verfahren mit Python. Hanser.
International Energy Agency (2024). A 10-point plan to re-
duce the european union’s reliance on russian natural
gas – analysis. Version: 10.09.2024.
Invidiata, A., Lavagna, M., and Ghisi, E. (2018). Selecting
design strategies using multi-criteria decision making
to improve the sustainability of buildings. Building
and Environment, 139:58–68.
Khan, S. U., Khan, N., Ullah, F. U. M., Kim, M. J., Lee,
M. Y., and Baik, S. W. (2023). Towards intelligent
building energy management: Ai-based framework
Analysis and Design of Smart Components in Digital Energy Twins
271

for power consumption and generation forecasting.
Energy and Buildings, 279:112705.
Kim, M. K., Kim, Y.-S., and Srebric, J. (2020). Predictions
of electricity consumption in a campus building using
occupant rates and weather elements with sensitivity
analysis: Artificial neural network vs. linear regres-
sion. Sustainable Cities and Society, 62:102385.
Lesnyak, E., Belkot, T., Hurka, J., H
¨
ording, J. P.,
Kuhlmann, L., Paulau, P., Beak, M., Sch
¨
onfeldt, P.,
and Middelberg, J. (2023). Applied digital twin con-
cepts contributing to heat transition in building, cam-
pus, neighborhood, and urban scale. Big Data and
Cognitive Computing, 7(3):145.
Mahia, F., Dey, A. R., Masud, M. A., and Mahmud, M. S.
(2019). Forecasting electricity consumption using
arima model. In 2019 International Conference on
Sustainable Technologies for Industry 4.0 (STI), pages
1–6.
McKinney, W., Perktold, J., and Seabold, S. (2011). Time
series analysis in python with statsmodels. In SciPy,
pages 107–113.
Newrzella, S. R., Franklin, D. W., and Haider, S. (2021).
5-dimension cross-industry digital twin applications
model and analysis of digital twin classification terms
and models. IEEE Access, 9:131306–131321.
Regensburg, O. (2024). Quantentechnologie.
https://natur-kulturwissenschaften.oth-regensburg.de/
labore/quantentechnologie.
Shumway, R. H. and Stoffer, D. S. (2017). Time series anal-
ysis and its applications: With R examples. Springer,
4th edition.
Tao, F., Zhang, H., Liu, A., and Nope, A. (2019). Digital
twin in industry: State-of-the-art. IEEE Transactions
on Industrial Informatics, 15(4):2405–2415.
Thelen, S. et al. (2023). A slim digital twin for a smart city
and its residents. In Proceedings of the 12th Inter-
national Symposium on Information and Communica-
tion Technology (SOICT ’23), pages 8–15, New York,
NY, USA. Association for Computing Machinery.
Yin, C., Xiong, Z., Chen, W., Wang, J., Cooper, D., and
David, B. (2015). A literature survey on smart cities.
Science China Information Sciences, 58(10):1–18.
IoTBDS 2025 - 10th International Conference on Internet of Things, Big Data and Security
272
