
Optimization of Cloud-Native Application Execution over the
Edge-Cloud Continuum Enabled by DVFS
Georgios Kontos
1,2
, Polyzois Soumplis
1,2
and Emmanouel Varvarigos
1,2
1
National Technical University of Athens, Athens, Greece
2
Institute of Communication and Computer Systems, Athens, Greece
Keywords:
Microservice-Based Applications, Dynamic Voltage Frequency Scaling, Critical Path, Resource Orchestration.
Abstract:
Microservice-based application architecture, despite its many merits - including enhanced flexibility, scalabil-
ity and robustness-, adds significant complexity to the application’s orchestration process. Complex execution
paths emerge during runtime as the demands traverse the application’s graph within an edge-cloud topology.
In this work, we leverage Dynamic Voltage and Frequency Scaling (DVFS) combined with the application’s
structure-represented as a Directed Acyclic Graph (DAG)-to determine optimal configuration for each service.
Our goal is to perform assignments that optimize the weighted combination of the application’s execution time
(i.e., the resulting critical path’s length) and the total energy consumption, subject to node capacity and power
constraints, the communication limits of the microservices, and the different frequency levels of the processing
units. The problem is initially modeled as a Mixed Integer Linear Problem (MILP). To tackle its complexity,
we segregate the problem into two closely related subproblems. The first is addressed by a genetic algorithm,
while a best-fit heuristic algorithm obtains the final solution, leveraging the genetics’ decisions. Extensive
simulations demonstrate the efficiency of the proposed mechanism by contrasting its results with two baseline
policies, while highlighting the inherent trade-offs between performance and energy consumption.
1 INTRODUCTION
The increasing complexity of modern applications is
progressively pushing traditional monolithic designs
out of the spotlight. As a result, the cloud native ap-
plication model (Auer et al., 2021) is adopted, leading
to a paradigm shift from classic monolithic structures
to flexible microservice-based architectures. This
trend is evident in a wide range of applications:
from simple machine learning model pipelines, smart
home applications, and predictive maintenance sys-
tems to applications such as Netflix (Mauro, 2015)
and Uber (Gluck, 2020). The fine-grained decom-
position of monolithic entities into distinct compo-
nents grants significant advantages in terms of per-
formance, scalability, and flexibility. Deploying and
scaling each component individually enables the ap-
plication to span multi-tenancy and multi-technology
environments in search for the most suitable resource
type according to its specific requirements.
However, with the emergence of new applications,
these requirements become more stringent, especially
in terms of end-to-end latency, creating challenges
for the resource orchestration mechanisms. For in-
stance, remote surgery operations require immediate
responses, even below 1 millisecond (Gupta and et al.,
2021). From the infrastructure operator’s perspec-
tive, increased latency can result in revenue loss, with
Amazon reporting that every additional 100 ms of ex-
perienced user latency incurs a 1% loss during traffic
spikes (Einav, 2023). Even in such enterprise environ-
ments, applications are transforming from batch jobs
to low-latency services. Facilitated by frameworks
such as Apache Spark and X-Stream, memory inten-
sive tasks such as big-data and graph analytics are
significantly accelerated through in-memory data pro-
cessing (Chen et al., 2019), constrained by the avail-
able computing capabilities.
To address the limitations of the traditional ”all-to-
cloud” approach- in terms of delay when transmitting
to remote data-centers- computation resources are de-
ployed at the network periphery, giving rise to the
well-known concept of “edge computing”. This ar-
chitecture model complements cloud computing by
alleviating part of the computing burden, while min-
imizing latency thanks to the spatial proximity of the
edge servers to data-generation points (Atieh, 2021).
Unfortunately, the edge layer inherently possesses
Kontos, G., Soumplis, P. and Varvarigos, E.
Optimization of Cloud-Native Application Execution over the Edge-Cloud Continuum Enabled by DVFS.
DOI: 10.5220/0013291600003950
In Proceedings of the 15th International Conference on Cloud Computing and Services Science (CLOSER 2025), pages 37-48
ISBN: 978-989-758-747-4; ISSN: 2184-5042
Copyright © 2025 by Paper published under CC license (CC BY-NC-ND 4.0)
37

a mere fraction of the cloud’s computing capacity,
while the associated hardware is generally less pow-
erful in terms of performance (Dally et al., 2020).
Microservices, despite being dedicated and
loosely coupled, they are not entirely self-contained
in practice. Communication-based dependencies
manifest in various forms, such as data exchange,
querying, and result forwarding (Luo and et al.,
2022), forming complex execution paths. These paths
emerge at runtime and can be accurately represented
by Directed Acyclic Graphs (DAGs) (Convolbo and
Chou, 2016), where each node represents a microser-
vice and each arc signifies a downstream relationship
between connected services. The critical path is the
path with the longest end-to-end latency, thus bound-
ing the total execution time of the application.
Accelerating the processing of a service can be
achieved through various methods. Code-level op-
timizations—such as vectorization, parallelization,
and improved data locality—can significantly boost
performance but rely heavily on developer exper-
tise. From the resource orchestrator perspective,
computing-intensive services can be accelerated by
increasing the processing unit’s frequency. To this
end, we leverage Dynamic Voltage Frequency Scal-
ing (DVFS), a well-established technique that allows
processors to adjust their operating frequency and
voltage, exploiting a trade-off between performance
and energy efficiency (Papadimitriou et al., 2019)
during the resource allocation process. Strategically
applying DVFS based on the criticality of services
within the application’s DAG enables performance
gains while minimizing power wastage. The latter
is of paramount importance, not only for its envi-
ronmental impact but also for the sustainability and
longevity of the infrastructure.
The aim of this work is to optimize microservice-
based applications on the edge-cloud continuum by
assigning microservices to infrastructure nodes and
processing devices. Leveraging the DAG structure
of the applications, we can identify critical and non-
critical execution paths. This allows us to acceler-
ate critical services—by placing them on high-end
processors operating at higher frequencies—to min-
imize overall execution time, while conserving power
and energy in less congested areas—by deploying ser-
vices on low-power, lower-frequency devices.
The remainder of this study is organized as fol-
lows: Section II reports on the related work, under-
scoring our contribution. Section III introduces the
system model, while section IV provides a compre-
hensive formulation of the examined problem. Sec-
tion V demonstrates the developed mechanism. Sec-
tion VI details the experimental setup and presents the
simulation results. Finally, section VII concludes our
study and hints on future work directions.
2 RELATED WORK
Processor frequency scaling has been extensively
studied in contemporary research as a means to man-
age the performance-energy consumption trade-off.
In (Zidar et al., 2024), the authors employ DVFS to
optimize energy consumption in ultra-low-power em-
bedded systems. They propose a mechanism that dy-
namically adjusts the processor’s frequency, operat-
ing at the lowest frequency during periods of low de-
mand and scaling up during intensive tasks to maxi-
mize efficiency. Similarly, the study in (Dzhagaryan
and Milenkovi
´
c, 2014) investigates the trade-off be-
tween performance and energy consumption by uti-
lizing DVFS and thread scaling on server processors.
The results highlight that higher frequencies yield
performance gains; interestingly, energy efficiency is
not attended at the minimum frequency, as a conse-
quence of the prolonged execution time.
Garcia et al. (Garcia et al., 2020) analyze the im-
pact of various policies implemented by Linux Gov-
ernors (e.g., performance, powersave, ondemand) on
performance and energy efficiency. Additionally, in
(Papadimitriou et al., 2019), different voltage and fre-
quency settings combined with various process place-
ment strategies are explored to assess their effects on
performance and energy efficiency.
Application acceleration can be enhanced by tar-
geting specific bottlenecked services instead of deal-
ing with the entirety of a microservice-based appli-
cation. CRISP (Zhang et al., 2022) employs critical
path analysis over large traces of microservice call
graphs in order to pinpoint and optimize crucial ser-
vices. The mechanism was deployed across the entire
UBER network and successfully identified optimiza-
tion opportunities. The authors of (Qiu et al., 2020)
introduce FIRM, a ML-enabled framework aiming
to reduce service level objective (SLO) violations in
microservice-based application workloads. A sup-
port vector machine (SVM) mechanism is employed
to initially detect critical paths in application struc-
tures and subsequently single out the specific services
responsible for SLO violations. A Deep Determin-
istic Policy Gradient (DDPG) reinforcement learning
algorithm is developed to efficiently re-provision re-
sources on the critical services.
Somashekar et al. (Somashekar and et al., 2022)
investigate the problem of fine-tuning individual con-
figuration parameters for microservices that lie on the
critical path of application structures. A dimension-
CLOSER 2025 - 15th International Conference on Cloud Computing and Services Science
38

ality reduction technique is utilized to reduce the ex-
ploration space by identifying only a subset that con-
tains the most important configuration parameters for
each service. Then, the fine-tuning is performed at
runtime by an iterative process that perturbs the exist-
ing configuration and evaluates the result. Song et al.
(Song and et al., 2023) demonstrate ChainsFormer, a
framework that identifies critical chains and nodes in
microservice-based applications based on a predictor
module, and subsequently provision resources lever-
aging a SARSA reinforcement learning algorithm.
Previous studies generally focus on specific re-
sources or clusters (e.g., a single data center). In con-
trast, our study examines the complexities of serving
microservice-based applications over the edge-cloud
continuum, accounting for device heterogeneity and
communication delays. While prior work primar-
ily enhances resources through traditional horizon-
tal (replication) and vertical (resource augmentation)
scaling, we leverage, for the first time, DVFS along
with the application’s dependencies, represented as
a DAG, to determine optimal configurations for mi-
croservices. Additionally, related studies often as-
sume a fixed deployment scheme and only enhance
the pre-established critical path at runtime, which can
lead to inefficient resource use as new critical paths
and services emerge. To our knowledge, though this
limitation is recognized in the literature, it has not
been directly addressed. Our approach, however, con-
siders all possible execution paths of the application
during runtime and attempts to identify the optimal
configuration based on the resulting critical path.
3 SYSTEM MODEL
3.1 DVFS, Execution Time and Power
Consumption Model
Dynamic Voltage-Frequency Scaling enables the dy-
namic adjustment of the frequency at which a pro-
cessing unit operates, based on the current workload
and desired objectives (e.g., minimizing power con-
sumption or maximizing performance). By increas-
ing the CPU frequency—and consequently the volt-
age—performance is enhanced during intensive task
execution. Conversely, decreasing the CPU frequency
conserves power and reduces thermal output, albeit
at the expense of reduced performance. The underly-
ing hardware must support multiple power and perfor-
mance states (often termed P-states), which is com-
mon in most modern processors, ranging from edge
devices (microprocessors and typical desktop/laptop
CPUs) to high-end server processors.
DVFS can be realized through a variety of tech-
niques that provide interfaces, policies, and/or con-
trols to adjust CPU frequencies and voltages at dif-
ferent levels: Linux kernels support frequency scal-
ing configured directly in the OS through the use of
governors, which are a set of different policies (e.g.,
Performance, Power-Save, On-Demand) that auto-
mate the scaling process based on the system load
and the desired objective. Third party tools such as
AMD Ryzen Master and Intel XTU allow for manu-
ally scheduling the desired CPU frequency while also
providing a set of telemetry tools for monitoring real-
time power consumption and component temperature,
among others. Moreover, many modern computing
systems allow frequency and voltage adjustments di-
rectly via the BIOS/UEFI firmware settings.
In this work, we assume the availability of per-
core DVFS, allowing the individual and independent
tuning of each core in multi-core systems. This
fine-grained control adapts to the specific needs of
each processing core, aligning with the demands of
microservice-based applications. Per-core DVFS is
available on most newer-generation processors.
To estimate the execution time of a microservice,
which is ultimately a piece of executable code, we
employ the well-known formula:
T =
Number of Instructions × CPI
f
(1)
In this equation, the Number of Instructions
can be determined by analyzing the code, while CPI
(Cycles Per Instruction) refers to the average num-
ber of CPU cycles required to execute one instruc-
tion. Different instruction types require varying num-
bers of cycles. For instance, a typical register bit-wise
addition in Assembly requires between one and two
cycles, whereas a division operation takes up to 20
cycles. Control operations such as branches (e.g., if
statements) and loops heavily depend on the branch
prediction mechanism and can consume several hun-
dred cycles in case of mispredictions. Finally, f
represents the operating frequency of the processing
unit. This work focuses on compute intensive ser-
vices, therefore we consider computing frequency to
be the determining factor of the execution time. Nev-
ertheless, we can safely assume timely data-fetching
using in-memory computations with the newest gen-
eration of Double-Data-Read (DDR) RAM memories
throughout the infrastructure.
Regarding power consumption (P) and its rela-
tionship with frequency, we use the formula:
P = C ×V
2
× f (2)
Here C is the effective switching capacitance de-
pending on the chip architecture and activity factor, V
Optimization of Cloud-Native Application Execution over the Edge-Cloud Continuum Enabled by DVFS
39

is the supply voltage, and f is the operating frequency.
At first glance, this formula suggests that power con-
sumption is linearly correlated with f . However, in
practice, utilizing DVFS involves scaling up the fre-
quency, which often necessitates a corresponding in-
crease in voltage to maintain stable operation.
The relationship between voltage and frequency
is not strictly linear and varies even among proces-
sors of the same family due to manufacturing varia-
tions—a phenomenon known as the ”silicon lottery.”
Therefore, one can estimate the power at a specific
frequency based on surrogate functions such as the
one employed in (Hua et al., 2023), or any data mea-
sured or disclosed by manufacturers.
3.2 Infrastructure Description
We consider a hierarchical edge-cloud infrastructure,
represented by a graph G = (V,E). Each node v ∈ V
represents a geographical location with collocated de-
vices (e.g., a micro-datacenter) and arcs e ∈ E de-
scribe the networking connections between differ-
ent nodes. Let D be the total number of distinct
types of devices encompassed in the infrastructure,
indexed by d = 1,..., D. A device denotes a specific
model of a computing system that can execute mi-
croservices, ranging from general-purpose consumer
CPUs to high-end server processors and GPUs. Each
device d possesses a total of C
d
processing cores.
Therefore, each node v ∈ V is characterized by a tu-
ple c
v
= [c
v,1
,c
v,2
,..., c
v,D
], indicating the cumulative
availability (in terms of the number of available cores)
of each type of device at that node (with c
v,d
= 0 if
device d is not available at node v, or when all the
available cores are currently occupied).
Moreover, each device type d ∈ {1,2,.. ., D} is
characterized by its minimum and maximum operat-
ing frequencies f
d
min
and f
d
max
, depending on its spec-
ifications. We consider a frequency step ∆ f
d
for each
type of device d. Hence, the DVFS controller can
fine-tune the frequency of a core of a processor d at
any level f
d
= f
d
min
+ α · ∆ f
d
,a ∈ N
+
in the feasible
region F
d
= [ f
d
min
, f
d
max
]. Each individual frequency
level f
d
has an associated power consumption P( f
d
),
based on Equation 2 or any other data disclosed from
the manufacturer. Finally, each node v ∈ V has a
”power budget” e
v
, which is essentially the maximum
power it can sustain at any given time, constrained by
the established power and cooling systems.
3.3 Application Description
A cloud-native application a encompasses a total of
I
a
microservices, which can be represented by a Di-
rected Acyclic Graph (DAG) G
a
= (V
a
,E
a
). Nodes
v
i
∈ V
a
represent the microservices of application a,
where i = 1,2,... ,I
a
. Each microservice i of appli-
cation a is characterized by the tuple [r
i
,L
i
]. Variable
r
i
represents the estimated required processing cycles
for the service’s execution, as the product of the in-
struction set of its underlying code with the estimated
cycles per instruction (Equation 1). Weight L
i
is the
communication delay limit of the service. Assuming
that g
a
∈ V denotes the data-source node of applica-
tion a, some microservices are responsible for com-
municating critical results with the end-user or other
entities in a timely manner, and therefore require the
delay between the data-source node and the service
node v to not exceed their predefined maximum, that
is l
g
a
,v
≤ L
i
. We use l
g
a
,v
to describe the delay, ab-
stracting the underlying physical network connection
between the application and an infrastructure node
into a single value, which can be determined, for in-
stance, by applying shortest path algorithms.
The execution time of microservice i on a core of
device d operating at frequency f
d
can be calculated
using:
t
i,d, f
d
= δ
i,d
×
r
i
f
d
, (3)
The coefficient δ
i,d
accounts for the fact that high-
end server processors generally perform better at the
same clock speed (frequency) compared to edge-
device processors, due to their faster cache memories,
better pipeline structures, support for ECC memory,
and advanced branch prediction mechanisms, among
others. However, for typical consumer applications
such as gaming, web-browsing, or standard working
online tools, the performance deviations are insignif-
icant. Hence, depending on the type of service and
the device, the execution time may vary beyond the
simplified formula on Equation 1.
Furthermore, according to (Chen et al., 2019),
time sharing the same physical core—even across
different hyper-threads—results in significantly lower
throughput for compute-intensive applications due to
resource contention (e.g., ALUs, caches, pipelines).
Therefore, we adopt a one-to-one mapping between
services and cores to ensure that the theoretically
achievable execution times are efficiently approxi-
mated in practice. We also consider microservices
that require multiple processing cores due to their par-
allel structure. In our context, such services are mod-
eled as multiple parallel single-core microservices
equal in number to the cores required by the origi-
nal service. Nonetheless, microservices are typically
designed to complete specific sub-tasks of an applica-
tion and usually do not require more than one core.
Figure 1 presents an example of a smart surveil-
CLOSER 2025 - 15th International Conference on Cloud Computing and Services Science
40

Figure 1: Example of the proposed System Model.
lance application. Sensor data initiates a sequence
of microservice interactions: Smart cameras, smoke
and motion detectors are uploading raw streams to a
data processing microservice. The latter undertakes
data cleaning tasks such as de-colorization, quality
enhancement and frame selection. The refined data
are forwarded in parallel to three microservices. The
first performs anomaly detection, essentially identify-
ing any operational malfunctions of the end devices.
If a malfunction is reported, it is forwarded to the sub-
sequent service for further inspection, and finally up-
loaded for in-depth analysis. The second service per-
forms face extraction on the data, and forwards iso-
lated bounding-boxes to a face recognition microser-
vice, responsible for identifying the depicted people
by contrasting the images to a database. The alarm
signaling microservice is triggered in case of identi-
fication of unauthorized parties, along with the emer-
gency call to the appropriate authority. The fire detec-
tion and extinction path is operating accordingly.
The entire edge-cloud cluster is governed by a
centralized orchestrator (e.g., Kubernetes). Upon
receiving the application’s Directed Acyclic Graph
(DAG) and the corresponding microservice require-
ments, the orchestrator utilizes the proposed mecha-
nisms to determine the optimal configuration for each
microservice, specifying the target device, operating
frequency, and node assignment. Once the assign-
ments are established, the orchestrator communicates
these configurations to the Dynamic Voltage and Fre-
quency Scaling (DVFS) controllers on each respective
node through a standardized API or secure messag-
ing protocol. The DVFS controllers then adjust the
frequency of the designated cores on the selected de-
vices accordingly. As discussed in subsection 3.1, the
DVFS controllers can range from automated changes
in the BIOS/UEFI settings of their assigned devices
to OS-level controls and third-party tools that enable
frequency scaling.
Our mechanism aims to provide a collective as-
signment of microservices to infrastructure nodes and
devices, with the objective of minimizing a weighted
combination of the application’s execution time (i.e.,
the resulting critical path’s length) and the total en-
ergy consumption, subject to node capacity and power
constraints, the delay limits of the microservices, and
the available frequency levels of the processing units.
4 PROBLEM FORMULATION
Upon selecting an assignment tuple
[node,device, f requency] for the deployment of
each microservice, a set of M paths emerge, each
characterized by its execution time q
m
,∀m ∈ M. The
critical path κ ∈ M is the one with the longest exe-
cution time, that is q
κ
≥ q
m
,∀m ∈ M. Furthermore,
let m
i
= 1 if the i
th
microservice is a member of the
execution path m ∈ M, and 0 otherwise.
Before we mathematically describe the problem,
we introduce some extra notation: Decision variable
x
i,v,d, f
d
equals to 1 if the i
th
microservice is assigned
to infrastructure node v and a core of a device of type
d, operating at frequency f
d
, and 0 otherwise. A
tightly coupled variable y
i,d, f
d
is equal to 1 if there is
any node on which x
i,v,d, f
d
= 1. We use y to describe
the higher-level assignment on device and frequency
level, irregardless of the specific infrastructure node.
For ease of reference, the complete set of variables
along with the corresponding interpretations are pre-
sented in Table 1.
The execution time of service i can be defined as:
t
i
=
D
∑
d=1
∑
f
d
∈F
d
t
i,d, f
d
· y
i,d, f
d
(4)
Therefore, the execution time of path m ∈ M, q
m
,
can be calculated as the cumulative execution time of
Optimization of Cloud-Native Application Execution over the Edge-Cloud Continuum Enabled by DVFS
41

Table 1: Summary of Notations.
Notation Interpretation
G = (V, E) Directed weighted graph representing the infrastructure
V Set of infrastructure nodes
E Set of network links between nodes
D Set of different types of processing devices in the infrastructure
C
d
Number of cores of device of type d
c
v,d
Remaining cumulative capacity of device of type d situated in node
v
f
d
min
Minimum operating frequency of device d
f
d
max
Maximum operating frequency of device d
∆ f
d
Frequency step for DVFS on device d
F
d
Set of feasible frequency levels of device d
P( f
d
) Power consumption of a core of device d at frequency f
d
e
v
Power limit of node v
a A microservice-based application
G
a
Directed acyclic graph representing application a
I
a
Total number of microservices of application a
r
i
Required processing cycles for the execution of service i
L
i
Communication delay limit of microservice i
g
a
∈ V Data source node of application a
δ
i,d
Coefficient to adjust the execution time of service i on device d
t
i,d, f
d
Execution time of service i on device d and frequency f
d
x
i,v,d, f
d
Decision variable, equal to 1 if the i
th
microservice is assigned to
node v and a core of device d operating at f
d
y
i,d, f
d
Variable equal to 1 if the i
th
microservice is assigned to a core of
device d operating at f
d
M Set of application’s execution paths
m
i
Variable equal to 1 if the i
th
microservice is part of the execution
path m ∈ M
q
m
Execution time of path m ∈ M
κ ∈ M The application’s critical path
t
i
Execution time of service i
T The application’s execution time
ε
i
Energy consumption of service i
E The application’s energy consumption
the services that lie on the path:
q
m
=
I
a
∑
i=1
t
i
· m
i
(5)
The execution time of the application, T , is the
execution time of the resulting critical path:
T = q
κ
= max
m
q
m
(6)
The energy consumption of service i, ε
i
, can be
calculated as the product of the power consumption
with its execution time:
ε
i
=
D
∑
d=1
∑
f
d
∈F
d
P( f
d
) ·t
i,d, f
d
· y
i,d, f
d
(7)
Hence, the total energy consumption E for the ap-
plication’s execution is the sum of all individual ser-
vices:
E =
I
a
∑
i=1
ε
i
(8)
4.1 MILP Formulation
The objective function is the minimization of a
weighted combination of the execution time and the
total energy consumption for the application’s execu-
tion. The weight coefficient w is used to control the
relative importance of each objective:
min
{
w · T + (1 −w) ·E
}
(9)
Subject to the following constraints:
C.1 Each service i = 1, .. ., I
a
must be assigned to
exactly one node and one device type configured at a
CLOSER 2025 - 15th International Conference on Cloud Computing and Services Science
42

specific frequency:
∑
v∈V
D
∑
d=1
∑
f
d
∈F
d
x
i,v,d, f
d
= 1, ∀i = 1, ...,I
a
(10)
C.2 Decision variables x and y are coupled by the
following constraint:
y
i,d, f
d
=
∑
v∈V
x
i,v,d, f
d
, (11)
∀i = 1,. .. ,I
a
,∀d = 1,... ,D, ∀ f
d
∈ F
d
C.3 Node capacity constraint. Each service is as-
signed to one core on a processing device; therefore,
the total services assigned to a device cannot exceed
the available cores in the node:
I
a
∑
i=1
∑
f
d
∈F
d
x
i,v,d, f
d
≤ c
v,d
, ∀v ∈ V, ∀d = 1,..., D
(12)
C.4 Node power constraints. The cumulative ac-
tive power of the processors should not exceed the
power limit of the node:
I
a
∑
i=1
D
∑
d=1
∑
f
d
∈F
d
P( f
d
) · x
i,v,d, f
d
≤ e
v
, ∀v ∈ V (13)
C.5 Services’ communication limit. Every service
must be assigned to a node that respects the delay
limit with the data-generation node g
a
:
l
v,g
a
· x
i,v,d, f
d
≤ L
i
,
(14)
∀i = 1,. .. ,I
a
,∀v ∈ V, ∀d = 1, .. ., D,∀ f
d
∈ F
d
Formulated as a Mixed Integer Linear Problem
(MILP), the considered problem combines elements
from the assignment problem and critical path analy-
sis, inherently positioning it in the NP class.
5 META-HEURISTIC
MECHANISM
The formulated problem considers the deployment of
one microservice-based application. Thus, a solution
must be acquired for each incoming application in a
timely manner, especially for time-critical workload.
This motivates us to develop a meta-heuristic mecha-
nism to tackle the increased problem’s complexity.
5.1 Problem Decomposition
The primary problem is decomposed into two dis-
tinct yet closely linked sub-problems. The first prob-
lem involves mapping services to device types and
frequency levels without accounting for the practi-
cal limitations of the existing infrastructure, such as
node capacities and service delay requirements. This
is referred to as the Configuration Selection prob-
lem. Its solution comprises the configuration tu-
ple [device, f requency] for each microservice, corre-
sponding with the y
i,d, f
d
variables.
The second sub-problem focuses on integrating
this configuration within the actual infrastructure.
Given the optimal y
i,d, f
d
variables, the task is to de-
termine the corresponding x
i,v,d, f
d
variables. Thus,
this second problem is termed the Resource Alloca-
tion and Deployment problem, as its solution obtains
the final deployment tuple [device, f requency,node]
for each service.
By segregating the problem into a high-level as-
signment and a subsequent detailed mapping phase,
the overall complexity is significantly reduced. Yet,
this separation necessitates strategic considerations
to ensure seamless interoperability between the two
mechanisms. Instances may arise where solutions ob-
tained from the Configuration problem are infeasible
in the actual deployment due to inherent constraints.
To mitigate such conflicts, it is essential to incorporate
relevant high-level constraints within the Configura-
tion problem. A complementary technique is to add
complexity to the mechanism that addresses the Re-
source Allocation and Deployment problem so as to
identify quality alternatives in case of misalignments
with the exact solution of the Configuration problem.
5.2 Genetic Algorithm for the
Configuration Selection Problem
Genetic algorithms are a great option when dealing
with vast solution spaces that are not highly con-
strained (Li and Zhu, 2020). For this reason, we
choose to employ a genetic algorithm for the Config-
uration Selection problem. This way, the genetic can
explore diverse solution spaces without the overhead
of managing excessive constraints. Below we intro-
duce the algorithm and the associated procedures.
5.2.1 Chromosome Encoding
In the context of genetic algorithms, chromosomes
encode the solution to a problem, analogous to how
real chromosomes encode the features of an individ-
ual. In our case, each chromosome represents a com-
plete assignment of each microservice of an applica-
tion to a device type and an operating frequency, that
is the tuple
[[d
1
, f
d
1
],[d
2
, f
d
2
],..., [d
I
a
, f
d
I
a
]]
Optimization of Cloud-Native Application Execution over the Edge-Cloud Continuum Enabled by DVFS
43

, where d
i
is the selected device for microservice i and
f
d
i
represents the chosen operating frequency.
5.2.2 Fitness Function Evaluation
Given an encoded chromosome, the fitness function
aims to evaluate the ”goodness” of its genetic profile.
Following the objective function (Equation 9), we use
the weighted combination of the execution time and
energy consumption of the chromosome’s configura-
tion. Based on the assignment provided by the chro-
mosome [[d
1
, f
d
1
],[d
2
, f
d
2
],..., [d
I
a
, f
d
I
a
]], we can ex-
tract the execution time of each service based on
Equation 3. The energy consumption can be straight-
forwardly computed using Equations 7 and 8. For
the application’s execution time, we need to identify
the resulting critical path in order to apply Equations
5 and 6. The critical path is the longest path from
any source node (with no incoming edges) to any sink
node (with no outgoing edges), where the path length
is the sum of the execution times of the nodes (ser-
vices) along the path.
To this end, we employ a simple algorithm based
on Dynamic Programming (Algorithm 1). The topo-
logical sort guarantees that every node is examined
only after its predecessors, so that every node and ev-
ery edge is visited exactly once in the procedure. For
each node, its earliest completion time (L[i]) is the
sum of its own completion time and the maximum
of the completion times of its preceding nodes. Af-
ter calculating for every node, the critical path is ex-
tracted as the maximum among these values. The al-
gorithmic complexity of the algorithm is O(V + E),
where V is the number of nodes and E is the number
of edges in the application’s DAG.
Algorithm 1: Critical Path Algorithm.
Input: An application DAG G(V,E);
execution times t[i] for each service
i ∈ V
Output: critical path length T
critical
1 Initialize L[i] ← 0 for all nodes i ∈ V ;
2 top order ← TopologicalSort(G);
3 foreach node i in top order do
4 if in-degree(i) = 0 then
5 L[i] ← t[i];
6 else
7 L[i] ← t[i] + max
j∈pred(i)
L[ j];
8 end
9 end
10 T
critical
← max
i∈V
L[i];
11 return T
critical
;
5.2.3 Selection, Crossover, Mutation and Elitism
Once the initial population is established, parent chro-
mosomes must be selected to contribute their ge-
netic material to the creation of offspring. We imple-
mented a stochastic ranking-based selection method,
which increases the likelihood of selecting high-
fitness individuals while maintaining population di-
versity. Specifically, chromosomes are ranked in as-
cending order based on their fitness scores. The prob-
ability of selecting a chromosome at rank i is calcu-
lated as (X − i + 1)/total, where X is the population
size and total = X · (X + 1)/2.
For the crossover operation, we employed uniform
crossover to ensure a thorough mix of the selected
parent’s characteristics in the offspring. Every mating
operation results in two offspring: The first inherits
each gene (device and frequency configuration for a
service) with α% probability from the first parent and
with (1−α)% from the second parent, while the exact
opposite applies to the second offspring.
Additionally, each offspring undertakes a muta-
tion either in device, frequency, or both compartments
of each gene. First, an initial mutation probability for
device β
d
and frequency β
f
, is set. However, in or-
der to exploit the evolved generations, this probabil-
ity decays at a rate of 1 −
c
N
, where c is the current
generation and N is the total number of generations.
Algorithm 2: Genetic Algorithm.
Input: Initial chromosome population,
population size X, number of
generations N, number of elites E
Output: Best resulting chromosome
1 foreach generation n in 1 to N do
2 Rank chromosomes based on their fitness;
3 Extract top E elites and copy them to the
next generation;
4 Initialize next generation population with
the E elites;
5 while current population size < X do
6 Perform rank-based selection;
7 Perform crossover on selected
chromosomes to produce offspring;
8 Add offspring to the next generation
population;
9 end
10 Perform mutation operation on the
offspring in the next generation;
11 end
12 return top-performing chromosome of
generation N;
CLOSER 2025 - 15th International Conference on Cloud Computing and Services Science
44
Finally, we utilized the elitism feature to ”save”
good solutions throughout generations, while making
sure that the best-fitting chromosome at one genera-
tion is no worse than that of the previous one. This
means that the highest-performing chromosomes are
copied to the next generations unchanged. The pseu-
docode for the algorithm is presented in Algorithm 2.
5.3 Best-Fit Heuristic Algorithm for the
Resource Allocation and
Deployment Problem
Upon receiving the best configuration for the appli-
cation’s services (y variables), the heuristic attempts
to map this configuration into the infrastructure. The
algorithm performs the assignment for each service
sequentially. After selecting a service i and its con-
figuration d
i
, f
d
i
, it first identifies nodes that have the
required capacity of the selected device. Then, nodes
that do not respect the delay-limit of the service are
pruned. The algorithm proceeds to place the service at
the node which has the largest “power-capacity”, i.e.,
the one which is percentage-wise the furthest from
meeting his power constraint. This ensures a fair load-
balancing across the infrastructure and avoids over-
stressing specific nodes. The algorithm then proceeds
with the following microservice, until all are placed.
However, instances arise wherein the heuristic
cannot find a feasible mapping for the specified de-
vice and frequency level. In this case, it searches for
an alternative combination of device and frequency
that produces the “closest” objective value compared
to the original. This way, the final deployment of the
application might not be identical with the one sug-
gested by the genetic algorithm, but it will effectively
follow its effectiveness in terms of objective value.
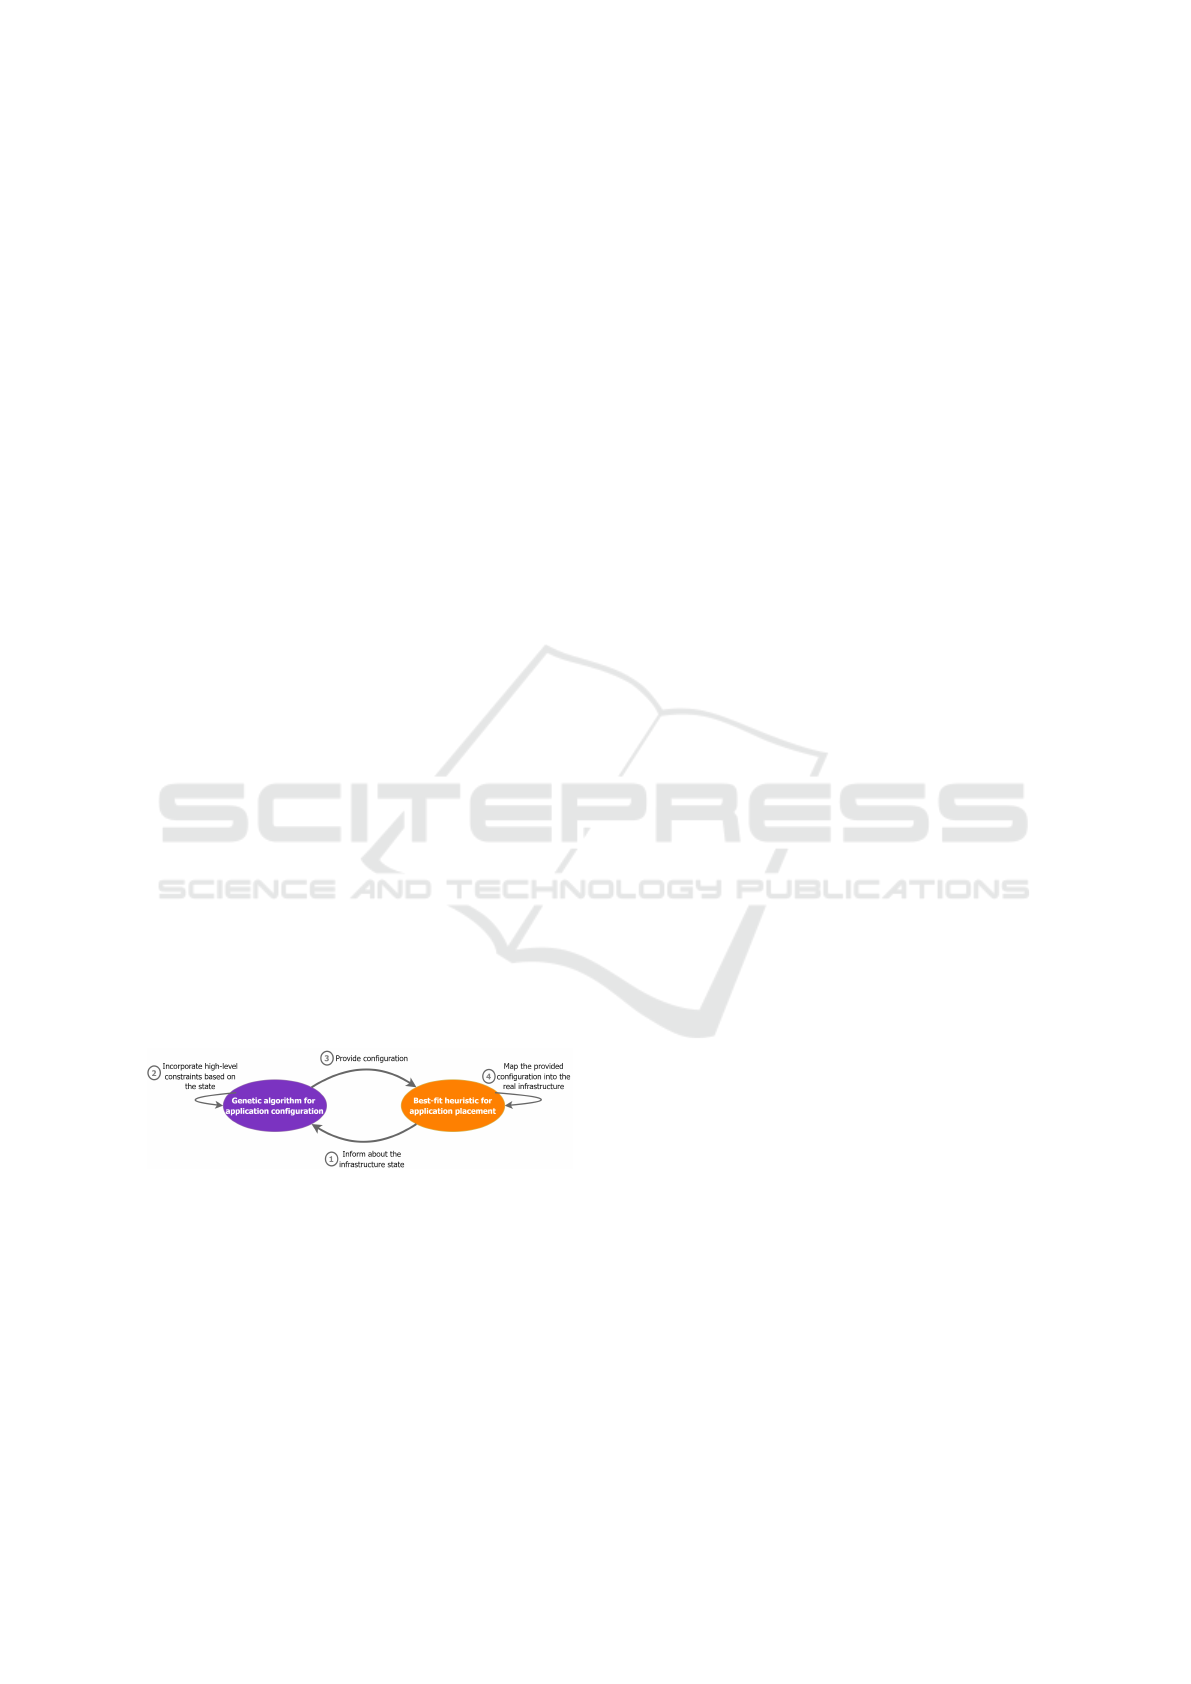
Figure 2: The interplay between the two developed mecha-
nisms.
Figure 2 shows the interplay between the devel-
oped genetic and heuristic mechanisms. Initially,
the heuristic algorithm, utilizing telemetry agents dis-
tributed across the infrastructure, provides the genetic
algorithm with real-time information on the infras-
tructure’s status. This includes data on delays relative
to the data source node, resource availability, power
constraints, and other relevant parameters.
In response, the genetic algorithm integrates these
constraints by modifying the initial population and
adjusting mutation rates to promote the generation
of feasible solutions. For example, considering a
service’s delay limit and the availability of devices
within nodes, the genetic algorithm initializes solu-
tions that incorporate only the available devices for
that service. Once it identifies the best chromosome,
this configuration is relayed back to the heuristic al-
gorithm. The latter performs the final resource bind-
ing, effectively deploying the application within the
infrastructure based on the optimized configuration.
6 EVALUATION
We conducted a series of experiments to showcase the
efficacy of the developed mechanisms along with the
trade-offs in the objectives for different weighting co-
efficients w. The genetic algorithm was implemented
in Python, utilizing the NetworkX library for the re-
alization of the application’s DAG. The heuristic al-
gorithm along with the infrastructure simulation were
developed in MATLAB. The experiments were con-
ducted on a Ryzen-7 32 GB RAM PC.
6.1 Experimental Setup
We considered 10 device types ranging from edge
microprocessors (e.g., NVIDIA Jetson Series) and
edge computer devices (e.g., Intel Core™ i7 series) to
high-performance server processors (e.g., Intel Xeon,
AMD EPYC). For each device, we set the f
d
min
to
50% of the disclosed base frequency (underclocking),
while we allow frequency tuning up to the max turbo
frequency specified by the manufacturer. Moreover,
most processors allow for a 100 Mhz frequency step
between the lowest and highest frequencies. How-
ever, we adopt a more coarse approach by creating 10
frequency levels for each device d, normalizing the
step ∆ f
d
accordingly. Some of the real-world pro-
cessing devices from which we drew the experimen-
tal values for the base and max frequencies are pre-
sented in (NVIDIA, 2024), (Wikipedia contributors,
2021). Regarding power consumption, we identified
measurements on Intel processors (Syed, 2021), and
used them as a guide to estimate power consumption
for the rest of the considered devices, combined with
the formula in (Hua et al., 2023). Generally, activat-
ing a server core requires more power than a core of a
microprocessor in the edge.
The infrastructure was modeled as a 3-layered
topology. The near-edge layer, the most proximal to
end-users, comprises a total of 30 nodes, each pos-
sessing between 1-5 micro-processing devices. The
Optimization of Cloud-Native Application Execution over the Edge-Cloud Continuum Enabled by DVFS
45
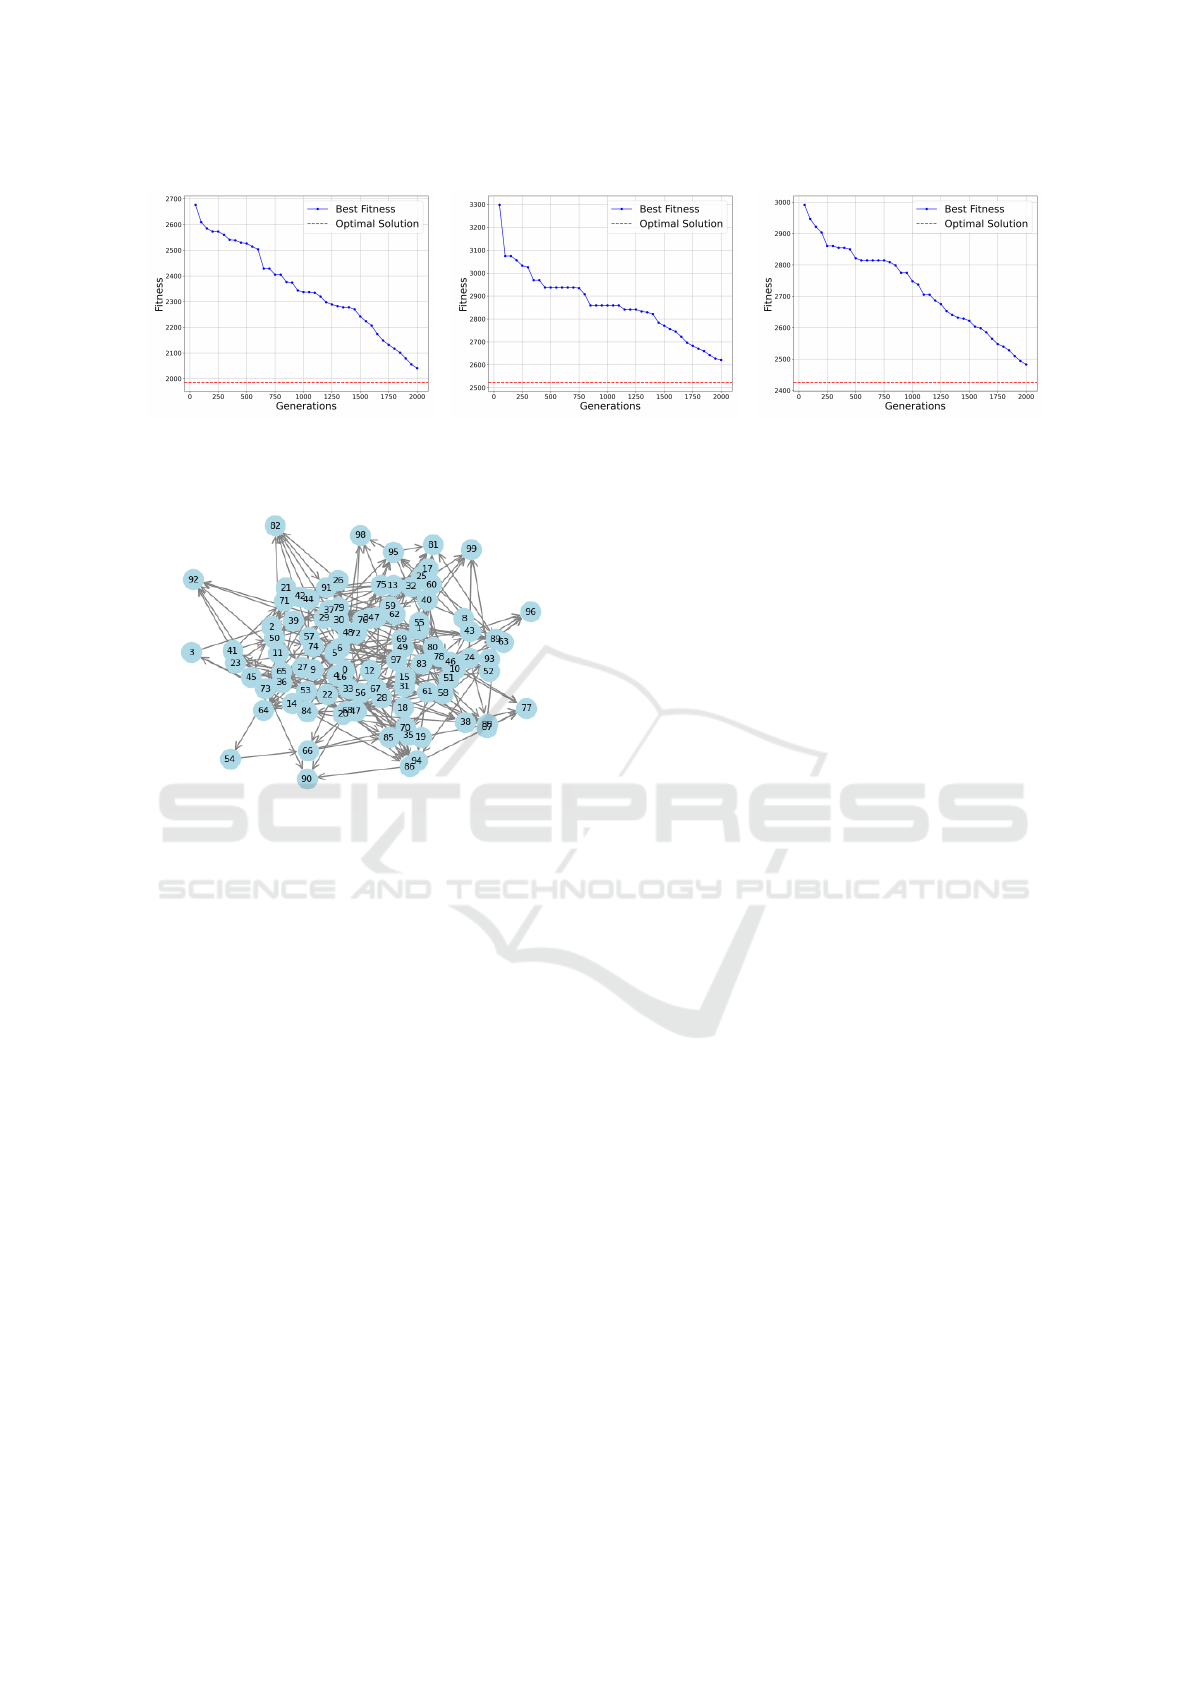
(a) w = 0.1. (b) w = 0.5. (c) w = 0.9.
Figure 3: Convergence of the Genetic Algorithm for Different Weight Values (w = 0.1, w = 0.5, w = 0.9). The horizontal red
dashed line represents the optimal solution.
Figure 4: Example of generated DAG.
delay between near-edge nodes and end-users was
normalized in the [0.5,2] delay units (d.u.) range. The
far-edge layer, positioned amidst the urban areas and
the remote Data Centers, includes 10 nodes, each of
which hosts 5-10 devices of medium capabilities. The
delay for this layer is set to [3,5] d.u. Finally, the
cloud layer consists of 2 nodes representing the core
Data Centers, equipped with 100 high-end server pro-
cessors. The power limit was set to 50% of the maxi-
mum achievable power (where all cores work at max
frequency) for near-edge nodes, while for the far-edge
and cloud the limit is 70% and 80% accordingly.
Microservices were assumed to demand between
0.1 and 10 Giga-Cycles for their processing, reflect-
ing their heterogeneity based on their scope. Coeffi-
cient δ
i,d
was set in the [1, 2] range, with some ser-
vices exhibiting minimal discrepancies between de-
vices, while others benefit more from the advanced ar-
chitecture of the server processors compared to edge.
In all experiments, the values of application delay
and energy consumption were normalized in the [0,1]
interval utilizing the max-min method. This approach
makes the weight parameter more intuitive; for ex-
ample, setting w = 0.5 implies that both metrics con-
tribute equally to the objective.
6.2 Evaluation Results
First, we evaluated the performance of the genetic al-
gorithm. To this end, we generated an application
comprising 100 microservices. The corresponding
DAG produced by the NetworkX is illustrated in Fig-
ure 4. The population size of the genetic algorithm
was initialized to 100 chromosomes. Regarding mu-
tation, we set the initial probability for both device
and frequency mutations for each gene to 15%. More-
over, elitism was employed, retaining the top 5% of
the population in each generation.
Figure 3 presents the genetic algorithm’s conver-
gence simulation results across different weight coef-
ficients w. After several runs, we chose to terminate
the genetic algorithm at 2000 generations, as it pro-
duced the best balance between performance and exe-
cution time. The resulting optimality gaps were 2.8%,
3.9% and 2.3% for w = 0.1, w = 0.5 and w = 0.9, re-
spectively. For w = 0.5, execution time and total en-
ergy consumption are considered equally, which com-
plicates the problem. The algorithm exhibited mono-
tonic convergence, facilitated by elitism, ensuring that
the best-fit individual in each generation was at least
as effective as in the preceding generation. Regarding
the execution time, by parallelizing the chromosome
evaluation, the genetic algorithm clocked in at 4.21
seconds on average, while the optimal solver based
on the PULP library averaged at 513 seconds. An ini-
tial deployment configuration lasting a few seconds
for a 100-microservice application is deemed accept-
able, as it remains comparable to other required steps,
such as fetching container images, building them, and
starting containers.
Next, we employed two baseline algorithms to
contrast their results with our proposed mechanism:
i) The ”Performance” policy aims to minimize the ap-
plication’s execution time by greedily assigning each
microservice to the [device, f requency] pair that of-
fers the lowest execution time within the infrastruc-
CLOSER 2025 - 15th International Conference on Cloud Computing and Services Science
46
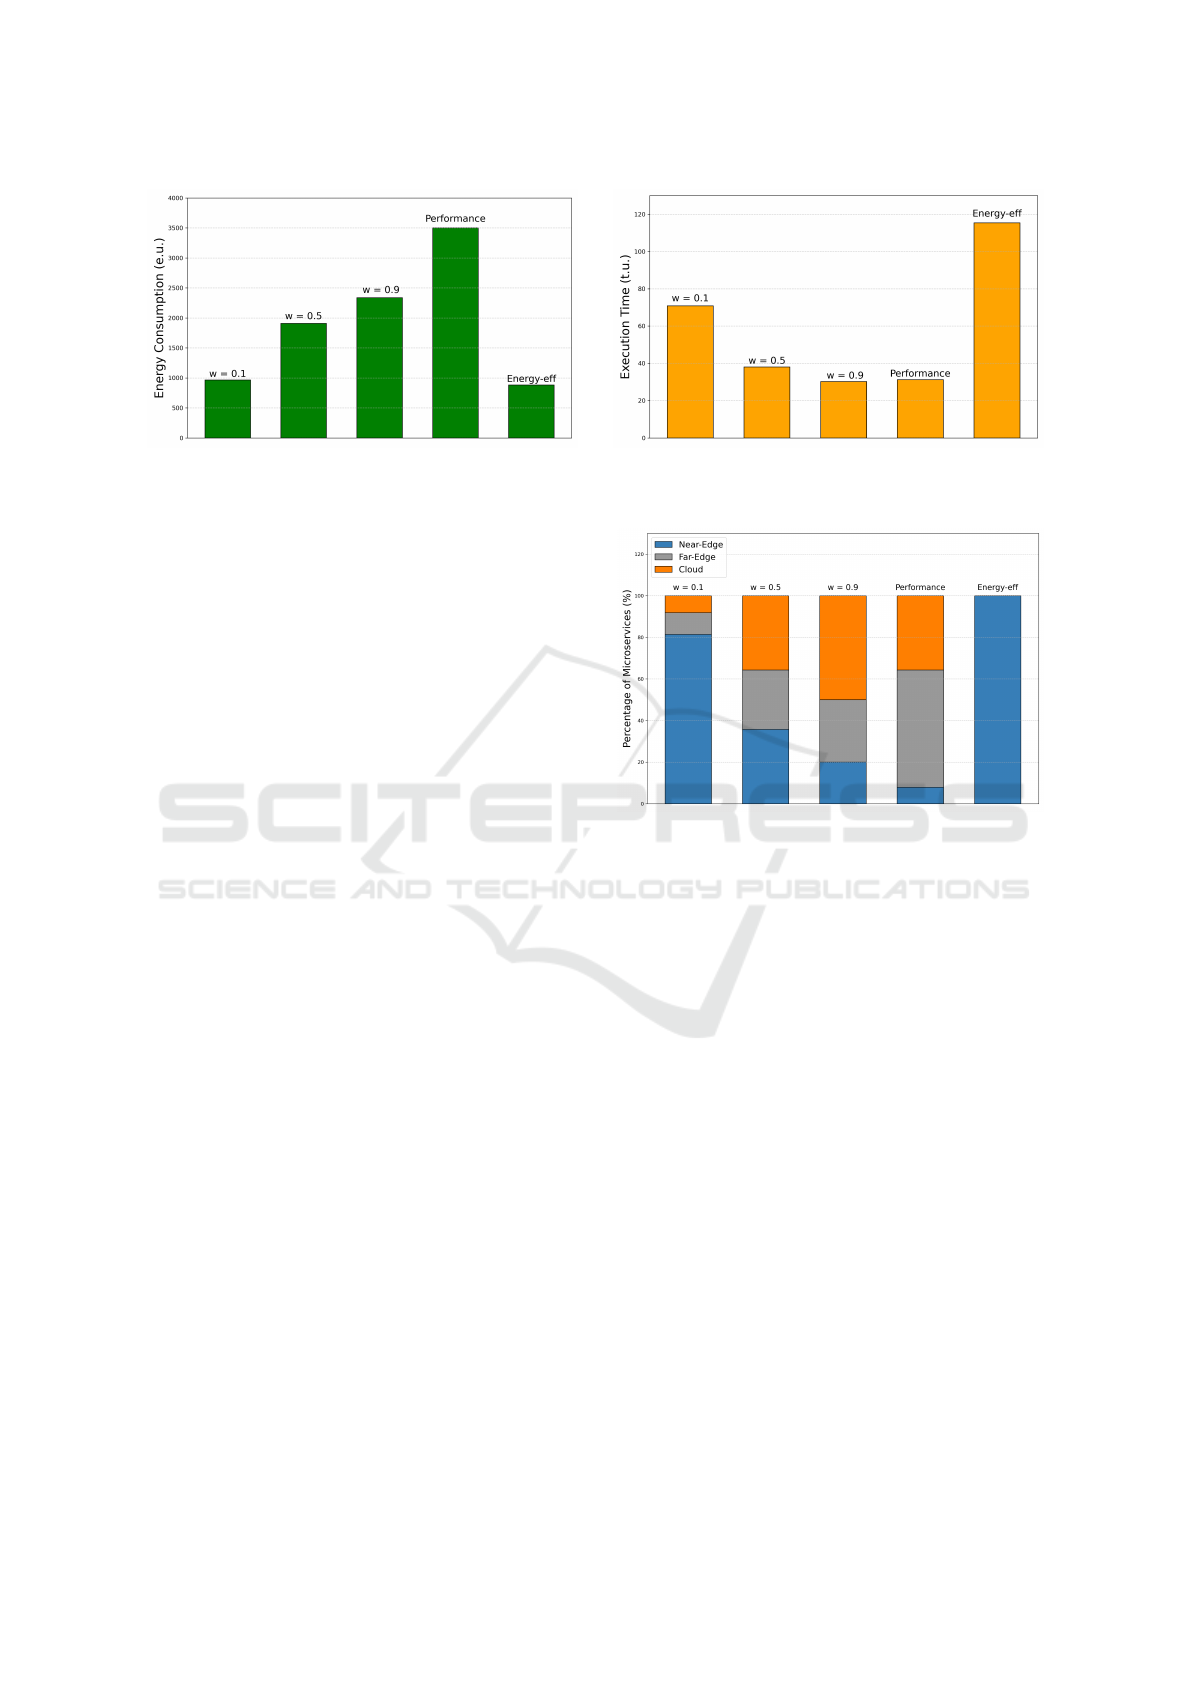
(a) (b)
Figure 5: Comparison of Energy Consumption and Execution Time Across Mechanisms.
ture and ii) The ”Energy efficiency” policy focuses on
minimizing energy consumption, by greedily assign-
ing each service to the [device, f requency] pair that
offers the lowest energy consumption.
Figure 5 presents the execution time, measured in
time units (t.u.) along with the total energy consump-
tion, measured in energy units (e.u.), across the dif-
ferent mechanisms. We tested three different weight
coefficients for our mechanism, w = 0.1, w = 0.5 and
w = 0.9, as indicated above the corresponding bars.
The lowest energy consumption was achieved by the
Energy-efficiency policy, outperforming our mecha-
nism when utilizing weight w = 0.1 by 8.2%. How-
ever, in terms of execution time, the Energy-efficiency
policy resulted in a 51.1% increment.
Interestingly, our mechanism, when tuned with
w = 0.9, outperformed the Performance policy in
terms of execution time by 3.2%. This is because
our developed metaheuristic calculates the resulting
critical path and thus optimizes the execution time of
the application as a whole. In contrast, the Perfor-
mance policy potentially wastes resources due to its
greedy nature. Additionally, the configuration pro-
vided by our mechanism managed to cut-down en-
ergy consumption by 31.5% compared to the Perfor-
mance Policy. By fine-tuning the weight coefficient,
our mechanism can intelligently balance objectives,
achieving enhanced performance without excessive
energy consumption (w = 0.9), improved energy ef-
ficiency without significant performance degradation
(w = 0.1), or a balanced approach (w = 0.5).
Finally, Figure 6 presents the distribution of ser-
vices across the infrastructure layers for each exam-
ined mechanism. The Energy Efficiency policy opted
for the near-edge layer, exploiting the inherent lower-
power and lower-frequency devices to minimize en-
ergy consumption. Our mechanism, configured with
w = 0.1, also predominately utilized the near-edge,
but still deployed some critical services on the upper
tiers to enhance performance. The Performance pol-
Figure 6: Service distribution across the infrastructure’s
layers.
icy favors the high-end systems of the far-edge and
the cloud-layer to reduce execution time. Our mech-
anism, when tuned with w = 0.9, utilized more of the
cloud layer compared to Performance. However, it
also employed part of the near-edge to enhance en-
ergy efficiency on non-critical parts of the application.
7 CONCLUSION
This work introduced a DVFS-enabled, critical-path-
aware mechanism for deploying microservice-based
applications over the edge-cloud continuum. We
modeled the problem as a MILP, targeting to optimize
a weighted combination of the application’s execution
time and the total energy consumption. A novel two-
phased heuristic approach was developed to tackle the
problem’s inherent complexity, comprising a genetic
algorithm for the configuration problem, followed
by a best-fit heuristic for the resource-allocation and
placement problem. Our experiments highlighted the
efficiency of our proposed method: By properly fine-
tuning the weight coefficient, our mechanism can in-
telligently configure and deploy applications, leverag-
Optimization of Cloud-Native Application Execution over the Edge-Cloud Continuum Enabled by DVFS
47

ing the heterogeneous devices across the infrastruc-
ture to meet performance and energy objectives. As
a future direction, we plan to incorporate the delays
between infrastructure nodes into the problem formu-
lation, as well as to develop real-world testbeds for
the evaluation.
ACKNOWLEDGEMENTS
This work was supported in part by European Union’s
Horizon Europe Research and Innovation Programme
under Grant Agreement 101136024 through Project
EMPYREAN, and in part by European Union’s Key
Digital Technologies Joint Undertaking (KDTJU) un-
der Grant Agreement 101097560 through CLEVER
project.
REFERENCES
Atieh, A. T. (2021). The next generation cloud technolo-
gies: A review on distributed cloud, fog and edge
computing and their opportunities and challenges.
Pages 1–15.
Auer, F., Lenarduzzi, V., Felderer, M., and Taibi, D. (2021).
From monolithic systems to microservices: An as-
sessment framework. Information and Software Tech-
nology, 137:106600.
Chen, S., Delimitrou, C., and Mart
´
ınez, J. F. (2019). Parties:
Qos-aware resource partitioning for multiple interac-
tive services. In Proceedings of the Twenty-Fourth
International Conference on Architectural Support
for Programming Languages and Operating Systems,
ASPLOS ’19, pages 107–120, New York, NY, USA.
ACM.
Convolbo, M. W. and Chou, J. (2016). Cost-aware dag
scheduling algorithms for minimizing execution cost
on cloud resources. The Journal of Supercomputing,
72(3):985–1012.
Dally, W. J., Turakhia, Y., and Han, S. (2020). Domain-
specific hardware accelerators. Communications of
the ACM, 63(7):48–57.
Dzhagaryan, A. and Milenkovi
´
c, A. (2014). Impact of
thread and frequency scaling on performance and en-
ergy in modern multicores. In Proceedings of the 52nd
ACM Southeast Conference (ACM SE ’14), pages Ar-
ticle 30, 6 pages, New York, NY, USA. ACM.
Einav, Y. (2023). Amazon found every 100ms of latency
cost them 1. Accessed: 2024-11-05.
Garcia, A. M., Serpa, M., Griebler, D., Schepke, C., ao,
L. L., and Navaux, P. O. A. (2020). The impact
of CPU frequency scaling on power consumption of
computing infrastructures. In High Performance Com-
puting. SBAC-PAD 2019 International Workshops,
volume 12083 of Lecture Notes in Computer Science,
pages 142–157, Cham, Switzerland. Springer.
Gluck, A. (2020). Introducing domain-oriented microser-
vice architecture. Accessed: 2024-11-05.
Gupta, R. and et al. (2021). 6g-enabled edge intelli-
gence for ultra-reliable low latency applications: Vi-
sion and mission. Computer Standards & Interfaces,
77:103521.
Hua, W., Liu, P., and Huang, L. (2023). Energy-efficient re-
source allocation for heterogeneous edge-cloud com-
puting. IEEE Internet of Things Journal, pages 1–1.
Li, Z. and Zhu, Q. (2020). Genetic algorithm-based op-
timization of offloading and resource allocation in
mobile-edge computing. Information, 11(2):83.
Luo, S. and et al. (2022). An in-depth study of mi-
croservice call graph and runtime performance. IEEE
Transactions on Parallel and Distributed Systems,
33(12):3901–3914.
Mauro, T. (2015). Adopting microservices at netflix:
Lessons for architectural design.
NVIDIA (2024). Power management guide for jetson
xavier. https://docs.nvidia.com/jetson/. Accessed:
2024-11-17.
Papadimitriou, G., Chatzidimitriou, A., and Gizopoulos,
D. (2019). Adaptive voltage/frequency scaling and
core allocation for balanced energy and performance
on multicore cpus. In Proceedings of the 2019 IEEE
International Symposium on High Performance Com-
puter Architecture (HPCA), pages 133–144, Washing-
ton, DC, USA. IEEE.
Qiu, H., Banerjee, S. S., Jha, S., Kalbarczyk, Z., and Iyer,
R. K. (2020). Firm: An intelligent fine-grained re-
source management framework for slo-oriented mi-
croservices.
Somashekar, G. and et al. (2022). Reducing the tail latency
of microservices applications via optimal configura-
tion tuning.
Song, C. and et al. (2023). Chainsformer: A chain latency-
aware resource provisioning approach for microser-
vices cluster. arXiv preprint arXiv:2309.12592.
Syed, A. (2021). Intel 11th gen rocket lake-s cpu power con-
sumption explained. https://hardwaretimes.com. Ac-
cessed: 2024-11-17.
Wikipedia contributors (2021). List of intel pro-
cessors. https://en.wikipedia.org/wiki/List of Intel
processors. Accessed: 2024-11-17.
Zhang, Z., Ramanathan, M. K., Raj, P., Parwal, A., Sher-
wood, T., and Chabbi, M. (2022). Crisp: Criti-
cal path analysis of large-scale microservice architec-
tures. In 2022 USENIX Annual Technical Conference
(USENIX ATC 2022), pages 655–672, Carlsbad, CA,
USA. USENIX Association.
Zidar, J., Mati
´
c, T., Aleksi
´
c, I., and
ˇ
Z. Hocenski (2024).
Dynamic voltage and frequency scaling as a method
for reducing energy consumption in ultra-low-power
embedded systems. Electronics, 13(5):826.
CLOSER 2025 - 15th International Conference on Cloud Computing and Services Science
48
