
Selection of Retransmitter Nodes for Alert Message Transmission in
VANETs Using a Multicriteria Decision-Making Approach Based on
Vehicle Credibility
Santiago Cardoso
1 a
and Adriano Fiorese
2 b
1
Departamento de Ci
ˆ
encia da Computac¸
˜
ao, Universidade do Estado de Santa Catarina, Joinville, Brazil
2
Programa de P
´
os-Graduac¸
˜
ao em Computac¸
˜
ao Aplicada,
Departamento de Ci
ˆ
encia da Computac¸
˜
ao, Universidade do Estado de Santa Catarina, Joinville, Brazil
fi
Keywords:
VANETs, Retransmitter, Multicriteria.
Abstract:
Adverse situations that occur on public traffic roads, such as traffic accidents, severe traffic jams, among
others, are considered critical traffic events. Such events occur relatively frequently and need to be dealt with
quickly by public authorities to maintain the proper functioning of cities and highways. The main challenges
for efficient handling lie in the random nature of the event and the speed and accuracy of its notification to the
authorities. Thus, the large number of vehicles on the roads, together with their communication and monitoring
capabilities, allow the detection and alert of such events occurrences. However, transmitting such detections
to the destinations can be difficult due to the not entirely reliable nature of those involved, especially when
there is a need for retransmission of the alert message between the detecting vehicle and the destination. In
this sense, choosing the most suitable etransmitter vehicle, among the possible ones, becomes an issue. In this
sense, this work proposes the development and use of a Vehicle Credibility Factor (VCF) in Ad Hoc Vehicular
Networks (VANETs), generated by means of the use of several criteria that represent traffic behavior, as input
parameters for the AHP multicriteria decision-making method. The result of the method is the VCF, which is
used to determine, by ranking, the most reliable vehicles to transmit sensitive information for alerting critical
traffic events.
1 INTRODUCTION
Mobility, especially in large cities and highways, has
become increasingly difficult due to the high number
of vehicles on the roads (Damjanovi
´
c et al., 2022).
As a result, various traffic accidents, congestion, con-
struction, and other events occur daily, leading to road
closures or potential risks to the lives of drivers and
pedestrians. Therefore, these events need to be com-
municated quickly and securely to the authorities in-
volved in traffic management and other road users so
that well-informed decisions can be made to handle
these events. Thus, technological solutions are nec-
essary to detect and communicate these events. One
such solution is the spontaneous formation of commu-
nication networks among vehicles traveling on these
roads. These networks are known as Vehicular Ad
Hoc Networks (VANETs).
a
https://orcid.org/0009-0000-1721-2366
b
https://orcid.org/0000-0003-1140-0002
VANETs represent mobile networks where com-
munications facilitate the exchange of information be-
tween vehicles and road infrastructures, proving to
be a promising solution for monitoring and alerting
about critical traffic events that influence users’ routes
and travel times. To this end, the use of vehicle
clustering (Andrade et al., 2020), V2V (vehicle-to-
vehicle) and V2I (vehicle-to-infrastructure) commu-
nication strategies are identified as effective solutions
(Tomar et al., 2010).
Given the structure and large number of vehi-
cles in a VANET, information must be transmitted
smoothly and efficiently. Therefore, it is necessary to
find a way for participating vehicles to act as transmit-
ters and retransmitters to disseminate all stored data
and events that occur. However, retransmission is not
always necessary, such as in cases where the vehicle
detecting the event can send the message directly to
the final destination. In situations where direct com-
munication is not feasible, the message must be re-
transmitted by another vehicle.
Cardoso, S. and Fiorese, A.
Selection of Retransmitter Nodes for Alert Message Transmission in VANETs Using a Multicriteria Decision-Making Approach Based on Vehicle Credibility.
DOI: 10.5220/0013292000003929
In Proceedings of the 27th International Conference on Enterprise Information Systems (ICEIS 2025) - Volume 1, pages 789-796
ISBN: 978-989-758-749-8; ISSN: 2184-4992
Copyright © 2025 by Paper published under CC license (CC BY-NC-ND 4.0)
789

Therefore, the credibility of the vehicles involved
can determine whether the message about a critical
event reaches its destination. In other words, select-
ing credible vehicles to retransmit the message can
be crucial for the message to be retransmitted. Thus,
the assessment of credibility, through a calculation
that considers various factors, for each vehicle within
these networks must be accurately computed to find
the most suitable vehicle in the information transmis-
sion chain for the communication of these events.
In this way, this work proposes a method for se-
lecting retransmitter vehicles for alert messages re-
garding critical traffic events in VANETs based on
the credibility of the involved vehicles. To accom-
plish this, it introduces the implementation and calcu-
lation of a new Vehicle Credibility Factor (VCF) in a
VANET. This work incorporates new criteria for mod-
eling credibility and utilizes the Analytical Hierarchy
Process (AHP) method for decision-making.
In this context, this work seeks to answer the re-
search question regarding how the VCF influences the
selection of retransmitter vehicles in simulations of
VANETs and what impacts are observed on the effi-
ciency of communication and the network. Therefore,
the main objective of this work is to develop and val-
idate a method that uses the VCF, calculated using
various criteria, to select the most efficient vehicles
for disseminating crucial information within vehicu-
lar networks.
Thus, the remainder of this work is structured as
follows. Section 2 discusses related works. Section 3
describes the proposed vehicle credibility factor based
on credibility criteria, and its use along with the AHP
method to compute a score for each vehicle involved
in the retransmission of the alert message. Section 4
presents the scenario where the proposal was simu-
lated in a VANET considering real mobility data from
the city of Luxembourg. Finally, Section 5 concludes
the work and presents suggestions for future improve-
ments.
2 RELATED WORK
This section discusses some related works on the topic
of efficient and reliable vehicle selection in a VANET.
The work (Tomar et al., 2010) addresses the dis-
semination of information in VANETs. It proposes
the use of information collection units along the roads
and the formation of vehicle clusters, as this approach
achieves low latency in information transmission with
grouped vehicles and also expands the connectivity
of the VANET. However, a limitation of this work is
the dependency on the information collection units,
which may lead to single points of failure and network
overload. The proposed approach aims to address this
by using a more distributed and resilient system for
data collection and dissemination.
The work (Andrade et al., 2020) discusses MIN-
UET, a system for detecting and disseminating urban
events in VANETs. MINUET enables monitoring and
distribution of these events through the creation of co-
operative vehicle clusters that communicate with each
other. With the simulation results presented, it was
demonstrated that MINUET ensures greater informa-
tion availability and is capable of sending more mon-
itoring data packets. However, the system may face
scalability issues and network congestion in scenar-
ios with high vehicle density. The approach adopted
in this work, although primarily focused on the ef-
ficient selection of retransmitter vehicles, may indi-
rectly improve communication efficiency by reduc-
ing the number of retransmitters needed to transmit
an alert message, potentially enhancing communica-
tion in denser scenarios regarding network congestion
issues.
The work (Yury et al., 2020) presents SOCIA-
BLE, a system for disseminating critical urban events
in a Social Internet of Vehicles environment. Using
vehicle communications based on social criteria, in-
formation about critical events is distributed to exter-
nal entities. The article compared the performance
of SOCIABLE with MINUET (Andrade et al., 2020).
Thus, SOCIABLE has shown to transmit fewer pack-
ets and achieve significantly lower delays compared
to other event dissemination systems. However, a dis-
advantage of SOCIABLE is that it may not guaran-
tee complete coverage of the area in certain scenar-
ios, due to its reliance on social criteria, which are
not always uniformly distributed. The proposal of this
work addresses this issue by introducing new criteria,
such as behavioral factors (related to vehicle credibil-
ity), which seek a more consistent and comprehensive
alert message dissemination, potentially resulting in
greater efficiency, even in scenarios of high mobility
and density.
Thus, the approach proposed in this work seeks to
provide an alternative that can solve some of the prob-
lems observed in related works. While the focus is on
selecting retransmitter vehicles, the proposal aims to
contribute to a system that attempts to be more effi-
cient in the selection and communication of vehicles
in a VANET. To achieve this, the selection of retrans-
mitter vehicles is based on a combination of criteria
such as distance and speed, among other behavioral
and technical factors.
ICEIS 2025 - 27th International Conference on Enterprise Information Systems
790

3 MODELING THE VCF
For the development of the retransmitter vehicle se-
lection method in VANETs, this work assumes that
vehicles are equipped with elements (e.g., cameras,
sensors, etc.) that, in an integrated and automatic
manner, detect such events and inform them through
messages sent via the VANET.
When a vehicle detects a critical traffic event and
is outside the transmission range of a roadside unit
(RSU), it must send the message to a specific vehi-
cle designated to retransmit it. This retransmission
process continues from one vehicle to another until
the message reaches its final destination. Therefore,
in these cases, for the delivery of critical event mes-
sages, it is necessary to define a retransmitter vehi-
cle(s), i.e., vehicle(s) that act as intermediate transmit-
ter(s) of the messages if the transmission range of the
event-detecting vehicle does not reach the base sta-
tion or the vehicle that is intended to be reached. The
better this retransmitter is chosen, the better the trans-
mission performance of the message will be. Hence,
the VCF aims to model the selection of this vehicle as
accurately as possible based on all credibility circum-
stances present during its transit.
The VCF is introduced in this work, establishing
several criteria for modeling and consequently calcu-
lating the VCF.
The Equation 1 defines the term average speed
(AS) of the VCF. It is obtained by means of the
weighted average of the speed value at which the cur-
rent vehicle traveled on highways and urban roads.
S
h
=
1.00 if 60 ≤ A
h
< 110
0.25 if 110 ≤ A
h
< 150
0.00 otherwise
S
r
=
1.00 if 15 ≤ A
r
< 40
0.75 if 40 ≤ A
r
< 60
0.25 if 60 ≤ A
r
< 80
0.00 otherwise
AS =
S
h
∗ n + S
r
∗ m
n + m
(1)
In Equation 1, the weighted average value of the
average speeds of the vehicle in km/h is defined by
the average speed on highways S
h
and on urban roads
S
r
, to which a value between 0 and 1 is assigned based
on the speed at which the current vehicle traveled on
highways Ah and on urban roads A
r
. n and m refer
to the monitored hours while the vehicle traveled on
highways and urban roads, respectively.
Equation 2 represents the peak hour traffic term
(PH) that results from the amount of hours traveled
during a defined time interval in the simulation.
PH =
1 −
h
d
t
t
∗ w
d
+
1 −
h
n
t
t
∗ w
n
(2)
In Equation 2, the calculation of PH is given by
the time traveled during peak daytime hours h
d
and
nighttime hours h
n
in relation to the total time traveled
t
t
over a month, weighted by w
d
(day) and w
n
(night).
During the simulation conducted in this article, the
weight values were selected as w
d
= 0.25 and w
n
=
0.75, so the less time traveled during peak nighttime
hours, the better the final value of the criterion PH
will be.
Equation 3 defines the term (DT ) representing the
total driving time of the driver, where t
t
is the variable
that stores the total driving time of the driver in hours
over a month.
DT =
1.00 if t
t
≤ 30
0.75 if 30 < t
t
≤ 60
0.50 if 60 < t
t
≤ 150
0.25 if t
t
> 150
(3)
Equation 4 defines the term (KM) for the total dis-
tance driven by the driver, where km is the variable
that stores the total distance driven by the driver over
a month.
KM =
1.00 if km ≤ 1000
0.75 if 1000 < km ≤ 2000
0.50 if 2000 < km ≤ 3000
0.25 if km > 3000
(4)
Equation 5 defines the term (LD) for the total li-
censed time of the driver, where ld is the variable that
stores the total time the driver has been licensed in
years.
LD =
1.00 if ld > 10
0.75 if 5 < ld ≤ 10
0.50 if 2 < ld ≤ 5
0.25 if 1 < ld ≤ 2
0.00 if ld ≤ 1
(5)
Equation 6 defines the term (F), reflecting the
driver’s behavior in terms of traffic violations com-
mitted.
F =
"
1 −
p
p
max
m
m
max
#
∗
1 −
m
m
lm
max
(6)
In Equation 6, F is the final value assigned to the
criterion, p represents the score of the fines attributed
to the vehicle, p
max
represents the maximum score
of fines within the monitored group of vehicles, m is
the number of fines of the analyzed vehicle, m
max
is
Selection of Retransmitter Nodes for Alert Message Transmission in VANETs Using a Multicriteria Decision-Making Approach Based on
Vehicle Credibility
791

the maximum number of fines of a vehicle analyzed
within the group of vehicles, m
m
is the number of
months the analyzed vehicle was fined over a year,
and lm
max
is the maximum period that the current leg-
islation stores the fines of a given vehicle.
Equation 7 represents the term (YV ) related to the
year of manufacture of the vehicle. Thus, the age
of the vehicle a
v
is calculated by the difference be-
tween the year of manufacture a
m
and the current year
a
a
. Finally, the final value of the criterion is assigned
based on the current age of the vehicle.
a
v
= a
m
− a
a
YV =
1.00 if a
v
≤ 10
0.75 if 10 < a
v
≤ 20
0.50 if 20 < a
v
≤ 40
0.25 if a
v
> 40
(7)
Table 1 represents a parameterized value between
0 and 1 within the FCV, which takes into account the
vehicle’s power and the driver’s age group for light
vehicles. The first column represents the vehicle’s
power ranges, and the remaining columns represent
the age groups. Thus, this value is used as a safety
measure, where vehicles with lower power are con-
sidered safer to drive and receive high scores for most
ages, while higher power vehicles receive higher val-
ues for more experienced drivers.
Table 2 is also parameterized between 0 and 1, but
it does not take into account power and only considers
age groups to drive heavy vehicles.
The criterion (CS), represented by Equation 8,
evaluates the average speed of the vehicles’ cluster for
the VCF. It is obtained through V2V communication
and Intelligent Infrastructure if available.
CS =
1, if A
v
= A
c
or(A
v
≥ A
c
and A
v
< A
c
∗ 2)
0,5, if A
v
≥
A
c
2
and A
v
< A
c
0, otherwise
(8)
In Equation 8, the value CS is assigned by com-
paring the average speed of the cluster with that of
the current vehicle. Thus, A
c
is the average speed of
the vehicle cluster and A
v
is the average speed of the
current vehicle.
Equation 9 defines the tire quality term (T Q
i
). It
results from an external factor that refers to the cur-
rent level of wear on each tire.
T Q
i
=
1, if P ≥ 1.6 and P ≤ 3.0,
0.75, if P > 3.0 and P ≤ 4.0,
0, if P < 1.6 or P > 4.0.
(9)
In Equation 9, the value T Q
i
depends on the tread
depth P, which represents the wear of a tire. A rel-
ative weight is assigned to the criterion based on the
variation in tread depth.
To evaluate the quality of the tires of the vehicle
as a whole, which may vary in the number of tires
depending on the type of vehicle (such as motorcy-
cles, cars, or trucks), it is established in Equation 10
that the final T Q of the vehicle will be defined as the
lowest TQ
i
value among all the tires.
T Q = min(T Q
1
,T Q
2
,.. . ,T Q
n
) (10)
Thus, the final T Q used for calculating the VCF
utilizes an assessment of the overall quality of a vehi-
cle’s set of tires based on the tire in the worst condi-
tion.
Equation 11 defines the fuel efficiency term (FE)
of the VCF.
FE =
1, if efficiency is A,
0.8, if efficiency is B,
0.7, if efficiency is C,
0.4, if efficiency is D,
0.2, if efficiency is E.
(11)
In Equation 11, the value FE is defined based on
the category of the vehicle’s energy efficiency label,
which includes values A, B, C, D, and E. These val-
ues are extracted from the table of the Brazilian Ve-
hicle Labeling Program (PBEV) (INMETRO, 2024),
where the energy efficiencies of many vehicles sold
in Brazil are stored and compared. Generally, vehi-
cles that fall into category A are equipped with more
advanced technologies, including being more fuel-
efficient, which allows them to function more effec-
tively as retransmitters, as they can theoretically travel
on roads longer without needing to stop for refueling.
As a result, they receive higher scores in this criterion.
The term D of the VCF, representing the distance
from the vehicle to the base station, is extracted from
the simulation.
The criterion for the number of nearby neighbors
of the vehicle, N, is extracted from the current node
during the simulation. This indicates whether the ve-
hicle is in an area with more neighbors around it,
which increases the likelihood that the monitoring
message will be transmitted and reach the base sta-
tion.
Given the complexity of VANETs and the diver-
sity of factors influencing their operations, the selec-
tion of the ideal retransmitter vehicle involves ana-
lyzing multiple criteria. To address this multiplicity
of factors, the use of multi-criteria decision-making
methods, such as the AHP, is justified.
ICEIS 2025 - 27th International Conference on Enterprise Information Systems
792

Table 1: Relationship between driver age and vehicle power for light vehicles.
Age Groups
Power (hp)
60-100 110-120 130-140 150 160-170 180 190 200 225 250-300
18-29 1 0.75 0.75 0.75 0.5 0.5 0.25 0.25 0 0
30-39 1 1 1 1 1 0.75 0.75 0.75 0.75 0.5
40-49 1 1 1 1 1 1 1 1 1 0.75
50-59 1 1 1 1 1 1 1 0.75 0.75 0.75
60-69 0.75 0.75 0.75 0.75 0.5 0.5 0.5 0.5 0.25 0.25
70-79 0.75 0.75 0.5 0.5 0.5 0.5 0.5 0.25 0 0
80+ 0.25 0.25 0.25 0.25 0 0 0 0 0 0
Table 2: Driver age and corresponding scores for heavy ve-
hicles.
Age Score Age Score
18-29 0.75 65-66 0.5
30-49 1 67-69 0.25
50-59 1 70+ 0
60-64 0.75
The AHP is a widely used tool for multi-criteria
decision-making, highly effective for solving prob-
lems involving different criteria and alternatives (dif-
ferent solutions to the problem). AHP decomposes
and divides the problem into various factors that fa-
cilitate the establishment of relationships to synthe-
size the problem (Taherdoost, 2017), making it easier
to compare and prioritize the elements.
Thus, all these criteria have their respective
weights assigned using the judgment matrix estab-
lished through the AHP, where criteria are compared
pairwise using a scale from 1 to 9, as proposed by
Saaty (1991), as implemented and shown in Table 3.
The values from the paired analysis of the criteria,
as presented in Table 3, are empirical and take into
account the consistency and evaluation of importance
among the criteria. The paired analysis results in the
weights of each criterion used by the AHP method
for scoring each alternative solution being evaluated
(in this case, vehicles), allowing for an optimized and
well-founded choice.
Each vehicle within the VANET has the crite-
ria previously mentioned. However, not all vehi-
cles in the VANET will be associated (near or within
range) with the occurrence of a critical event. There-
fore, clustering vehicles is a reasonable approach
to optimizing the selection of vehicles that will re-
transmit the critical event alert message, as clus-
tering techniques can allow efficient communication
(Mukhtaruzzaman and Atiquzzaman, 2020) in an or-
ganized way, which helps in spreading information
throughout the network, enhancing traffic flow, and
improving road safety (Zhang et al., 2023). Through
clustering, vehicles can swiftly share information
within groups about traffic updates, road hazards, or
accident alerts, enabling drivers to make quick deci-
sions to avoid traffic jams and collisions.
Thus, the retransmitter is chosen from those that
can effectively receive the message and retransmit it
in the appropriate direction toward the intended des-
tination. In this regard, by using the SOCIABLE
module for the clustering method, vehicles are also
grouped based on social criteria (Yury et al., 2020).
Among these social criteria, SOCIABLE considers
common interests between vehicles, meaning those
that have similar destinations, relative speeds close to
other vehicles, similar trajectories, and other aspects.
4 EXPERIMENT AND RESULT
The evaluation of the retransmitter vehicle selection
method for alerts regarding critical traffic events,
based on the vehicle credibility factor, was conducted
through simulation.
To implement the VCF as well as the proposed
retransmitter vehicle selection method, the C++ pro-
gramming language was used.
In the simulation, a scenario was designed us-
ing the NS3 network simulator, an open-source tool
widely used in research on ad hoc networks. NS3 al-
lowed for a detailed simulation of the designed sce-
nario, providing a realistic environment for the study.
Additionally, other fundamental systems were in-
tegrated into the simulation. Monitoring and Dissem-
ination of Urban Events (MINUET) system was used,
which is capable of detecting and efficiently monitor-
ing urban events (Andrade et al., 2020). Furthermore,
SOCIABLE system was also employed, which is a
critical urban event data dissemination system used
for vehicle clustering during the simulations (Yury
et al., 2020).
The Simulation of Urban MObility (SUMO) (Kra-
jzewicz et al., 2012) and data from the Luxembourg
SUMO Traffic (LuST) (Codec
´
a et al., 2017) were also
utilized, modeling urban mobility in the city of Lux-
embourg and providing a detailed scenario for analy-
sis. In this context, a small route in the city of Luxem-
Selection of Retransmitter Nodes for Alert Message Transmission in VANETs Using a Multicriteria Decision-Making Approach Based on
Vehicle Credibility
793
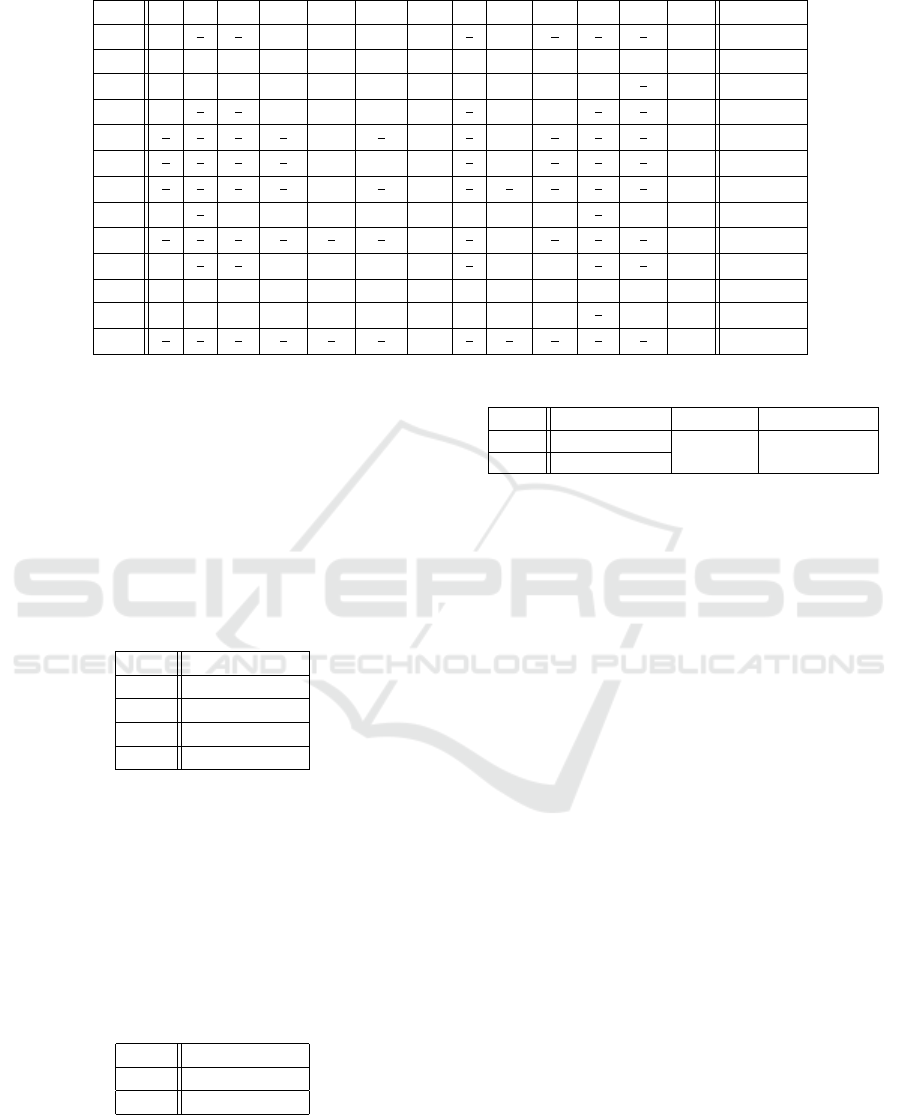
Table 3: AHP Judgment Matrix.
# N D AS PH DT KM LD F YV AP CS T Q FE Weights
N 1
1
7
1
5
1 5 5 3
1
3
3
1
3
1
5
1
3
5 0.046
D 7 1 1 5 9 9 9 2 9 5 1 1 9 0.161
AS 5 1 1 3 5 5 7 1 7 3 1
1
3
7 0.120
PH 1
1
5
1
5
1 2 3 5
1
3
3 1
1
5
1
5
7 0.113
DT
1
5
1
9
1
5
1
2
1
1
3
1
1
5
3
1
3
1
3
1
3
5 0.044
KM
1
5
1
9
1
5
1
3
3 1 3
1
5
3
1
3
1
5
1
3
3 0.027
LD
1
3
1
9
1
7
1
5
1
1
3
1
1
3
1
3
1
5
1
9
1
7
1 0.029
F 3
1
2
1 3 5 5 3 1 7 3
1
3
1 5 0.014
YV
1
3
1
9
1
7
1
3
1
3
1
3
3
1
7
1
1
3
1
9
1
3
3 0.091
AP 3
1
5
1
3
1 3 3 5
1
3
3 1
1
3
1
5
5 0.019
CS 5 1 1 5 3 5 9 3 9 3 1 3 9 0.051
T Q 3 1 3 5 3 3 7 1 3 5
1
3
1 7 0.156
FE
1
5
1
9
1
7
1
7
1
5
1
3
1
1
5
1
3
1
5
1
9
1
7
1 0.117
bourg was selected, along with 10 vehicles to perform
the simulation along this route.
The necessary files for the simulation, such as
TraceConfig, TraceMobility, and TraceActivity, were
extracted from the geographic coordinates specified
in Table 4, providing the foundation for the configu-
ration and execution of the simulated scenario. The
data X, Y , X
min
, and Y
min
represent the longitude and
latitude limits of the geographic area coordinates for
the scenario.
Table 4: Coordinates of the Simulation Scenario.
Axis Coordinates
X 6069.44
Y 4379.33
X
min
5568.87
Y
min
3467.69
Thus, 10 nodes (vehicles) were defined with a start
time of 0.0 seconds and an end time of 700.0 seconds,
totaling 11.6 minutes of simulation. The basestation
(RSU in the simulation) was positioned at the X,Y co-
ordinates of the LuST map representing the simulated
scenario, as shown in Table 5, enabling the observa-
tion of the proximity criterion with the basestation. A
fixed critical traffic event was positioned at the X,Y
coordinates with the duration specified in Table 6.
Table 5: Coordinates of the Basestation.
Axis Coordinates
X 6020.30
Y 4390.08
Table 7, derived from the simulation of the
VANET network operation in NS3, presents the nor-
malized criterion values for the 10 vehicles involved
in the simulation, as well as the values for each vehi-
Table 6: Event Settings.
Axis Coordinates Start (s) Duration (s)
X 5947.46
90 600
Y 3948.65
cle’s criteria. Thus, it is possible to observe vehicles/-
drivers that score lower on some criteria, while oth-
ers comply more with traffic laws, are closer to ideal
conditions. This allows for a visualization of the ap-
plicability of the VCF for each vehicle and compari-
son among the vehicles, assisting in the more accurate
selection of the next retransmitter vehicle.
According to Table 7, it is possible to visualize
how, in the simulated scenario, the values of the cri-
teria directly affect the final value of the VCF. Thus,
each of these factors significantly affects the choice
of the new retransmitter, as it can be observed that
vehicles with the lowest final VCF results are those
that have the largest number of criteria with lower
values. In the simulated scenario, vehicle number 0
would be the current retransmitter in simulation, as it
has a higher VCF than the other vehicles.
During simulation, the number of times each ve-
hicle retransmitted critical event alert messages was
also collected, as shown in Figure 1. This figure dis-
plays the volume of messages retransmitted by vehi-
cles in the simulated scenario. The analysis of the data
allows us to observe that different vehicles had differ-
ent numbers of retransmissions, indicating variations
in their roles as retransmitters. Ultimately, these val-
ues help in understanding the dynamics of message
retransmission during the simulated time period, as
well as the evolution conditions (e.g., speed and dis-
tance) of the cluster of vehicles involved in retrans-
mitting these messages.
In the conducted simulation, vehicle 6 retransmit-
ted the most alert messages, as it was selected as the
ICEIS 2025 - 27th International Conference on Enterprise Information Systems
794
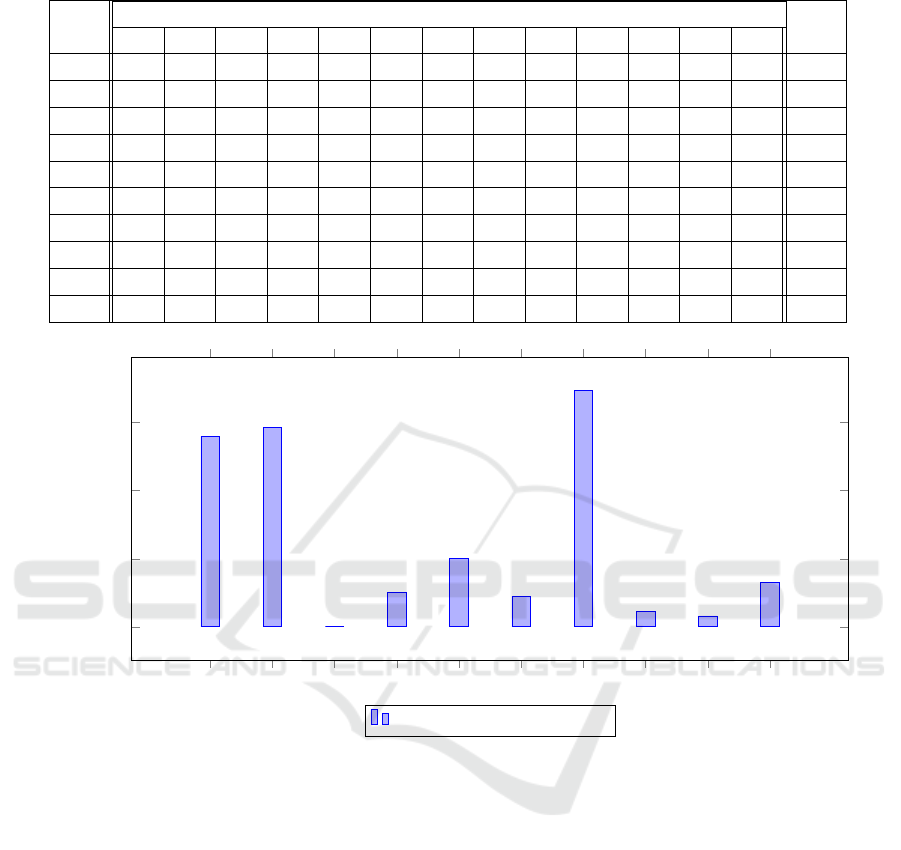
Table 7: Example of VCF Calculation.
Vehi- Criteria
VCF
cles N D AS PH DT KM LD F YV AP CS TQ FE
V0 0.04 0.06 1.00 0.88 1.00 0.75 0.50 1.00 1.00 0.75 1.00 1.00 1.00 0.742
V1 0.05 0.06 0.00 0.84 0.75 0.75 0.25 1.00 1.00 1.00 1.00 1.00 0.80 0.614
V2 0.07 0.06 1.00 0.88 1.00 0.75 0.50 1.00 1.00 0.75 0.00 1.00 1.00 0.566
V3 0.05 0.06 1.00 0.80 0.75 0.50 0.75 0.91 1.00 1.00 1.00 0.75 0.20 0.687
V4 0.03 0.06 0.00 0.61 1.00 1.00 1.00 0.91 1.00 1.00 1.00 1.00 0.40 0.615
V5 0.06 0.06 0.00 0.69 0.75 0.75 0.75 0.89 1.00 1.00 1.00 1.00 0.80 0.603
V6 0.05 0.06 0.00 0.71 0.75 0.75 1.00 0.91 1.00 1.00 1.00 1.00 0.70 0.609
V7 0.03 0.06 0.00 0.80 1.00 0.75 1.00 0.82 1.00 0.75 1.00 1.00 0.20 0.590
V8 0.08 0.06 0.00 0.70 0.50 0.50 1.00 0.82 1.00 1.00 1.00 0.75 1.00 0.555
V9 0.05 0.06 1.00 0.87 1.00 1.00 0.25 1.00 1.00 0.75 1.00 0.75 0.70 0.708
Node 0 Node 1 Node 2 Node 3 Node 4 Node 5 Node 6 Node 7 Node 8 Node 9
0
100
200
300
280
293
0
51
100
45
347
23
16
65
Total Messages
Retransmitted in the clusters
Figure 1: Message Monitoring.
retransmitter more frequently than the others. This
was due to its good overall criteria values. On the
other hand, vehicle 2 did not retransmit any messages,
as it did not achieve favorable VCF values to be se-
lected as a retransmitter. Thus, this demonstrates the
influence of vehicle credibility factors on the calcula-
tion of the VCF and their impacts on the choice of the
retransmitting vehicle.
5 FINAL CONSIDERATIONS
This work presented an approach for selecting ve-
hicles to retransmit alert messages regarding critical
traffic events. This approach assumes that once a ve-
hicle detects a critical traffic event, it must dissemi-
nate an alert message both to other vehicles and to the
traffic management infrastructure (such as base sta-
tions in the context of an Internet of Vehicles service).
Furthermore, it also assumes that this message may
need to be retransmitted by another vehicle if direct
delivery to the final destination is not possible.
In this context, the proposed approach selects the
retransmitting vehicle based on the concept of vehicu-
lar credibility, according to a modeling involving var-
ious criteria that represent the behavior of the vehi-
cle/driver in urban and road traffic on a daily basis.
To achieve this, a vehicular credibility factor
(VCF) is proposed that takes into account various cri-
teria that model such credibility in traffic, using the
AHP. The criterion values are utilized by the AHP
method to generate the VCF, which acts as a score for
the involved vehicles, organized into vehicle clusters
during their journey on the transit routes. Thus, the
vehicle with the best score in the group (highest VCF)
is chosen as the retransmitter, repeating the procedure
until the alert message reaches its final destination.
Selection of Retransmitter Nodes for Alert Message Transmission in VANETs Using a Multicriteria Decision-Making Approach Based on
Vehicle Credibility
795

Simulations with real vehicle data organized in
a VANET, using the proposed approach for select-
ing retransmitting vehicles, were conducted. During
the evaluation of the VANET scenario simulation, the
impact of the proposed criteria on the behavior of
each vehicle and the choice of the final retransmitter
was clearly observed. The detailed analysis revealed
how each criterion directly influences the decision re-
garding which vehicle should act as the retransmitter,
highlighting the effectiveness of the VCF in ensuring
the most suitable and efficient choice. Through the
simulation, it became evident that the collection of
criteria allows for a precise selection of the retrans-
mitter, ensuring that the retransmission of critical in-
formation is carried out efficiently. Furthermore, the
VCF proved to be a decisive factor in improving com-
munication between vehicles, contributing to a more
cohesive and responsive network. The VCF’s ability
to consider multiple relevant aspects and its practical
application in the simulation reinforce its importance
as an effective tool in managing vehicle networks,
demonstrating that its use can potentially enhance the
safety and efficiency of communication in complex
urban mobility scenarios.
As a continuation of this work, the performance
of the VCF can be tested in its entirety, comparing
it with other forms of retransmitter selection. There
is also the intention to incorporate additional criteria
that address other factors related to vehicular credibil-
ity.
ACKNOWLEDGMENTS
This work received financial support from the Coordi-
nation for the Improvement of Higher Education Per-
sonnel (CAPES), Brazil (PROAP/AUXPE).
REFERENCES
Andrade, E., Veloso, K., Vasconcelos, N., Santos, A., and
Matos, F. (2020). Cooperative monitoring and dissem-
ination of urban events supported by dynamic clus-
tering of vehicles. Pervasive and Mobile Computing,
67:101244.
Codec
´
a, L., Frank, R., Faye, S., and Engel, T. (2017). Lux-
embourg sumo traffic (lust) scenario: Traffic demand
evaluation. IEEE Intelligent Transportation Systems
Magazine, 9(2):52–63.
Damjanovi
´
c, M., Stevi
´
c,
ˇ
Z., Stanimirovi
´
c, D., Tanackov,
I., and Marinkovi
´
c, D. (2022). Impact of the num-
ber of vehicles on traffic safety: multiphase modeling.
Facta Universitatis, Series: Mechanical Engineering,
20(1):177–197.
INMETRO (2024). Ve
´
ıculos Automotivos (PBE
veicular). https://www.gov.br/inmetro/pt-
br/assuntos/avaliacao-da-conformidade/programa-
brasileiro-de-etiquetagem/tabelas-de-eficiencia-
energetica/veiculos-automotivos-pbe-veicular. ac-
cessed 2024-04-02.
Krajzewicz, D., Erdmann, J., Behrisch, M., and Bieker,
L. (2012). Recent development and applications of
sumo-simulation of urban mobility. International
journal on advances in systems and measurements,
5(3&4).
Mukhtaruzzaman, M. and Atiquzzaman, M. (2020). Clus-
tering in vehicular ad hoc network: Algorithms and
challenges. Computers & Electrical Engineering,
88:106851.
Taherdoost, H. (2017). Decision making using the analytic
hierarchy process (ahp); a step by step approach. In-
ternational Journal of Economics and Management
Systems, 2.
Tomar, P., Chaurasia, B. K., and Tomar, G. (2010). State of
the art of data dissemination in vanets. International
journal of computer theory and engineering, 2(6):957.
Yury, A., Andrade, E., Nogueira, M., Santos, A., and
Matos, F. (2020). Social-based cooperation of vehi-
cles for data dissemination of critical urban events. In
GLOBECOM 2020 - IEEE Global Communications
Conference, pages 1–6. IEEE.
Zhang, C., Huang, W., Niu, T., Liu, Z., Li, G., and Cao, D.
(2023). Review of clustering technology and its appli-
cation in coordinating vehicle subsystems. Automotive
Innovation, 6(1):89–115.
ICEIS 2025 - 27th International Conference on Enterprise Information Systems
796
