Pancreatic Mass Segmentation Using TransUNet Network
Fael Faray de Paiva, Alexandre de Carvalho Araujo
a
, João Dallyson Sousa de Almeida
b
and Anselmo C. de Paiva
c
Núcleo de Computacão Aplicada — Universidade Federal do Maranhão (UFMA), São Luís, MA, Brazil
Keywords:
Mass, Pancreas, TransUNet, Transformer.
Abstract:
Currently, one of the major challenges in computer vision applied to medical imaging is the automatic segmen-
tation of organs and tumors. Pancreatic cancer, in particular, is extremely lethal, primarily due to the major
difficulty in early detection, resulting in the disease being identified only in advanced stages. Recently, new
technologies, such as deep learning, have been used to identify these tumors. This work uses the TransUNet
network for the task, as convolutional neural networks (CNNs) are extremely effective at capturing features but
present limitations in tasks that require greater context. On the other hand, transformer blocks are designed for
sequence-to-sequence tasks and have a high capacity for processing large contexts; however, they lack spatial
precision due to the lack of detail. TransUNet uses the Transformer as an encoder to enhance the capacity to
process content globally, while convolutional neural networks are employed to minimize the loss of features
during the process. Among the experiments presented herein, one used image pre-processing techniques and
achieved an average Dice score of 42.60±1.97%. The second experiment, a crop was applied to the mass
region, reaching an average Dice score of 79.67±2.31%.
1 INTRODUCTION
The pancreas plays a fundamental role in control-
ling energy consumption and metabolism in the hu-
man body, with both exocrine and endocrine func-
tions (Czako et al., 2009). The exocrine function is
responsible for the production and secretion of essen-
tial digestive enzymes, such as lipases, proteases, and
amylases, which are indispensable for the digestive
process. These enzymes break down glycerides, pro-
teins, and carbohydrates, enabling their absorption.
On the other hand, the endocrine functions are re-
lated to the production of crucial hormones for the
body, particularly insulin, which regulates blood glu-
cose levels and is directly linked to diabetes (Zhou
and Melton, 2018).
Pancreatic problems can lead to various health
conditions, including pancreatitis (inflammation of
the pancreas), diabetes (due to issues with insulin pro-
duction), and pancreatic cancer. Among cancer types,
pancreatic cancer, although relatively rare, is one of
the deadliest. The survival rate for pancreatic cancer
is one of the lowest among all tumor types, with a
a
https://orcid.org/0000-0002-0250-6211
b
https://orcid.org/0000-0001-7013-9700
c
https://orcid.org/0000-0003-4921-0626
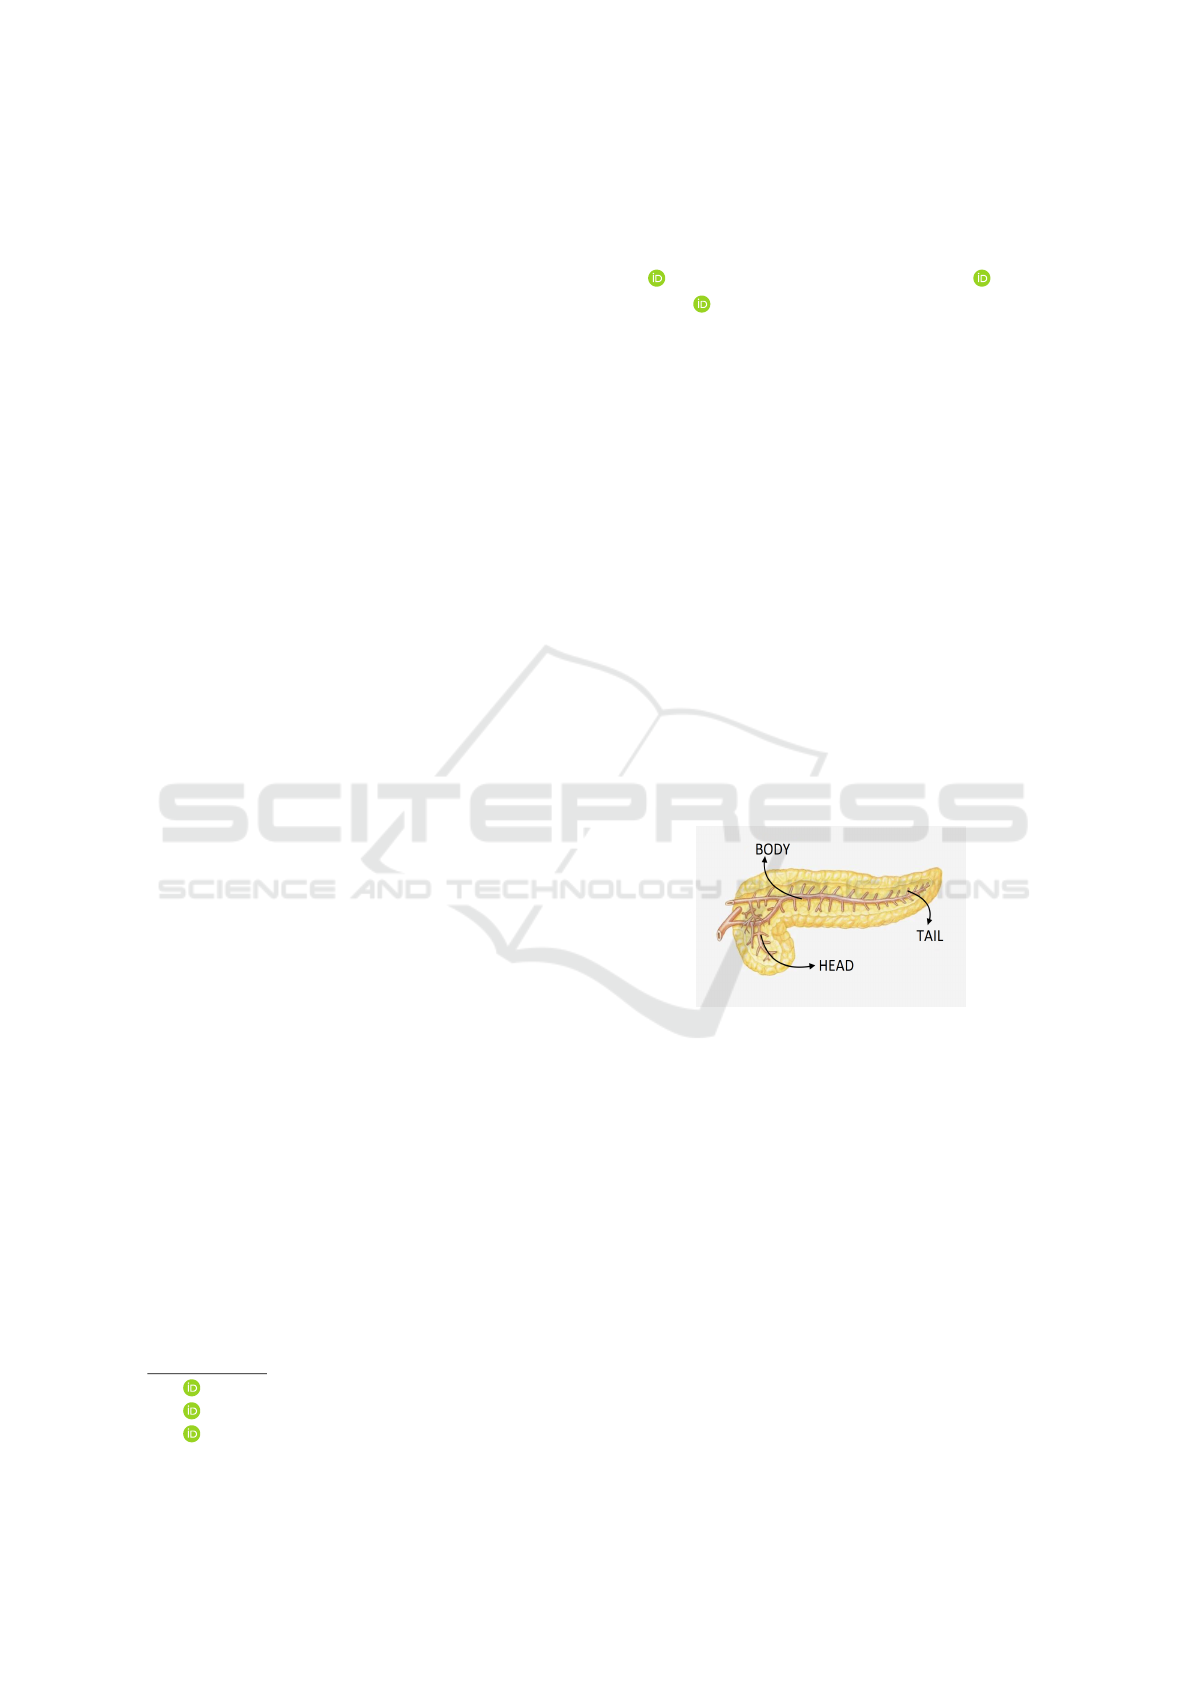
Figure 1: Pancreas anatomy.
mortality rate of 98% (Chakrabarti et al., 2023), re-
flecting the severity and the challenge of early diag-
nosis due to the organ’s location and characteristics in
imaging exams. The most common type of pancreatic
cancer is Pancreatic ductal adenocarcinoma (PDAC),
accounting for 90% of diagnosed cases (Stoffel et al.,
2023). PDAC typically affects the right side of the or-
gan (the head). The other parts of the pancreas are the
body (central region) and the tail (left side), and they
can be observed in the Figure 1.
The factors driving the lethality of PDAC are nu-
merous, centered on an inability to detect the disease
until late in progression, often after distant metastasis
(Kleeff et al., 2016). Moreover, outside of the mi-
nority (10%–15%) of cases ascribed to germline mu-
tations or known risk factors, such as mucinous cys-
tic lesions and chronic pancreatitis, there is no sin-
512
Faray de Paiva, F., Araujo, A. C., Sousa de Almeida, J. D. and C. de Paiva, A.
Pancreatic Mass Segmentation Using TransUNet Network.
DOI: 10.5220/0013292200003929
In Proceedings of the 27th International Conference on Enterprise Information Systems (ICEIS 2025) - Volume 1, pages 512-522
ISBN: 978-989-758-749-8; ISSN: 2184-4992
Copyright © 2025 by Paper published under CC license (CC BY-NC-ND 4.0)

gle attributable risk factor for most patients (Petersen,
2016).
According to the Union for International Cancer
Control (UICC), cases of pancreatic cancer increase
with age: from 10 per 100,000 inhabitants between
40 and 50 years old to 116 per 100,000 inhabitants be-
tween 80 and 85 years old, with a more significant in-
cidence in males (Choe et al., 2019). Diagnosing this
type of cancer is challenging, as cancerous tumors ex-
hibit low texture divergence from normal pancreatic
tissue.
Pancreatic cancer is a significant global health
concern, with rising incidence and mortality rates ob-
served over recent years. In 2020, approximately
495,773 new cases were diagnosed worldwide, lead-
ing to 466,003 deaths, making it the 7th leading cause
of cancer-related mortality (Seufferlein and Kestler,
2023) (Moradi et al., 2022). Identifying early diagno-
sis options is an important way to improve detection
and survival rates of pancreatic cancer. None of the
many tumor markers associated with pancreatic can-
cer are highly specific, which also indicates further re-
search is required to improve the early detection rate
(Zhao and Liu, 2020). In Computer-Aided Diagnosis
(CAD) for pancreatic cancer diagnosis, the first step
is commonly the automatic segmentation of the organ
(Chu et al., 2017). The segmentation of the pancreas
and masses within the organ presents different fac-
tors that complicate this process, such as low contrast
among soft tissue within the organ, low contrast be-
tween the pancreas and adjacent organs (liver, spleen,
and stomach), and high anatomical variation, mean-
ing that the location in the abdominal cavity and the
shape of the pancreas vary significantly from patient
to patient (Liu et al., 2019). Machine learning tech-
nologies such as CNNs and Natural Language Pro-
cessing (NLP) are a powerful tool in CAD systems as
they automatically learn features that define the target
object to be segmented.
Transformers are now the state-of-the-art in many
NLP tasks (Vaswani, 2017), it’s success in NLP has
inspired several methods in computer vision, combin-
ing CNNs with forms of self-attention to address se-
mantic segmentation (Fan et al., 2024). In this con-
text, this work aims to explore using Transformer net-
works to segment masses in the pancreas.
Early diagnosis is crucial in treatment, potentially
increasing patient survival rates up to 50% (Conroy
et al., 2018). Therefore, aiming to support the early
diagnosis, this work explores a CAD system utilizing
a transformer-based network. The objective of this
work is to propose a new computational method for
segmenting masses in the pancreas using Transformer
networks.
2 RELATED WORK
The segmentation of the pancreas and its masses in
CT images plays a crucial role in supporting medi-
cal specialists in identifying pancreatic cancer. Var-
ious computational approaches are employed to im-
prove diagnostic accuracy and reduce the risks asso-
ciated with other imaging techniques, such as radi-
ology or invasive procedures like biopsies. In recent
years, the focus has been on developing and applying
advanced image processing and deep learning tech-
niques, aiming to refine the segmentation of both the
pancreas and pancreatic tumors. This section pro-
vides a review of the most recent studies, conducted
over the past five years, exploring these technological
advancements in the context of pancreatic mass seg-
mentation.
In recent years, segmentation using Transformer
networks has gained prominence in the literature due
to their ability to capture global interactions in med-
ical images. Studies such as those by Wang et al.
(Wang et al., 2022) have demonstrated that this com-
bination improves semantic segmentation accuracy,
making it more robust against typical challenges in
medical images, such as low contrast and anatomical
variations. The flexibility of Transformers in model-
ing complex long-term interactions, without relying
solely on local relationships, allows for more detailed
and precise segmentation, which is essential in appli-
cations like tumor identification in organs such as the
pancreas. He et al. (He et al., 2023) highlighted that
Transformers can effectively model complex anatom-
ical variations and global interactions, overcoming
the limitations of CNN-based approaches. Addition-
ally, the work of Su et al. (Su et al., 2022) shows
that using Transformers in CAD systems facilitates
mass identification and segmentation, promoting ear-
lier and more accurate diagnoses, which is crucial for
increasing patient survival rates.
The most commonly used dataset is the Medi-
cal Segmentation Decathlon (MSD) (Antonelli et al.,
2022), which includes annotations for the pancreas
and masses. This dataset contains annotations for dif-
ferent organs and their internal structures; however,
this section focuses solely on the performance of pan-
creatic mass segmentation. For the segmentation of
pancreatic masses in CT images, 9 studies were found
and selected.
The automatic adaptation of the model to the prob-
lem is an approach for this scope, where the model ad-
justs its architecture (Zhu et al., 2019)) or parameters
(Isensee et al., 2018)) during training. In the work
of Zhu et al. (Zhu et al., 2019), a method for auto-
matic architecture search for segmentation networks
Pancreatic Mass Segmentation Using TransUNet Network
513

is proposed. Specifically, at each layer, the network
selects which type of convolutions to use (2D, 3D, or
pseudo-3D) to construct an encoder-decoder network.
Meanwhile, Isensee et al.(Isensee et al., 2018) pro-
posed the nn-Unet network, a self-configuring method
based on 3D-Unet that adapts to the dataset using
three types of parameters: fixed, rule-based, and em-
pirical. The self-configuring nature of this method
allows it to perform well in various biomedical ap-
plications. These studies achieved average DSCs of
37.78±32.12% and 52.27% in pancreatic mass seg-
mentation, respectively. Yang et al. (Yang et al.,
2021) propose a neural network based on Local Lin-
ear Embedding (LLE) for interpolation. The embed-
ding models the relationships between adjacent and
interpolated slices, while the neural network, com-
bined with the LLE module, enhances image resolu-
tion to generate better images for each sequence. The
proposed network achieved an average Dice score of
50.6% with a standard deviation of 30.9%.
Mahmoudi et al. (Mahmoudi et al., 2022) pro-
posed cascade segmentation methods for the mass.
They initially perform pancreas localization using a
3D Fully Connected Network (FCN) with a 3D Local
Binary Pattern. After the localization step, once the
areas of interest are identified, the mass segmentation
is conducted using the Textured U-Net, a proposed ar-
chitecture.
Cao and Li (Cao and Li, 2024) also utilizes a cas-
cade approach. Initially, an Attention U-Net is used
to localize the pancreas. Next, the segmentation of
both the pancreas and the mass is carried out. The
input image is sent to the Decoder along with a spa-
tial information retrieval mechanism that replaces the
Skip Connections, providing the Decoder with hier-
archically extracted information from the Encoder,
combined with information that may have been lost
during processing but is present in the original im-
age. Additionally, features are extracted in paral-
lel through three convolution paths with different di-
latations, merged at the end with the output of the
Encoder-Decoder to produce the final segmentation
based on features at different resolutions. The au-
thors apply the network separately for pancreas and
mass segmentation, achieving a Dice score of 54.38 ±
1.70% for the mass. Although the mean is not as high
as in other works, the low standard deviation demon-
strates the model’s stability.
Another approach targets the pancreas and mass
simultaneously. Using three modules—Temperature
Balance Loss, Rigid Temperature Optimizer, and
Temperature Indicator—the model balances the
weight between the pancreas and mass classes so that
mass learning is improved without significant loss in
pancreas learning. The result obtained on the MSD
dataset was 59.16% ± 28.12% Dice for mass segmen-
tation in the pancreas.
Table 1 summarizes the selected studies in the lit-
erature for pancreatic mass segmentation. Among
these, it is noteworthy that a high standard deviation
is present in almost all studies, except for Cao and
Li, (Cao and Li, 2024), which, despite having a lower
mean Dice performance, demonstrates superior per-
formance regarding standard deviation.
Given the studies explored in this chapter, the
proposed method aims to investigate the efficiency
of Transformer mechanisms combined with CNNs
through the TransUNet network (Chen et al., 2021)
and its application to CT images. The image dataset
from the Medical Segmentation Decathlon (MSD)
was used for evaluation and comparison with the cited
studies concerning pancreatic mass segmentation.
3 TransUNet NETWORK
The TransUNet network, proposed by Chen et al.
(Chen et al., 2021), is a hybrid architecture that com-
bines the global dependency-capturing capability of
Transformers with the spatial detail-preserving abil-
ity of U-Net. The model uses a Transformer as an en-
coder to capture large-scale contextual relationships,
followed by a U-Net-based decoder to recover fine de-
tails and perform precise segmentation of medical im-
ages, as illustrated in Figure 2.
The structure begins with a Transformer-based en-
coder, where the input image is divided into small
patches (typically 16x16 pixels), a technique inspired
by the Vision Transformer (ViT) proposed by (Doso-
vitskiy, 2020). Each patch is “flattened” into a se-
quence of numbers and then transformed into a vector
with more relevant features through a linear layer, a
process known as embedding, which creates a dense
and continuous representation of the patches, allow-
ing the model to work with them more efficiently.
Since Transformers, originally introduced by
(Vaswani, 2017), lack an intrinsic structure to capture
the position of elements, a positional encoding vector
is added to each embedding to preserve the spatial or-
der of the patches, enabling the model to understand
the relative location of different patches in the origi-
nal image. The embedding sequence is illustrated in
Figure 2, above the ViT layer.
After the encoding step done by the Transform-
ers, TransUNet uses a U-Net-style decoder (Ron-
neberger et al., 2015), which reconstructs the origi-
nal image resolution through upsampling and convo-
lutions. This process is supported by skip connections
ICEIS 2025 - 27th International Conference on Enterprise Information Systems
514
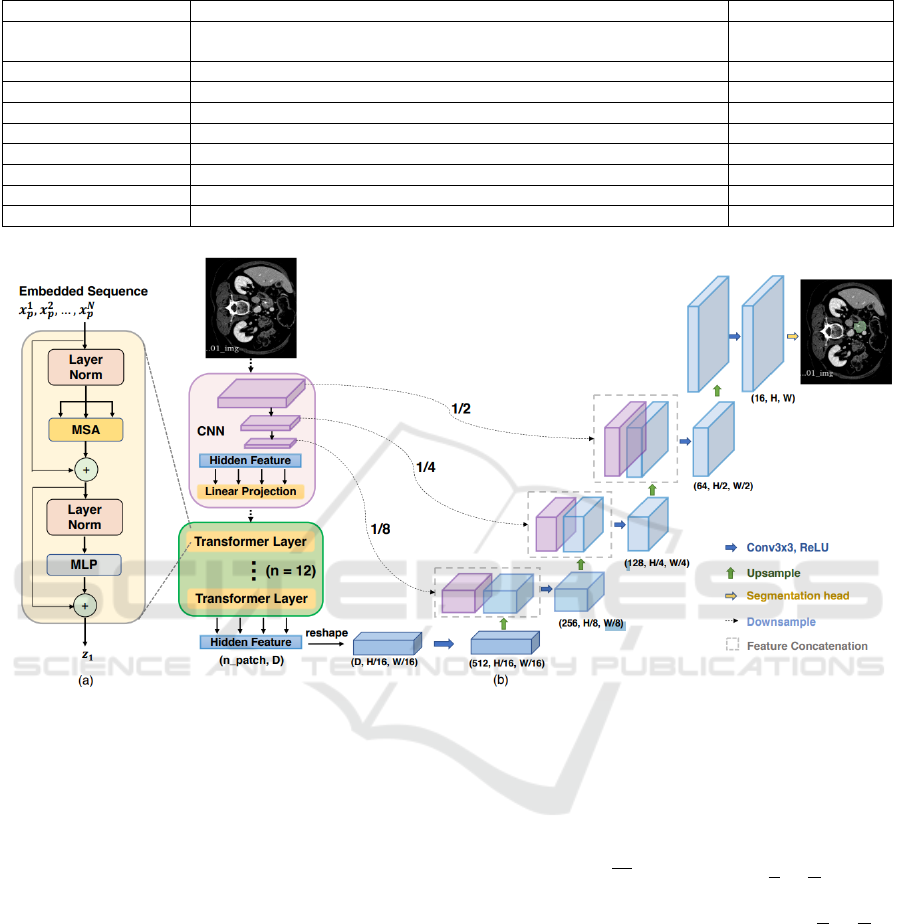
Table 1: Comparison of segmentation methods with their respective performances and standard deviations.
Authors Method DSC by patient (%)
(Ju et al., 2023)
Spacial Visual Cues Fusion (SVCF)
Active Localization OffseT (ALOT)
63.36
(Mahmoudi et al., 2022)
Texture Attention U-Net (TAU-Net)
60.6
(Li et al., 2023)
Temperature Guided 3D FCN
59.16 ± 28.12
(Cao and Li, 2024)
Strongly Representative Semantic-guided Segmentation Network (SRSNet)
54.38 ± 1.7
(Ture
ˇ
cková et al., 2020)
V-Net
52.99
(Isensee et al., 2018)
nn-Unet
52.27
(Yang et al., 2021)
Local Linear Embedding Interpolation Neural Network
50.6 ± 30.9
(Li et al., 2020)
Position Guided Deformable U-Net (PDF-Unet)
50.12 ± 30,86
(Zhu et al., 2019)
V-Nas
37.78 ± 32.12
Figure 2: TransUNet’s architecture (Chen et al., 2021).
between corresponding encoder and decoder layers,
allowing spatial details captured during encoding to
be directly used in decoding. These connections are
crucial to ensure that the final segmentation is accu-
rate, combining global information extracted by the
ViT layers with local details provided by U-Net.
This combination makes TransUNet effective in
capturing global contexts and local details, essential
for complex segmentations in medical images, where
edge precision and global anatomical context are nec-
essary (Chen et al., 2021).
Instead of using a pure Transformer as the
encoder, TransUNet employs a hybrid CNN-
Transformer model, where the CNN is initially used
as a feature extractor to generate a feature map from
the input. Subsequently, patch embedding is applied
to 1x1 patches extracted from the CNN’s feature map
instead of directly from raw images. This allows for
leveraging the high-resolution intermediate feature
maps of the CNN in the decoding path and demon-
strates superior performance compared to using a
pure Transformer as the encoder.
A Cascaded Upsampling Path (CUP) is used in
the network and consists of multiple upsampling steps
to decode hidden features and generate the final seg-
mentation mask. After reshaping the hidden feature
sequence z
L
∈ R
HW
P
2
×D
to the form
H
P
×
W
P
× D, the
CUP is instantiated by chaining multiple upsampling
blocks to achieve the full resolution of
H
P
×
W
P
to
H ×W , where each block consists of a 2× upsampling
operators, a 3×3 convolutional layer, and a ReLU
layer, which eliminates negative numbers by compar-
ing them with 0 and selecting the higher value.
The CUP and the hybrid encoder form a “U”-
shaped architecture, enabling the aggregation of fea-
tures at different resolution levels through skip con-
nections. The detailed architecture of the CUP and the
intermediate skip connections can be found in Figure
2.
Pancreatic Mass Segmentation Using TransUNet Network
515

4 MATERIALS AND METHOD
This section outlines the materials used and the pro-
cedures employed to conduct the study. It details the
dataset, preparation techniques, analytical methods,
and statistical tools used to ensure reliable results. By
describing each step, this section provides a clear un-
derstanding of the experimental setup and methodol-
ogy.
Figure 3 outlines the method implemented in this
work step by step, starting by the raw data provided
by the MSD dataset, a volume of the CT from a pa-
tient with dimensions 512 x 512 x z. Then we take
in consideration only the slices with the presence of
masses and apply on them a Hounsfield windowing
to highlight the pancreas area. Before doing the k-
fold division, for the experiment 2, we do a crop of
a square near the pancreas area, with a size of 256 x
256. Now we perform the k-fold division by patient,
taking in consideration that slices from the same pa-
tient could compromise the reliability of the results.
After a simple Data augmentation the the data is pro-
vided to the network.
4.1 Dataset
In the experiments, the public dataset Medical Seg-
mentation Decathlon (MSD) was selected, specif-
ically Challenge 7 for pancreatic mass segmenta-
tion (Antonelli et al., 2022), which includes CT im-
ages from the venous phase of the full torso. The
Memorial Sloan Kettering Cancer Center in New
York provides the scans. The reconstruction and
acquisition settings were: automatic tube current
modulation range, 220–380 mA; pitch/table speed,
0.984–1.375/39.37–27.50 millimeters; noise index,
12.5–14; 120 kVp; tube rotation speed, 0.7–0.8 ms;
scan delay, 80–85 s; and axial slices reconstructed at
2.5 mm intervals.
The dataset contains three types of masses: Pan-
creatic Adenocarcinoma, Pancreatic Neuro-endocrine
Tumor, and Intraductal papillary mucinous neo-
plasms. However, it does not provide any indica-
tive labeling to differentiate among them within the
dataset. A specialist manually marked the segmenta-
tion of the pancreatic parenchyma and the mass (cyst
or tumor) in the dataset using the scout application.
A total of 420 CT scans are available, but only 281
include radiologist annotations for training, while the
remaining 139 are reserved exclusively for challenge
testing. All experiments in this research were con-
ducted solely on the training set (with annotations),
following the standard in the literature; for example,
Cao and Li (Cao and Li, 2024), Li et al. (Li et al.,
2023) and Ju et al.(Ju et al., 2023).
Figure 4 shows how the raw data is provided by
the dataset, which originally consisted of files in the
NIFTI format, characterized by volumes with a reso-
lution of 512x512 and variable height depending on
the patient, with a minimum value of 37 and a maxi-
mum of 751.
4.2 Pre-Processing
This step standardizes the input data and improves the
network’s effectiveness by increasing the contrast of
the object of interest relative to non-relevant tissues.
The Hounsfield Unit (HU) windowing technique is
widely used in computed tomography (CT) to opti-
mize the visualization of different tissue types in med-
ical images. HU values are a quantitative scale re-
flecting tissue density compared to water, which has a
value of 0 HU. Air, for instance, has a value of -1000
HU, while bone tissues can reach values above 1000
HU. The windowing technique allows for adjusting
the range of Hounsfield values displayed in the image,
explicitly highlighting the tissues of interest. This ad-
justment is performed by setting the upper and lower
thresholds, which are defined according to Equations
(1) and (2), respectively:
upper threshold = center +
width
2
(1)
lower threshold = center −
width
2
(2)
Any HU value greater than the upper threshold is
truncated to the upper threshold value, and any HU
value lower than the lower threshold is truncated to
the lower threshold value.
Hounsfield windowing was performed for all re-
served slices with masses. The center and width val-
ues used, according to Equations 2 and 1, were 50 and
400, respectively. This adjustment changed the origi-
nal CT window, ranging from -4096 to 2048 HUs, to a
range of -150 to 250 HUs. According to Mo et al.(Mo
et al., 2020), this interval enhances soft tissues in the
abdomen, a category to which the pancreas belongs.
In the pre-processing phase, the data, initially pro-
vided in NIFTI format containing the patient’s com-
plete CT volume, were limited to slices with masses.
After this step, the data were split into four folds, each
containing 25% of the total number of patients, and
basic data augmentation techniques, such as orthogo-
nal rotation and random inversion along the x and y
axes, were applied.
ICEIS 2025 - 27th International Conference on Enterprise Information Systems
516
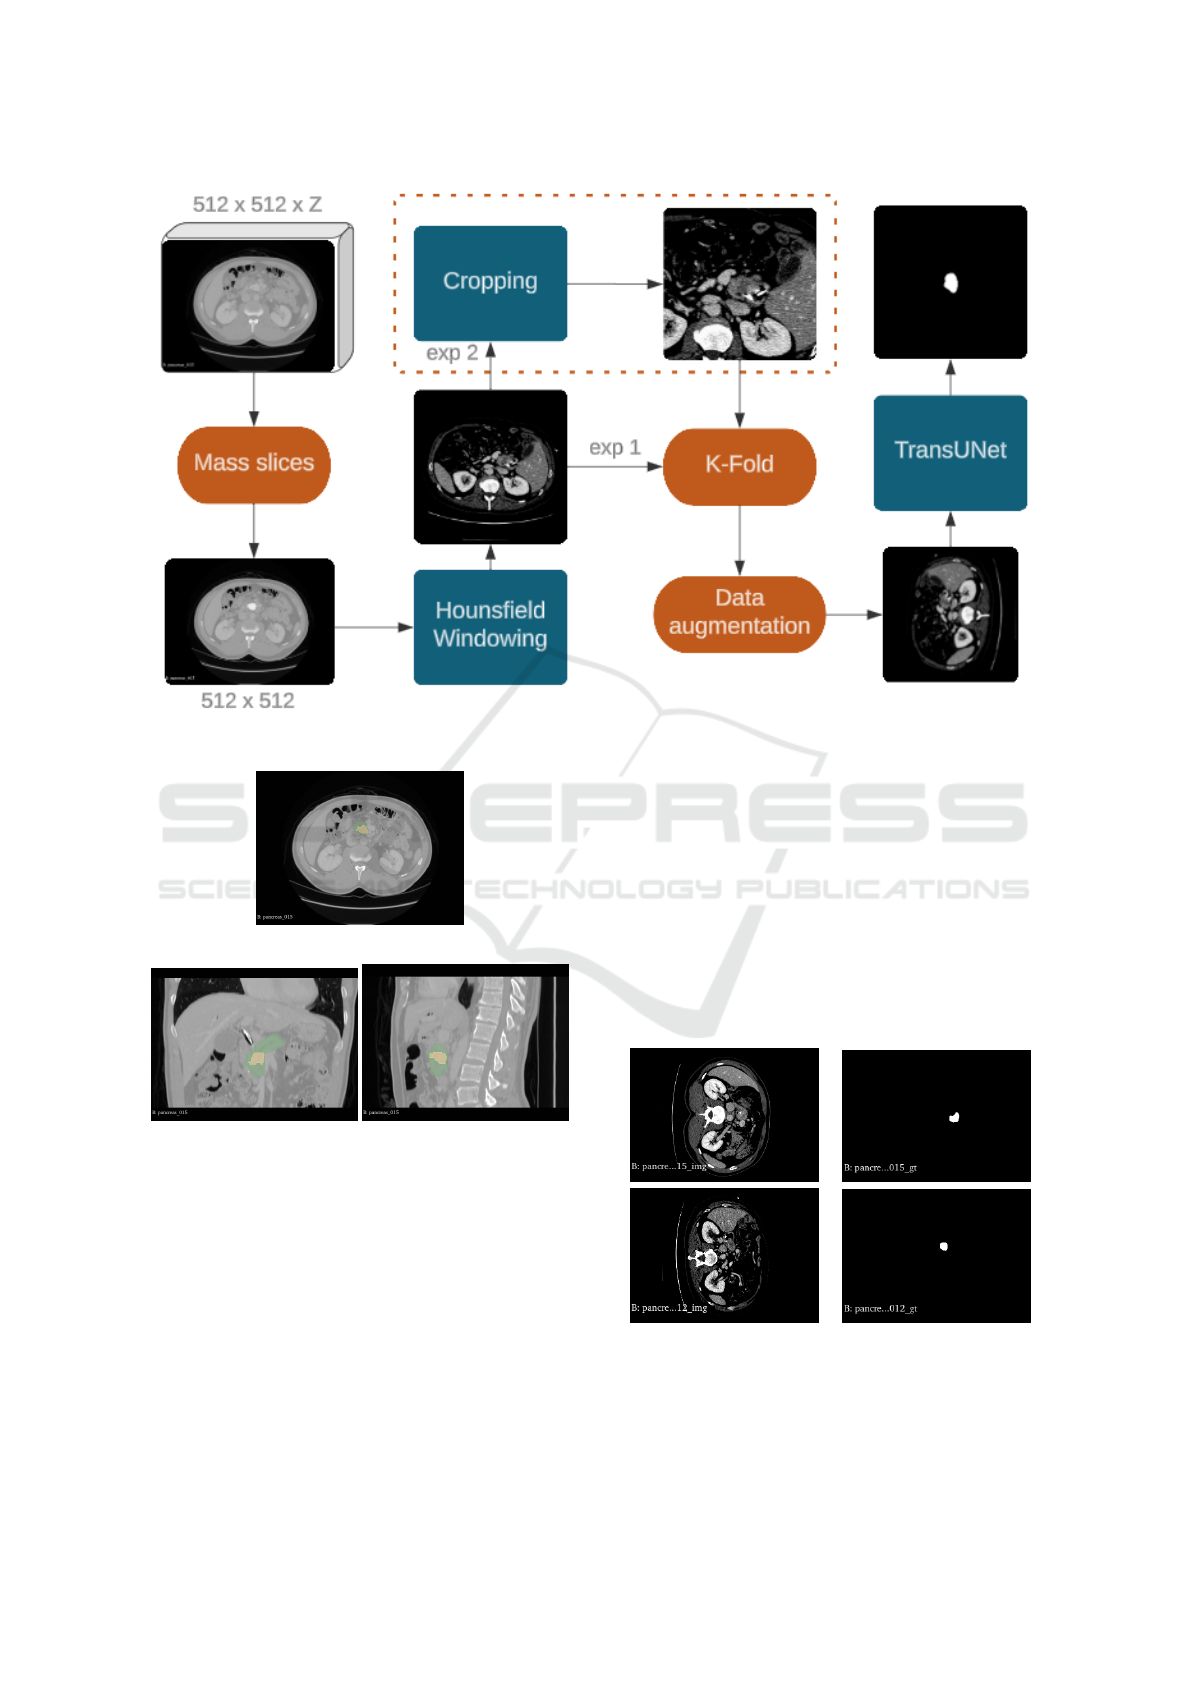
Figure 3: Method proposed.
(a) axial slice
(b) coronal slice (c) sagittal slice
Figure 4: Examples from MSD base. Green notattion for
pancreas and yellow for masses.
4.3 Cropped Slice
This work highlights two experiments conducted.
One is more general and closer to real-world scenar-
ios, applying some pre-processing steps to the data
and providing them to the network, as shown in Fig-
ure 2. The other experiment focuses more specifi-
cally on segmenting the pancreatic mass, as a crop-
ping technique is applied around the mass region be-
fore performing the segmentation. The configurations
and results of both experiments will be presented be-
low.
4.3.1 Experiment 1:Full Slice
In the first experiment, the complete slices were used
as input. The input resolution and patch size are
512x512 and 16, respectively. Each fold was trained
for 200 epochs with a batch size of 4. Figure 5 pro-
vides examples of how the images were fed into the
network.
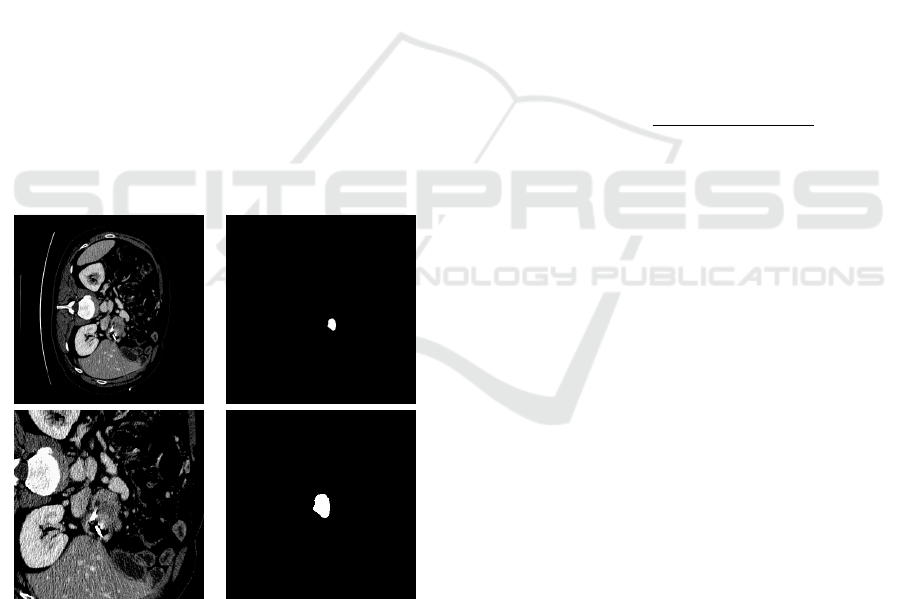
Figure 5: Examples of full slices on the left side and their
respective masks on the right side.
Pancreatic Mass Segmentation Using TransUNet Network
517
4.3.2 Experiment 2: Cropped Slice
In the second experiment, a crop of the complete
slices of the patients were performed and used as in-
put. The resolution and patch size used were 256x256
and 16, respectively. Each fold was trained for 200
epochs with a batch size of 16. Figure 6 provides ex-
amples of how the images were fed into the network.
This crop was performed by locating the central point
of the mass in the mask and then extracting a 256x256
square. By cropping the region of interest, the model
focuses on the parts of the image containing relevant
information for the specific task, which, in this case,
is mass segmentation. This reduces the amount of ir-
relevant or background information the model needs
to process, increasing accuracy by highlighting only
the data directly important for prediction. Since the
mass comprises a tiny region of the image, the crop-
ping technique can be highly effective. Increasing
the batch size from 4 to 16 improves gradient stabil-
ity and smoothness, meaning weight updates during
training become more consistent, helping the model
converge more quickly. Additionally, larger batches
are more efficient for parallel processing on GPUs,
which speeds up training time per iteration. Figure 6
presents examples of the input data used for the net-
work in this experiment.
(A) (B)
Figure 6: In A original and crop, in B their respective
masks.
A significant increase in the proportion of the mass
size relative to the image size can be observed, en-
hancing the prominence of the segmentation target
and consequently facilitating the network’s training.
4.4 TransUnet Training
For the network’s hybrid encoder, a combination of
ResNet-50 (He et al., 2016) and ViT (Vaswani, 2017),
termed “R50-ViT”, as presented by Chen et al.(Chen
et al., 2021), was chosen. All Transformers (i.e., ViT)
and ResNet-50 backbones (referred to as “R-50”)
were pre-trained on ImageNet (Deng et al., 2009).
All 3D volumes were trained and inferred slice-
by-slice, and the predicted 2D slices were stacked to
reconstruct the 3D prediction for evaluation. In the
network’s training phase, the average between Cross-
Entropy Loss and Dice Loss was used as the loss func-
tion. Each is described by Equations 3 and 4, respec-
tively. Since Cross-Entropy Loss effectively captures
the correct probability for each pixel or voxel, while
Dice Loss focuses on the overlap of the segmented
classes, this selection aimed to improve local accu-
racy and overall segmentation.
L
CE
= −
N
∑
i=1
T
i
log(P
i
) (3)
L
Dice
= 1 −
2
∑
N
i=1
P
i
T
i
+ ε
∑
N
i=1
P
i
+
∑
N
i=1
T
i
+ ε
(4)
Where “T” represents the target set, the ground truth
masks the images as defined by experts, and “P” is the
set of predictions generated by the network.
The models were trained using the SGD optimizer
with a learning rate set to 0.0001, momentum of 0.9,
and weight decay of 1e-4.
4.5 Experiments
All experiments were conducted on hardware config-
ured with an NVIDIA GeForce GTX 3060 GPU with
12 GB of VRAM.
The cross-validation technique was used for
model evaluation, which involves splitting the dataset
into folds for training and testing, as mentioned previ-
ously. In this research, a 4-fold division was chosen.
A different test is performed for each fold, with the
remaining folds used for training in each test. This in-
creases evaluation confidence and tests the influence
of data variation on the network, thereby determining
the model’s generalization.
4.6 Evaluation Metrics
The evaluation metrics used were the Dice coefficient
(D), described in Equation 5, and the HD95 metric
(Hausdorff Distance at 95th percentile), described in
Equation6. The Dice coefficient aims to measure the
ICEIS 2025 - 27th International Conference on Enterprise Information Systems
518
similarity between two samples, which, in the con-
text of this work, represents the similarity between the
generated predictions and the reference values (Taha
and Hanbury, 2015).
DSC =
2 × T P
2 × T P +FP + FN
(5)
Where “TP” means True Positives, which represents
pixels correctly classified as mass; “FP” means False
Positives, which consists of pixels incorrectly classi-
fied as mass; and “FN” is False Negatives that repre-
sents pixels incorrectly classified as not being mass.
The HD95 metric (Hausdorff Distance at 95th per-
centile) is a variation of the Hausdorff Distance (HD),
which measures the maximum discrepancy between
two sets of points (such as contours in segmented im-
ages) (Taha and Hanbury, 2015). While the traditional
Hausdorff Distance considers the maximum value of
all distances, HD95 only considers the 95th percentile
of the distances, making it less sensitive to outliers
and more robust for evaluating the similarity between
two segmentations.
HD95(P, T ) = max
(
sup
p∈P
inf
t∈T
∥p − t∥, sup
t∈T
inf
p∈P
∥t − p∥
)
(6)
’inf’ represents the shortest distance between a point
x from a set X and Y, ’sup’ selects the largest mini-
mum distance (inf), and ’max’ takes the highest value
between the two suprema.
5 RESULTS AND DISCUSSION
This section highlights and discuss the results from
the previously commented experiments.
5.1 Results from Full Slices
The experiment 4.3.1, which refers to a more general
and complex segmentation, mainly due to the lack of
detail, achieved an average DICE of approximately
0.426 and an average HD of 17.58. The complete
cross-validation results are shown in Table 2.
Table 2: Pancreatic mass segmentation for Full slices of the
patients.
Folds ↑ Dice (%) ↓ HD95
Fold 1 41.37 14
Fold 2 42.98 20
Fold 3 40.42 21
Fold 4 45.61 15.3
Average 42.60±1.97 17.58
Analyzing the average HD value, it can be ob-
served that the shape of the mass segmented by the
model approximated the expert’s annotation; how-
ever, there is still room for improvement. Examples
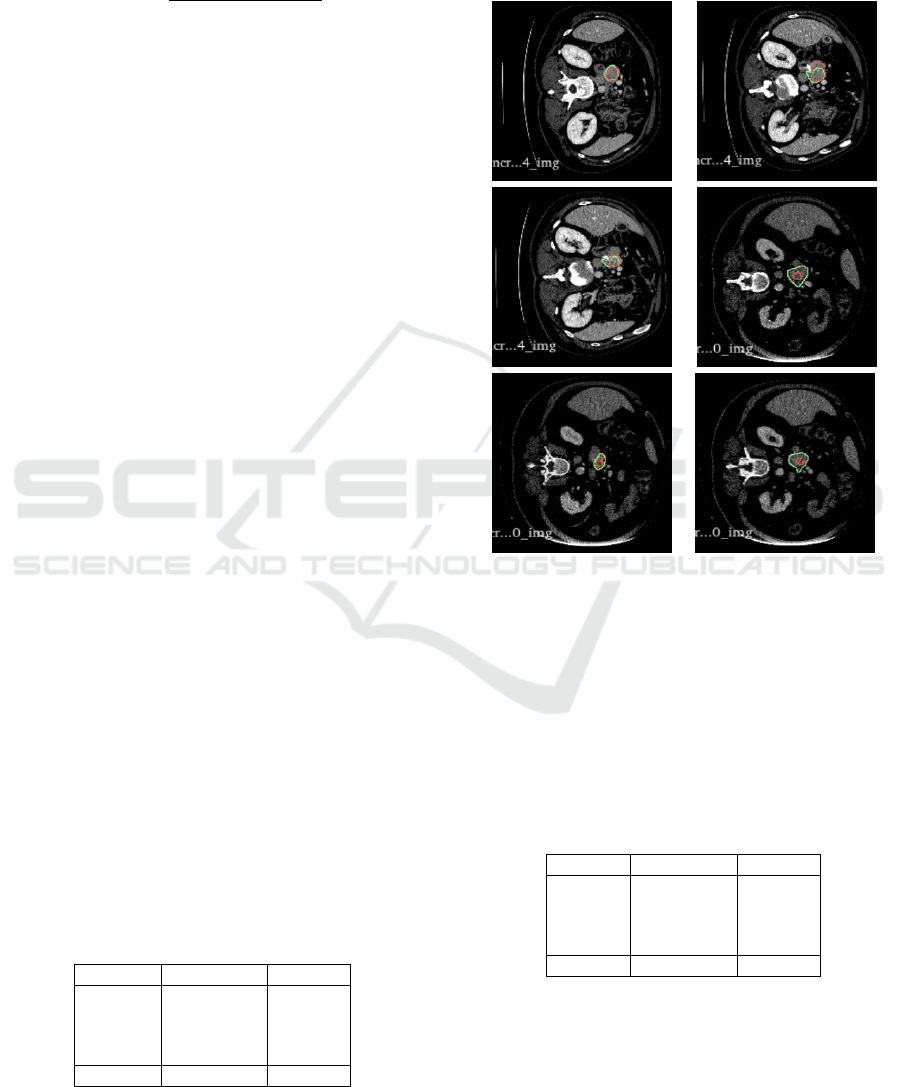
of the predictions can be found in Figure 7.
Figure 7: Examples of predictions from the TransUNet net-
work in fold number 4. The red marking indicates the net-
work’s prediction, while the green marking represents the
expert’s annotation.
5.2 Results from Cropped Segmentation
The results of the cross-validation for experiment
from cropped region segmentation are presented in
the Table 3.
Table 3: Pancreatic mass segmentation for the cropped
slices.
Folds ↑ Dice (%) ↓ HD95
Fold 1 81.41 4.12
Fold 2 79.92 4.12
Fold 3 75.82 7.87
Fold 4 81.51 6.63
average 79.67±2.31 5.69
It showed a very promising Dice score average of
79.67%, with a good standard deviation of 2.31, these
results are 16.31% up in comparing with the State
of the Art (Ju et al., 2023).Analyzing the HD95, we
can observe that the network produced a segmenta-
Pancreatic Mass Segmentation Using TransUNet Network
519
tion very close to the expert’s annotation. For exam-
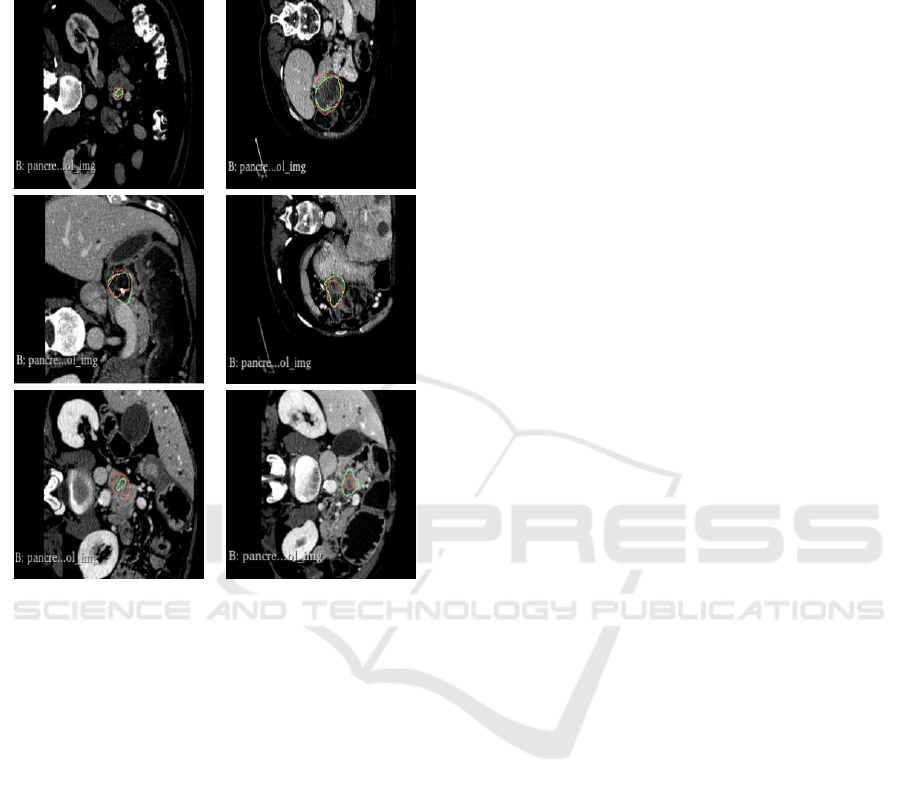
ple, Figure 8 shows segmentation examples in good,
medium and relatively poor cases in decreasing order.
Figure 8: Examples of TransUNet network predictions in
fold 4 for the cropped region. The red marking indicates the
network’s prediction, while the green marking represents
the expert’s annotation.
In comparing the method with the literature, this
work uses the nine other studies described in section
2. Table 4 presents the studies in descending order of
Dice score.
As observed from the standard deviation in each
case (among those providing this information), all re-
sults tend to be highly volatile. At the same time, the
method used here shows low variation, specifically
the second-lowest reported in the literature.
Thus, it can be concluded that, after an initial lo-
calization of the target object, the TransUNet network
performs excellently for pancreatic mass segmenta-
tion, achieving an average Dice score of 79.67 with
a standard deviation of 2.31%. However, it is worth
noting that extracting the crop based on the mass cen-
ter may influence the results, as the target object is
always centered.
It was also noted that the network is more ef-
fective in segmenting masses with a more rounded
shape and less effective for irregularly shaped masses.
These results indicate that, in a scenario with pre-
cise localization of the mass region, the method is
significantly more effective than the state-of-the-art
(Ju et al., 2023) for pancreatic mass segmentation.
However, its performance in more general segmenta-
tion, covering the entire CT data, is less satisfactory,
with an average Dice score of 42.60%, despite being
quite consistent, as indicated by a standard deviation
of ±1.97
6 CONCLUSION
Early diagnosis is a crucial factor in disease out-
comes, as patients diagnosed at stage 1 can have a
more favorable prognosis, with up to 80% survival
over five years. This study aimed to propose meth-
ods that reduce the number of late diagnoses (Cheng,
2018).
One of the main challenges for early diagnosis of
pancreatic cancer is the pancreas’s small size, its low
contrast compared to adjacent structures, and pancre-
atic tissue in imaging exams, such as computed to-
mography. Additionally, computed tomography gen-
erates several images, making manual analysis chal-
lenging. In this context, computational methods play
an essential role, as they can assist in diagnosis by re-
ducing analysis time and helping identify pathologies.
In this work, two methods were proposed. The
first method involved applying the TransUNet net-
work for images from the MSD Dataset. This method
was designed for pancreatic masses segmentation
from the complete CT slice. While its results showed
limitations, it also presented a low standard deviation.
The second method required the initial detection of
the mass region, and then, from this ROI, the pancre-
atic mass segmentation was performed, enhancing the
target’s prominence. This method presents the limita-
tion of the requirement of a previous ROI detection
phase but presents better results for the segmentation.
This work indicated the potential of deep learning
techniques, such as the TransUNet network, for seg-
menting pancreatic mass from CT scans. Even with
the challenges posed by the pancreas’s small size and
low contrast, these techniques show promise in im-
proving the early diagnosis of pancreatic cancer. The
experiments also highlight insights into the impor-
tance of focusing the segmentation on the region of
interest that contains the mass to improve the segmen-
tation method performance, as shown in the second
proposed method. The work also underscores the ur-
gent need for further research to explore the automatic
detection of the mass ROI and the exploration of data
augmentation techniques to increase the robustness of
ICEIS 2025 - 27th International Conference on Enterprise Information Systems
520
Table 4: Comparison of segmentation methods with their respective performances and standard deviations.
Authors Method DSC by patient (%)
This work
TransUNet with crop
79.67±2.31
(Ju et al., 2023)
Spacial Visual Cues Fusion (SVCF)
Active Localization OffseT (ALOT)
63.36
(Mahmoudi et al., 2022)
Texture Attention U-Net (TAU-Net)
60.6
(Li et al., 2023)
Temperature Guided 3D FCN
59.16 ± 28.12
(Cao and Li, 2024)
Strongly Representative Semantic-guided Segmentation Network (SRSNet)
54.38 ± 1.7
(Ture
ˇ
cková et al., 2020)
V-Net
52.99
(Isensee et al., 2018)
nn-Unet
52.27
(Yang et al., 2021)
Local Linear Embedding Interpolation Neural Network
50.6 ± 30.9
(Li et al., 2020)
Position Guided Deformable U-Net (PDF-Unet)
50.12 ± 30.86
This work
TransUNet
42.4 ± 2.6
(Zhu et al., 2019)
V-Nas
37.78 ± 32.12
the models. This emphasis on the need for continuous
research highlights this work’s importance and poten-
tial impact.
The relevance of the proposed work lies in its con-
tribution to the development of computational tools
that can assist in the early diagnosis of pancreatic can-
cer, a disease with a poor prognosis when detected
late. The work propositions have the potential to help
healthcare professionals identify pancreatic masses
earlier and, after improvements and validation, con-
tribute to better treatment outcomes for patients.
Validation of the second proposed method by in-
troducing positional shifts to the mass would be a
valuable direction. Additionally, developing a detec-
tion, a kind of gross segmentation followed by a more
detailed segmentation step, appears promising, as the
initial results of this experiment were positive. Fur-
ther investigation into advanced pre-processing meth-
ods to enhance the visibility of the pancreatic mass,
such as wavelet or Fourier transforms, could also
yield significant improvements. These proposed steps
are intended to improve the practical applicability of
the methods, bringing them closer to potential clinical
deployment.
ACKNOWLEDGMENTS
The authors acknowledge the Coordenação de Aper-
feiçoamento de Pessoal de Nível Superior (CAPES),
Brazil - Finance Code 001, Conselho Nacional de
Desenvolvimento Científico e Tecnológico (CNPq),
Brazil, and Fundação de Amparo à Pesquisa De-
senvolvimento Científico e Tecnológico do Maran-
hão (FAPEMA) (Brazil), Empresa Brasileira de
Serviços Hospitalares (Ebserh) Brazil (Grant number
409593/2021-4) for the financial support.
REFERENCES
Antonelli, M., Reinke, A., Bakas, S., Farahani, K., Kopp-
Schneider, A., Landman, B. A., Litjens, G., Menze,
B., Ronneberger, O., Summers, R. M., et al. (2022).
The medical segmentation decathlon. Nature commu-
nications, 13(1):4128.
Cao, L. and Li, J. (2024). Strongly representative semantic-
guided segmentation network for pancreatic and pan-
creatic tumors. Biomedical Signal Processing and
Control.
Chakrabarti, G. et al. (2023). Diagnosing and monitoring
pancreatic cancer through cell-free dna methylation:
progress and prospects. Biomarker Research, 11:12–
34.
Chen, J., Lu, Y., Yu, Q., Luo, X., Adeli, E., Wang, Y., Lu, L.,
Yuille, A. L., and Zhou, Y. (2021). Transunet: Trans-
formers make strong encoders for medical image seg-
mentation. arXiv preprint arXiv:2102.04306.
Cheng, S. (2018). Punção ecoendoscópica de massas sóli-
das pancreáticas por técnica de pressão negativa ver-
sus capilaridade: estudo prospectivo e randomizado.
PhD thesis, Universidade de São Paulo, São Paulo,
Brasil.
Choe, J., Kim, K. W., Kim, H. J., Kim, D. W., Kim, K. P.,
Hong, S.-M., Ryu, J.-S., Tirumani, S. H., Krajewski,
K., and Ramaiya, N. (2019). What is new in the 2017
world health organization classification and 8th ameri-
can joint committee on cancer staging system for pan-
creatic neuroendocrine neoplasms? Korean journal of
radiology, 20(1):5–17.
Chu, L. C., Goggins, M. G., and Fishman, E. K. (2017). Di-
agnosis and detection of pancreatic cancer. The Can-
cer Journal, 23(6):333–342.
Conroy, T., Hammel, P., Hebbar, M., Ben Abdelghani, M.,
Wei, A. C., Raoul, J.-L., Choné, L., Francois, E.,
Artru, P., Biagi, J. J., et al. (2018). Folfirinox or gemc-
itabine as adjuvant therapy for pancreatic cancer. New
England Journal of Medicine, 379(25):2395–2406.
Czako, L., Hegyi, P., Rakonczay, Z., Wittmann, T., and Ot-
suki, M. (2009). Interactions between the endocrine
and exocrine pancreas and their clinical relevance.
Pancreatology, 9(4):351–359.
Pancreatic Mass Segmentation Using TransUNet Network
521

Deng, J., Dong, W., Socher, R., Li, L.-J., Li, K., and Fei-
Fei, L. (2009). Imagenet: A large-scale hierarchical
image database. In 2009 IEEE conference on com-
puter vision and pattern recognition, pages 248–255.
Ieee.
Dosovitskiy, A. (2020). An image is worth 16x16 words:
Transformers for image recognition at scale. arXiv
preprint arXiv:2010.11929.
Fan, X., Zhou, J., Jiang, X., Xin, M., and Hou, L. (2024).
Csap-unet: Convolution and self-attention paralleling
network for medical image segmentation with edge
enhancement. Computers in Biology and Medicine,
172:108265.
He, K., Gan, C., Li, Z., Rekik, I., Yin, Z., Ji, W., Gao, Y.,
Wang, Q., Zhang, J., and Shen, D. (2023). Transform-
ers in medical image analysis. Intelligent Medicine,
3(1):59–78.
He, K., Zhang, X., Ren, S., and Sun, J. (2016). Deep resid-
ual learning for image recognition. In Proceedings of
the IEEE conference on computer vision and pattern
recognition, pages 770–778.
Isensee, F., Petersen, J., Klein, A., Zimmerer, D., Jaeger,
P. F., Kohl, S., Wasserthal, J., Koehler, G., Norajitra,
T., Wirkert, S., et al. (2018). nnu-net: Self-adapting
framework for u-net-based medical image segmenta-
tion. arXiv preprint arXiv:1809.10486.
Ju, J., Li, J., Chang, Z., Liang, Y., Guan, Z., Xu, P., and
Xie, F. (2023). Incorporating multi-stage spatial vi-
sual cues and active localization offset for pancreas
segmentation. Pattern Recognition Letters.
Kleeff, J., Korc, M., Apte, M., La Vecchia, C., Johnson,
C. D., Biankin, A. V., Neale, R. E., Tempero, M., Tu-
veson, D. A., Hruban, R. H., et al. (2016). Pancreatic
cancer. Nature reviews Disease primers, 2(1):1–22.
Li, Q., Liu, X., He, Y., Li, D., and Xue, J. (2023). Temper-
ature guided network for 3d joint segmentation of the
pancreas and tumors. Neural Networks.
Li, Z., Pan, H., Zhu, Y., and Qin, A. (2020). Pgd-unet: A
position-guided deformable network for simultaneous
segmentation of organs and tumors. In 2020 Interna-
tional Joint Conference on Neural Networks (IJCNN).
IEEE.
Liu, S., Yuan, X., Hu, R., Liang, S., Feng, S., Ai, Y., and
Zhang, Y. (2019). Automatic pancreas segmentation
via coarse location and ensemble learning. IEEE Ac-
cess, 8:2906–2914.
Mahmoudi, T., Kouzahkanan, Z., and Radmard, A. (2022).
Segmentation of pancreatic ductal adenocarcinoma
(pdac) and surrounding vessels in ct images using
deep convolutional neural networks and texture de-
scriptors. Scientific Reports.
Mo, J., Zhang, L., Wang, Y., and Huang, H. (2020). It-
erative 3d feature enhancement network for pancreas
segmentation from ct images. Neural Computing and
Applications, 32:12535–12546.
Moradi, N., Doshantapeh, A. G., Sangi, S., Aligholizadeh,
M., Asadian, A., Abdolmohammadi, G., Ghare-
bakhshi, F., Abdolmohammadi, G., and Molaee, H.
(2022). 4. an ecological study of the incidence and
mortality rates of pancreatic cancer in 2020: explor-
ing gender disparities worldwide. Journal of renal en-
docrinology.
Petersen, G. M. (2016). Familial pancreatic cancer. In Sem-
inars in oncology, volume 43, pages 548–553. Else-
vier.
Ronneberger, O., Fischer, P., and Brox, T. (2015). U-
net: Convolutional networks for biomedical image
segmentation. In Medical image computing and
computer-assisted intervention–MICCAI 2015: 18th
international conference, Munich, Germany, October
5-9, 2015, proceedings, part III 18, pages 234–241.
Springer.
Seufferlein, T. and Kestler, A. M. R. (2023). 1. [exocrine
pancreatic cancer - what is new in the update of the s3
guideline?]. Deutsche Medizinische Wochenschrift.
Stoffel, E. M., Brand, R. E., and Goggins, M. (2023). Pan-
creatic cancer: Changing epidemiology and new ap-
proaches to risk assessment, early detection, and pre-
vention. Gastroenterology, 164(5):752–765. Person-
alizing GI Cancer Risk Assessment and Management:
The Future is Now.
Su, Y., Liu, Q., Xie, W., and Hu, P. (2022). Yolo-
logo: A transformer-based yolo segmentation model
for breast mass detection and segmentation in digital
mammograms. Computer Methods and Programs in
Biomedicine, 221:106903.
Taha, A. A. and Hanbury, A. (2015). Metrics for evaluating
3d medical image segmentation: analysis, selection,
and tool. BMC Medical Imaging, 15(1):29.
Ture
ˇ
cková, A., Ture
ˇ
cek, T., et al. (2020). Improving ct im-
age tumor segmentation through deep supervision and
attentional gates. Frontiers in Robotics and AI.
Vaswani, A. (2017). Attention is all you need. arXiv
preprint arXiv:1706.03762.
Wang, T., Lan, J., Han, Z., Hu, Z., Huang, Y., Deng, Y.,
Zhang, H., Wang, J., Chen, M., Jiang, H., et al. (2022).
O-net: a novel framework with deep fusion of cnn and
transformer for simultaneous segmentation and classi-
fication. Frontiers in neuroscience, 16:876065.
Yang, X., Chen, Y., Yue, X., Ma, C., and Yang, P. (2021).
Local linear embedding based interpolation neural
network in pancreatic tumor segmentation. Applied
Intelligence.
Zhao, Z. and Liu, W. (2020). Pancreatic cancer: a review of
risk factors, diagnosis, and treatment. Technology in
cancer research & treatment, 19:1533033820962117.
Zhou, Q. and Melton, D. A. (2018). Pancreas regeneration.
Nature, 557(7705):351–358.
Zhu, Z., Liu, C., Yang, D., Yuille, A., et al. (2019). V-nas:
Neural architecture search for volumetric medical im-
age segmentation. In 2019 International Conference
on Computer Vision (ICCV). IEEE.
ICEIS 2025 - 27th International Conference on Enterprise Information Systems
522
