
A Solution Procedure for Fixed Mammography Unit Location-Allocation
and Mobile Mammography Unit Routing Problems
Romário dos S. L. de Assis
1,4 a
, Marcos V. A. de Campos
1,2 b
, Marcone J. F. Souza
1,3 c
,
Maria A. L. Souza
4 d
, Eduardo C. de Siqueira
5 e
, Elizabeth F. Wanner
1,6 f
and Sérgio R. de Souza
1 g
1
Federal Center of Education Technology of Minas Gerais (CEFET-MG), Brazil
2
Federal Institute of Education, Science and Technology of Minas Gerais (IFMG), Brazil
3
Federal University of Ouro Preto (UFOP), Brazil
4
Federal University of Viçosa (UFV), Brazil
5
Federal Institute of Education, Science and Technology of Brasília (IFB), Brazil
6
Aston University, U.K.
Keywords:
Mammography Unit Location-Allocation Problem, Mobile Mammography Unit Routing Problem, Facility
Location.
Abstract:
This paper addresses the Mammography Unit Location-Allocation and Mobile Mammography Unit Routing
problems. The objective is to maximize coverage of the target population and cover unmet demand with fixed
mammography units by using mobile units. It is proposed a sequential solution procedure for solving, in
which the first problem is solved by using an exact method, and the second one through a heuristic algorithm
with the uncovered municipalities from the first problem as input. This proposal was tested in three scenarios
from the State of Minas Gerais, Brazil. The results show that the coverage of this state can be fully met with
84 additional mobile units, considering the current location of the fixed equipment and the restriction of the
municipalities’ service to their healthcare micro-regions. However, if this requirement is not imposed, 42 units
are sufficient. Finally, by allowing the equipment to be relocated, only nine units are needed.
1 INTRODUCTION
Breast cancer is, after skin cancer, the most com-
mon type of cancer in Brazil. According to (INCA,
2023), 73,610 new cases were estimated in the coun-
try in 2023, and that disease was responsible for
18,139 deaths in 2021. In 2022, statistics presented by
(IARC, 2024), on a global scale, show that consider-
ing both sexes, breast cancer accounted for 11.5% of
the cases, second only to lung cancer. When consider-
ing only the female population, the incidence reaches
23.8%, ranking first.
a
https://orcid.org/0000-0002-5726-5910
b
https://orcid.org/0000-0002-5599-8889
c
https://orcid.org/0000-0002-7141-357X
d
https://orcid.org/0009-0001-4290-0061
e
https://orcid.org/0009-0001-2093-2783
f
https://orcid.org/0000-0001-6450-3043
g
https://orcid.org/0000-0001-7831-6740
The most effective way to detect the disease is
through mammography screening (Azevedo et al.,
2019). According to (Ramos et al., 2018), when
coverage exceeds 70% of the target group, mortal-
ity among women aged 50 years and older is reduced
by 20% to 30%. However, mammography cover-
age rates vary significantly from one country to an-
other, from one city to another, or even within re-
gions of the same state. As an example, (Lages et al.,
2012) described that, between 2010 and 2011, the
access of women to screenings in Teresina, State of
Piauí, Brazil, was higher than in cities like Rio de
Janeiro, Recife, João Pessoa, and other municipali-
ties in Brazil. Teresina’s coverage also surpassed that
of Turkey, where 56% of individuals are unaware of
the exam, Mexico, where the coverage during this bi-
ennium was only 14.8%, and Australia, where 49%
of women aged 40 to 49 have never undergone the
exam. However, the study shows that, despite having
L. de Assis, R. S., A. de Campos, M. V., Souza, M. J. F., Souza, M. A. L., C. de Siqueira, E., Wanner, E. F. and R. de Souza, S.
A Solution Procedure for Fixed Mammography Unit Location-Allocation and Mobile Mammography Unit Routing Problems.
DOI: 10.5220/0013293700003929
In Proceedings of the 27th International Conference on Enterprise Information Systems (ICEIS 2025) - Volume 1, pages 523-533
ISBN: 978-989-758-749-8; ISSN: 2184-4992
Copyright © 2025 by Paper published under CC license (CC BY-NC-ND 4.0)
523

a higher coverage than many municipalities in Brazil
and worldwide, the coverage was only 62.1%, below
the 70% suggested by (Ramos et al., 2018). This work
also shows that more than half of the equipment in the
Northeast region is installed in the capitals. Thus, the
poor distribution of equipment is one of the reasons
the coverage does not reach the desired percentage.
This fact is also demonstrated by (Corrêa et al., 2011),
as the authors state that the poor distribution of mam-
mography units directly impacts the low production
of the equipment. In addition to inadequate distribu-
tion, (Corrêa et al., 2011) point out that, for women
who need to travel, the distance traveled is one of
the factors influencing their decision to undergo the
exam. The authors also state that, in 2015, the Min-
istry of Health established a maximum distance of 60
km to be traveled to perform the exam.
The Mammography Unit Location-Allocation
Problem (MULAP) is proposed in light of these is-
sues, such as the inefficient distribution of the mam-
mography units, the significant impact of women’s
travel on coverage rates, and the importance of this
exam for successful disease treatment. The MULAP
objective is to improve the location of mammography
units and, thus, increase the coverage rate of mam-
mography exams. (Souza et al., 2019) used two math-
ematical formulations to solve MULAP. In one, full
demand fulfillment for municipalities is considered,
while the second formulation allows for partial de-
mand fulfillment. In the conducted experiments, sce-
narios were considered where the existing mammog-
raphy units were kept in their current locations and
scenarios where there was the possibility of relocat-
ing those equipment. The results showed that relo-
cating the equipment would result in greater coverage
than that presented by the State Health Department of
Rondônia, Brazil. (Sá et al., 2019), using the formu-
lation of (Souza et al., 2019), addressed MULAP in
an instance of the State of Espírito Santo, considering
two scenarios: one keeping the existing location and
the other allowing the relocation of the mammogra-
phy units. The authors showed that the existing loca-
tion met half of the state’s demand, using 63.1% of
the capacity of the mammography units, while relo-
cating the equipment would allow for 83.5% demand
coverage, increasing the equipment usage to 99.9%.
(Souza et al., 2020) used the same model and devel-
oped a Variable Neighborhood Search (VNS) algo-
rithm to solve an instance based on data from the State
of Minas Gerais. In this case, the results obtained,
both from the mathematical formulation and the pro-
posed algorithm, showed superior coverage compared
to the existing location of the mammography units.
(de Campos et al., 2020) addressed MULAP using a
Simulated Annealing algorithm. The algorithm was
applied to instances from the state of Minas Gerais,
considering partial demand fulfillment. In this way,
a municipality is covered even if its demand is not
fully met. Additionally, that work considered the ac-
quisition of new equipment. The results indicated
that, even under these conditions, not all municipal-
ities had their demands fully met. Other studies in the
literature, such as (de Assis et al., 2022), (de Cam-
pos et al., 2022), and (de Campos et al., 2024), also
address MULAP. In all these works, full demand cov-
erage is not achieved due to factors such as the max-
imum distance constraint between the demand point
and the equipment’s host municipality and/or the ab-
sence of hospital infrastructure.
(Jewett et al., 2018) showed that the demand for
the screenings is inversely proportional to the dis-
tance traveled to perform it. In this sense, (De Mil
et al., 2019) suggested using Mobile Mammography
Units (MMU) to serve women living in remote areas
where the installation of a fixed unit is unfeasible.
(Rosa et al., 2020) proposed a constructive heuristic
algorithm to address the Mobile Mammography Unit
Routing Problem (MMURP). In (Rosa et al., 2020),
MMUs were routed to serve 444 locations, aiming to
maximize the coverage of the demand and minimize
the total distance traveled. In (Rosa et al., 2021), the
authors presented an Iterated Greedy Search (IGS) al-
gorithm to route 56 MMUs, departing from two de-
pots, to serve 579 municipalities.
The aforementioned studies addressed MULAP
and MMURP separately. In the present work, the ob-
jective is to solve them through a sequential proce-
dure. Initially, it is proposed to generate a solution
for MULAP and then, based on the municipalities not
served or partially served in this solution, generate a
solution via MMURP. To solve these two problems,
the formulation by (Souza et al., 2019) will be ap-
plied for the solution of MULAP, and based on the re-
sults obtained, a constructive heuristic algorithm will
be applied to route the MMUs to meet the remaining
demand from MULAP. This solution procedure is ap-
plied to a case study addressing three scenarios in the
State of Minas Gerais. The first scenario considers the
freedom to relocate fixed mammography equipment.
The second scenario considers the current location of
fixed equipment and does not restrict the service of
municipalities to their health micro-regions. Finally,
the third scenario considers the current location of
fixed equipment and restricts the service of munici-
palities to their health micro-regions.
The remainder of this work is organized as fol-
lows. Section 2 describes the problems addressed.
Section 3 presents the application scenarios for MU-
ICEIS 2025 - 27th International Conference on Enterprise Information Systems
524

LAP, as well as the main proposed changes in the
mathematical formulation to meet the characteristics
of these scenarios. Section 4 presents the construc-
tive algorithm for MMURP. Finally, Sections 5 and 6
present the results achieved, conclusions, and indica-
tions for future work.
2 PROBLEM
CHARACTERIZATION
This section is organized as follows. Subsection 2.1
presents the mathematical formulation of the MULAP
problem used by (Souza et al., 2019) and an example
illustrating this problem. In Subsection 2.2, the char-
acteristics of the MMURP are presented along with
an example.
2.1 Mammography Unit Location and
Allocation Problem – MULAP
Table 1 describes the notation, parameters, and auxil-
iary and decision variables of the mathematical for-
mulation for MULAP introduced by (Souza et al.,
2020), which is given by:
max
∑
i∈N
∑
j∈S
i
dem
j
· x
i j
(1)
s. a
∑
i∈S
j
x
i j
≤ 1, ∀ j ∈ N (2)
∑
i∈N
y
i
= p (3)
∑
j∈S
i
dem
j
· x
i j
≤ cap · y
i
, ∀i ∈ N (4)
z
i
≥
y
i
p
, ∀i ∈ N (5)
z
i
≥ x
i j
, ∀i, j ∈ N (6)
x
ii
= z
i
, ∀i ∈ N (7)
y
i
= 0, ∀i ∈ N | Infra
i
= 0 (8)
x
i j
∈ [0, 1], ∀ i, j ∈ N (9)
y
i
∈ Z
+
, ∀ i ∈ N (10)
z
i
∈ {0, 1}, ∀ i ∈ N (11)
The objective function (1) aims to maximize
the coverage of the mammography demand. Con-
straints (2) ensure that the demand of each munici-
pality j, if covered, is partially met by mammography
units installed in municipalities within R km from it.
Constraint (3) ensures that all p available units are
installed. Constraints (4) ensure that the annual ca-
pacity of each mammography unit is respected. Con-
straints (5) force z
i
to equal 1 if at least one unit is
installed in municipality i. Constraints (6) ensure that
a municipality j’s demand can only be covered by a
municipality i if there is a unit in that municipality.
Constraints (7) state that if a municipality i has mam-
mography units, all its own demand must be covered
by its own units. Constraints (8) indicate that only
municipalities with hospital infrastructure can host
mammography units. Finally, constraints (9), (10),
and (11) define the domain of the decision variables.
Figure 1 shows an example of the MULAP with
10 municipalities (A, B, C, D, E, F, G, H, I, J),
each with a demand dem for mammography screen-
ings. To meet this demand, there are 3 mammography
units (M1, M2, M3) with a fictitious capacity of 1000
screenings annually, which can be installed in munic-
ipalities A, E, and H, as they have the infrastructure
to host them. The lines connecting the municipali-
ties indicate the distances between them. Note that
mammography units M1 and M2 are installed in mu-
nicipality A, and M3 is installed in H. Unit M1 fully
meets the demand of municipality A, and the surplus
covers the demand of municipalities B, D, and part of
municipality C. Unit M2 covers the unmet demand of
municipality C. Unit M3 fully meets the demand of
municipalities H, I, and J, and partially meets the de-
mand of municipality F. Although unit M2 has a non-
used capacity of 950 mammography screenings, these
screenings cannot meet the demand of municipality E,
as it is located 90 km from municipality A, violating
the maximum travel distance R of 60 km. Thus, the
location of the mammography units in this scenario
allows coverage of 2,050 women, with an unmet de-
mand of 950 mammography screenings.
2.2 Mobile Mammography Unit
Routing Problem – MMURP
Let there be a set of host municipalities, which are
the starting points for a set of Mobile Mammography
Units (MMUs), and a set of municipalities with a de-
mand for mammography screenings. MMURP, intro-
duced by (Rosa et al., 2020), consists of determining
the routes of the MMUs to meet all the demands for
mammography screenings while minimizing the total
distance traveled.
The approach presented here considers that the
starting point for each MMU is the reference munic-
ipality of each health macro-region, thus defining a
multi-depot vehicle routing problem. In addition, the
MMURP is treated based on the variant described by
the Open Vehicle Routing Problem (OVRP), as pre-
sented in (Li et al., 2007), considering that the return
of the MMU to the starting point should not be in-
cluded. A maximum distance restriction of D
max
km
A Solution Procedure for Fixed Mammography Unit Location-Allocation and Mobile Mammography Unit Routing Problems
525
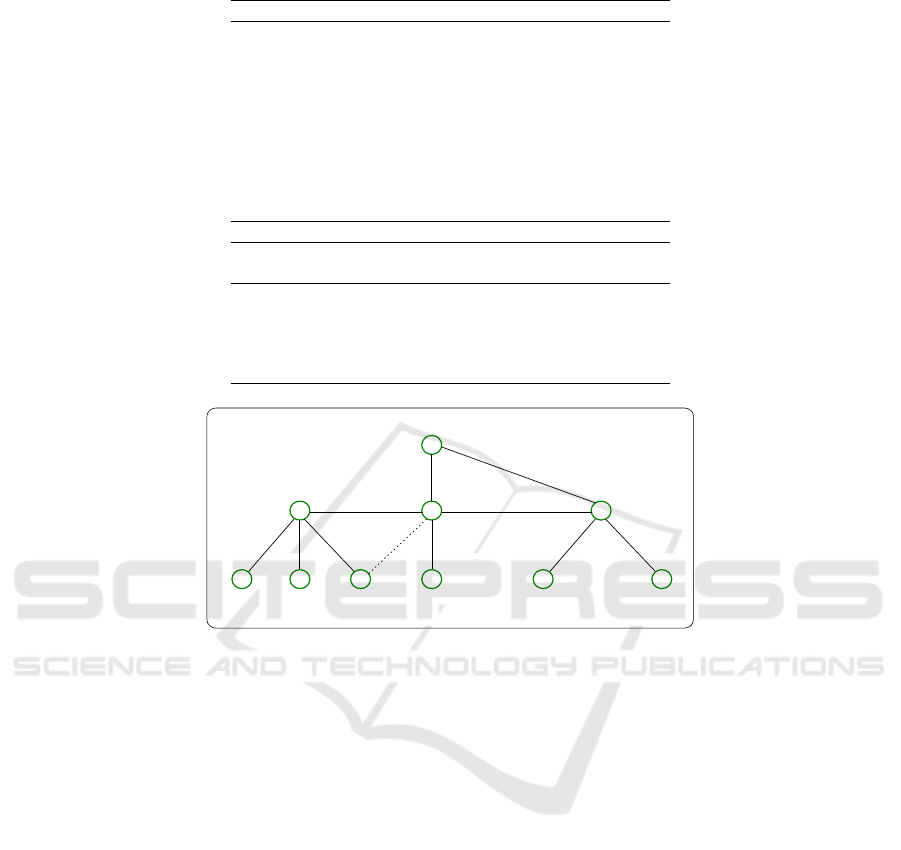
Table 1: Parameters and decision variables.
Parameters
N set of municipalities
d
i j
distance from municipality i to municipality j
dem
j
demand for screenings from municipality j
cap annual capacity of a mammography unit
p number of mammography units to be located
R maximum distance a woman can travel
Infra
i
binary parameter that equals 1 if municipality i has
hospital infrastructure, 0 otherwise
S
i
set of municipalities that are at most R km from municipality i,
that is, S
i
= { j ∈ N | d
i j
≤ R and d
ji
≤ R}
Auxiliary variables
z
i
binary variable equal to 1 if a mammography unit is installed in
municipality i and 0 otherwise
x
i j
Continuous variable in the range [0, 1] that indicates the fraction
of the demand of municipality j met by mammography units
installed in municipality i.
y
i
Integer variable representing the number of mammography units
installed in municipality i
F
G
EA
90 km
B C D
59 km
15 km
48 km
57 km
12 km
H
I
J
45 km
37 km
75 km
30 km
42 km
dem: 150
dem: 600
M1: 150
dem: 150
dem: 150
M1: 100
M1: 150
M2: 50
M1: 600
M1
M2
dem: 200
dem: 150 dem: 150
M3: 150 M3: 150
M3: 100
dem: 700
dem: 600
dem: 150
M3: 600
M3
Figure 1: Example of location-allocation of mammography units.
between one municipality and another on the route is
also defined.
For example, considering an MMU speed of 60
km/h, if D
max
= 180 km and the trip starts in the
morning, it is possible to carry out mammography
screenings in the destination municipality on the same
day. This maximum distance restriction does not ap-
ply to MMUs leaving their departure points. Finally,
a capacity of 4 mammography screenings per hour in
each MMU is also considered.
To illustrate the MMURP, consider Figure 2,
which presents the situation in the State of Rondônia
after applying the MULAP. The municipalities shown
in white color were fully covered by fixed mammog-
raphy units, while those in green color had their de-
mand only partially covered. The set of municipalities
{A, B, C, D, E, F, G} are those whose demand was
not fully met by MULAP, and the set {1, 2, 3, 4} in-
cludes the municipalities with hospital infrastructure.
In this case, the problem is to determine the number of
MMUs needed to serve the demand of municipalities
A, B, C, D, E, F, and G, starting from municipalities
1, 2, 3, and/or 4 and covering the shortest possible
distance.
In the scenario represented in Figure 2, detailed in
Figure 3, three new routes are established to cover the
demand of municipalities that were not fully served
by the fixed mammography units, identified in green.
There is one route departing from Municipality 1,
covering Municipalities A, B, and C; another route
departing from Municipality 2 and covering Munic-
ipalities D and E; and, finally, a third route starting
from Municipality 3 and covering Municipalities F
and G.
To illustrate the time required to complete each
route, consider in Figure 3 that each MMU is capa-
ble of performing 6758 mammography screenings an-
nually. Furthermore, assume that the number above
the arrow between the base of an MMU and a mu-
nicipality, or between two municipalities, represents
the travel time. Also consider that the first number
in brackets, above each municipality, represents the
setup time, and the second number indicates the re-
quired time to perform all the screenings in the mu-
nicipality under consideration. Regarding the setup
time, a value of zero indicates that there is no setup
time, a situation that occurs when the MMU arrives at
the end of the day.
ICEIS 2025 - 27th International Conference on Enterprise Information Systems
526
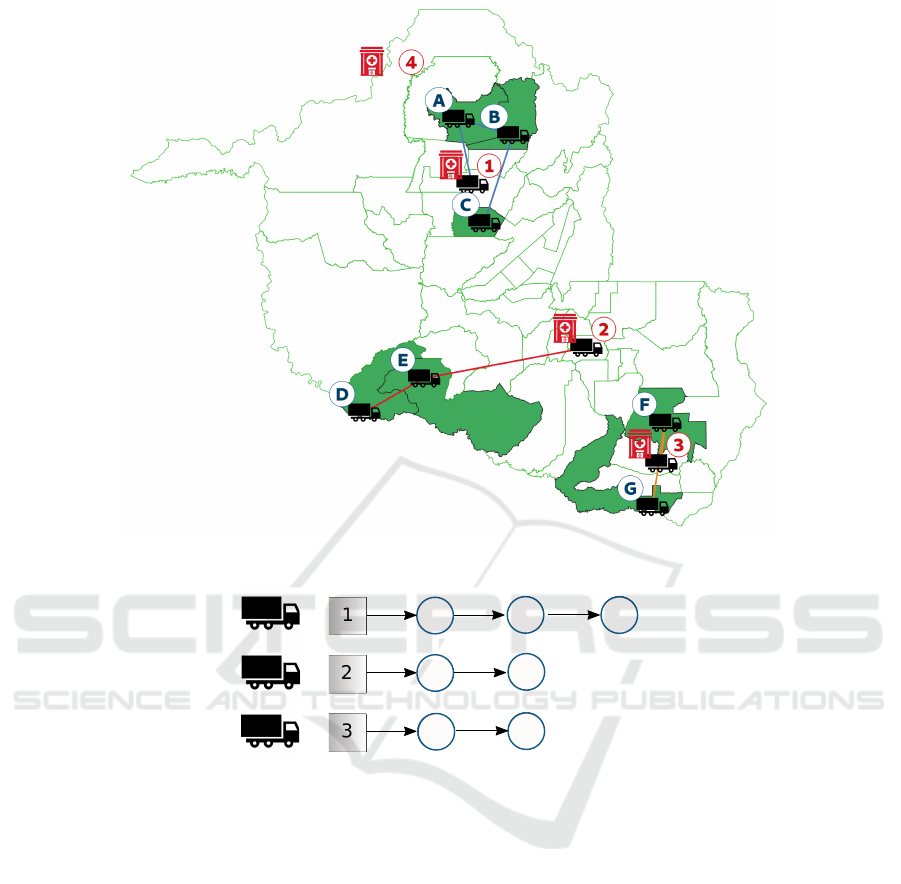
Figure 2: Example of MMU routing: situation in the State of Rondônia after applying the MULAP.
A
B
C
D
E
F
G
30
60
20
50
30
30 60
[60][2220]
[0][2280]
[60][2400]
[60][3000]
[0][1500]
[60][1000]
[60][2000]
Figure 3: Routing relative to Figure 2.
3 A SOLUTION FOR MULAP
The main works in the literature for solving MULAP
use the formulation proposed by (Souza et al., 2019).
The current work also uses that formulation. In this
article, three scenarios are considered. Scenario 1 al-
lows the relocation of mammography units, and the
assignment of exams is made without considering the
health micro-regions. In Scenario 2, the current lo-
cation of the equipment is kept; however, the assign-
ment of exams does not observe the micro-regions.
Scenario 3, in turn, maintains the current location of
the equipment and respects the health micro-region of
the municipalities.
To meet the requirements of Scenarios 2 and 3
and prevent the mammography units from being relo-
cated, the set of constraints (12) is added, as follows:
y
i
≥ pe
i
∀i ∈ N. (12)
where pe
i
represents the number of mammography
units installed in municipality i. To meet Scenario 3, it
is also necessary to restrict the service of a municipal-
ity to the health micro-region it belongs to. Thus, it is
necessary to update S
i
to include only the municipal-
ities whose distances to municipality i are less than
or equal to R km and are in the same health micro-
region. In this case:
S
i
= { j ∈ N | d
i j
≤ R and d
ji
≤ R and reg
i
= reg
j
}.
4 PROPOSED ALGORITHM FOR
MMURP SOLUTION
The solution for MMURP proposed in this work is
based on the construction phase of the GRASP meta-
heuristic, where a restricted candidate list with the α
A Solution Procedure for Fixed Mammography Unit Location-Allocation and Mobile Mammography Unit Routing Problems
527

best candidates is generated. At each iteration, an el-
ement is randomly selected from this restricted list of
the best candidates and inserted into the solution. The
method developed is described by Algorithms 1 and 2.
Algorithm 1: buildMMURPSolution (CL, α).
Data: CL: List of cities, α: Parameter to control the greediness
Result: s: Solution generated
1 s ←
/
0 ; // Solution to be generated
2 j ← 1 ; // Route counter
3 R
1
←
/
0 ; // Initial route
4 newRoute ← T RUE
5 while CL ̸=
/
0 do
6 if newRoute then
7 StartNewRoute(j, R, s, CL, newRoute) ; // Starts a
new route.
8 else
9 RCL ← generateRestrictedCandidateList(CL, α)
10 i ← Randomly chosen city from RCL
11 R
j
← Add city i to route R
j
12 Update the time of route R
j
13 Update the demand of city i
14 if Time of R
j
reached the limit then
15 s ← Add route R
j
to the solution s
16 j ← j + 1
17 newRoute ← T RUE
18 else
19 newRoute ← FALSE
20 end
21 if i has no demand left then
22 CL ← CL \ {i}
23 end
24 end
25 end
26 return s
Lines 1 to 4 of Algorithm 1 initialize the method
variables. Lines 5-25 construct the solution by insert-
ing a municipality at each iteration while there are still
municipalities in the Candidate List (CL) to be served.
Line 7 creates a new route to be added to the solu-
tion when necessary, as described by Algorithm 2. In
lines 8-24, cities are added to the current route ac-
cording to the number of exams to be performed. In
line 9, a Restricted Candidate List (RCL) is generated
with the α municipalities from CL closest to the last
city added to the route. In line 10, a city is randomly
selected from the RCL, and in lines 11-13, this city is
added to the route, updating the route’s time and the
demand of this city. The route time update involves
calculating the time spent attending to the municipal-
ity’s demand, including travel and preparation time.
The demand update determines how many screenings
can be performed within one year. In lines 14-20, it
is verified whether the MMU’s capacity (route time)
is exhausted after adding a new municipality to the
route. If so, the route is added to solution s, and the
newRoute variable is set to TRUE. Finally, in lines 21-
Algorithm 2: StartNewRoute( j, R, s, CL, newRoute).
Data: CL: List of municipalities, j: Route counter, R: Routes, s:
Solution, newRoute: Indicates if it’s a new route
Result: newRoute: Returns whether a new route should be
started
1 i ← Municipality with the highest demand in CL
2 D ← closest depot to municipality i
3 if D ∈ CL then
4 R
j
← Add depot D to route R
j
5 Update the time of R
j
6 Update the demand of D
7 if Time of R
j
reached the limit then
8 s ← Add route R
j
to the solution s
9 j ← j + 1
10 newRoute ← T RUE
11 if D has no demand left then
12 CL ← CL \ {D}
13 end
14 else
15 R
j
← Add city i to route R
j
16 Update the time of R
j
17 Update the demand of i
18 if Time of R
j
reached the limit then
19 s ← Add route R
j
to the solution s
20 j ← j + 1
21 newRoute ← T RUE
22 else
23 newRoute ← FALSE
24 end
25 if i has unmet demand then
26 CL ← CL \ {i}
27 end
28 end
29 else
30 R
j
← Add depot D to route R
j
31 R
j
← Add city i to route R
j
32 Update the time of R
j
33 Update the demand of i
34 if Time of R
j
reached the limit then
35 s ← Add route R
j
to the solution s
36 j ← j + 1 newRoute ← T RUE
37 else
38 newRoute ← FALSE
39 end
40 if i has no demand left then
41 CL ← CL \ {i}
42 end
43 end
44 return newRoute
23, the selected municipality is removed from CL if
its demand is fully met.
ICEIS 2025 - 27th International Conference on Enterprise Information Systems
528

Algorithm 2, in turn, describes the procedure for
opening new routes. In lines 1 and 2, the municipal-
ity i with the highest demand is used to determine the
depot for the new route, which is the closest to this
municipality i. The steps described in lines 3 to 43 of
Algorithm 2 are very similar to the steps previously
described in Algorithm 1. These lines insert cities
into the route, update times and demands, and, if nec-
essary, close the route.
5 RESULTS
The mathematical formulation was executed using
the CPLEX solver, version 20.1. The constructive
MMURP algorithm, in turn, was implemented in C++.
The experiments were conducted on a DELL Inspiron
153511 laptop, with an Intel Core i7-1165G7 proces-
sor, 16 GB of RAM, and Ubuntu 20.04 Operating
System.
The instances used in this work utilize population
data from the 2022 Brazilian Census. The group of
candidate municipalities to host the equipment con-
sists of municipalities that currently have hospitals
and/or host mammography units in the existing con-
figuration. The number of available mammography
units was obtained from the DATASUS system in De-
cember 2023.
The experiments considered three distinct scenar-
ios. The first scenario assumes there is freedom to re-
locate mammography units. The second scenario con-
siders that mammography units must remain at their
current locations, serving any municipalities located
up to 60 km away. The third scenario differs from the
previous one in terms of target population coverage;
in this scenario, coverage is restricted to municipali-
ties within the same health micro-region.
For the constructive MMURP algorithm, in-
stances were formed using data from municipalities
not covered by the MULAP solution. Additionally,
these instances consider the reference municipalities
for each health macro-region in the State as depots.
Furthermore, for each scenario, two values for the
maximum distance traveled were tested: 180 km, as
proposed by (Rosa et al., 2020), and 545 km, to eval-
uate the consequence of relaxing this maximum dis-
tance traveled.
Table 2 reports the results obtained from apply-
ing the mathematical formulation to the MULAP. The
first and second columns consist of the identifier and
description of each analyzed scenario, respectively.
The third and fourth columns show, respectively, the
number and rate of exams covered by the MULAP.
Finally, the fifth and sixth columns show, in this or-
der, the number and rate of demand not covered by
the MULAP.
As can be observed in Table 2, as the restrictions
in the MULAP increase, the demand coverage rate de-
creases. In the first scenario, the coverage approaches
totality, considering the freedom to relocate the equip-
ment. In the second and third scenarios, while pre-
serving the current mammography unit locations, the
coverage rate decreases substantially. By restricting
the service of a municipality to its health micro-region
(third scenario), this rate falls to 72.08%. These re-
sults show that the current location-allocation of the
mammography units in the State of Minas Gerais is
inefficient, and the configuration of the health micro-
regions in the state further limits the coverage of the
demand.
Table 3 reports the results obtained by applying
the constructive algorithm to the MMURP. The first
column presents the ID of the scenario analyzed in the
MULAP and the maximum distance traveled between
two cities in MMURP; the second column reports the
number of MMUs required to meet the remaining de-
mand for each of these scenarios; the third column
displays the total distance traveled by the MMUs; the
fourth column presents the total demand covered by
the MMUs, and, finally, the fifth and sixth columns
show, respectively, the average occupancy and the oc-
cupancy rate of the MMUs.
As can be observed in Table 3, the remaining de-
mand from the MULAP in Scenario 1 is fully met
by 9 MMUs, which travel 2164 km. The remaining
demand in the second Scenario requires 42 MMUs,
covering a total of 14937 km to perform 182754 ex-
ams, while the remaining demand in the third Sce-
nario is covered by 84 MMUs, which travel a total of
30578 km, serving 484987 patients. Considering that
an MMU can serve 6758 patients, Scenario 3 made
the best use of its capacity, achieving an average uti-
lization of 85.42%. On the other hand, in Scenario 1,
due to the geographical locations of the served mu-
nicipalities and the maximum distance restriction im-
posed on the MMU between cities, the average uti-
lization reached a rate of 17.15%.
Illustrating a solution for the MULAP, Table 4
presents the routes of the MMUs required to meet
the remaining demand in scenario blue1. The first
column identifies the route of each MMU described
in the second column, while the third and fourth
columns report, in this order, the distance traveled by
each and the demand covered by them.
As can be observed in Table 4, to meet the remain-
ing demand from the MULAP in Scenario 1, Algo-
rithm 1 generated a solution with 9 MMUs needed to
cover the target population. These 9 MMUs cover a
A Solution Procedure for Fixed Mammography Unit Location-Allocation and Mobile Mammography Unit Routing Problems
529

Table 2: Characteristics of the MULAP solution for the State of Minas Gerais.
ID Scenario Demand Covered Coverage Rate Remaining Demand Uncovered Rate
1 Freedom to relocate and allocate 1,728,037 99.40% 10,435 0.60%
2 Maintains current location, changes
allocation
1,555,710 89.49% 182,754 10.51%
3 Maintains current location, imposes
health micro-region
1,253,482 72.08% 484,987 27.92%
Table 3: Characteristics of the MMURP solution of the State of Minas Gerais.
Scenario # Routes Total Total Average MMU
Distance Traveled Demand Covered MMU Occupation Occupation Rate
1 (180 km) 9 2,164 10,435 1,159 17.15%
2 (180 km) 42 14,937 182,754 4,351 64.38%
3 (180 km) 84 30,578 484,987 5,773 85.42%
1 (545 km) 2 3,339 10,435 5,217.5 77.20%
2 (545 km) 29 17,020 182,754 6,301.9 93.25%
3 (545 km) 74 32,392 484,987 6,553.9 96.98%
Table 4: Detailed solution of the MMURP in Scenario 1 (180 km).
ID Route Distance (km) Coverage
1 Patos de Minas → Brasilândia de Minas → Dom Bosco → Natalândia 364 1,549
2 Diamantina → Buenópolis → Joaquim Felício → Augusto de Lima → Santo
Hipólito → Monjolos → Santana de Pirapama → Santana do Riacho
429 3,025
3 Teófilo Otoni → Novo Oriente de Minas 71 728
4 Teófilo Otoni → Mata Verde 345 631
5 Montes Claros → Claro dos Poções → Jequitaí → Francisco Dumont → Ib-
iaí → Santa Fé de Minas
362 2,279
6 Patos de Minas → São Gonçalo do Abaeté → Varjão de Minas 139 1,020
7 Governador Valadares → São Geraldo da Piedade → São José da Safira 167 585
8 Montes Claros → Itacambira 99 313
9 Montes Claros → Padre Carvalho 188 305
Total 2,164 10,435
Table 5: Detailed solution of the MMURP in Scenario 1 (545 km).
ID Route Distance (km) Coverage
1 Patos de Minas → Brasilândia de Minas → Dom Bosco → Natalândia → Santa
Fé de Minas → Ibiaí → Jequitaí → Francisco Dumont → Claro dos
Poções → Itacambira → Joaquim Felício → Buenópolis → Augusto de
Lima → Santo Hipólito → Monjolos → Santana de Pirapama
1,378 6,657
2 Teófilo Otoni → Novo Oriente de Minas → São José da Safira → São Geraldo
da Piedade → Santana do Riacho → Santana de Pirapama → São Gonçalo do
Abaeté → Varjão de Minas → Padre Carvalho → Mata Verde
1,961 3,778
Total 4,158 10,435
total of 2164 km and serve 10435 patients. The routes
described in Table 4 are graphically presented in Fig-
ure 4. It can be observed that the geographical distri-
bution of the municipalities required a greater number
of MMUs to fully meet the mammography demand.
Table 5, in turn, shows that the flexibility (from 180
to 545 km) of the maximum distance traveled between
two cities reduces the number of necessary routes and,
consequently, increases the occupancy rate of MMUs.
Figure 5 exhibits the routes described in Table 5.
6 CONCLUSIONS
This work addressed the MULAP and MMURP us-
ing a sequential solution procedure. The MULAP
was solved using a mathematical formulation from
the literature and applied to three different scenarios.
In Scenario 1, the possibility of relocating equipment
was considered; in Scenarios 2 and 3, the current lo-
cation of the equipment was kept, and, by turn, in sce-
nario 3, the service of a municipality was restricted to
its health micro-region. The MMURP was addressed
by a constructive algorithm applied to the remaining
ICEIS 2025 - 27th International Conference on Enterprise Information Systems
530
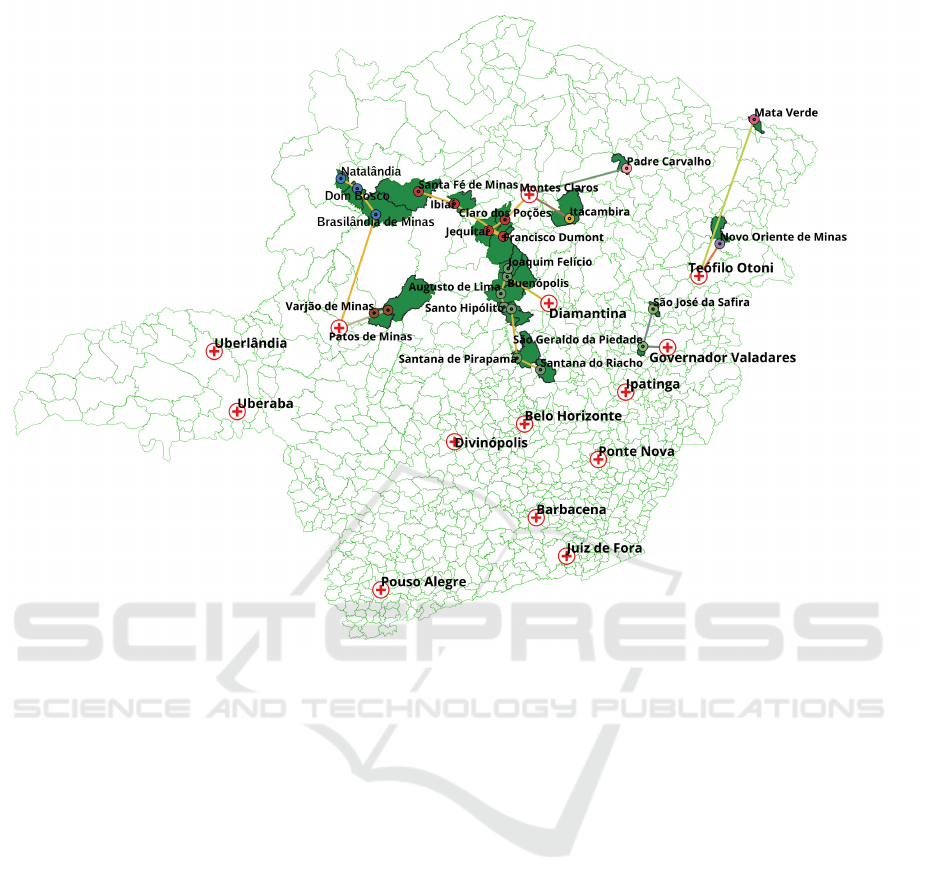
Figure 4: MMURP Routes - Instance MMURP-MG-Flexible.
demand resulting from the MULAP solution.
Among the three scenarios analyzed in the MU-
LAP solution, the result obtained in Scenario 3 had
the lowest coverage, 72.08%, followed by Scenario 2,
with 89.49% of the demand met, and Scenario 1 with
99.40% coverage. These results were expected, once
Scenario 3 represents the situation closest to reality.
In fact, in this scenario, the current location of the
existing equipment is considered, and the obligation
for the target population to be covered only within the
health micro-region to which each municipality be-
longs is imposed. Scenario 2 is somewhat more flexi-
ble since it allows services to be provided outside the
health micro-regions. The result in Scenario 1 shows
that, with the current mammography units, it would
be possible to meet almost all the demand in the State
of Minas Gerais.
Regarding the MMURP, the solution in Scenario 3
was also the worst, requiring 84 MMUs. The solution
in Scenario 1 was the best, requiring only 9 MMUs,
with most of these MMUs making short routes and
serving a small set of municipalities. Many of these
routes depart from the same home municipality to
a single destination municipality due to the distance
limitation imposed on MMUs, which cannot travel
more than 180 km from one municipality to another.
Given this result, the MMURP solution in Scenario 1
could be improved by allowing the distance traveled
between municipalities to be greater. Finally, these re-
sults from the MULAP and MMURP show that when
mammography units are not well-located, coverage is
lower, consequently requiring more MMUs to meet
the demand from uncovered municipalities.
For future work, it is suggested to develop refine-
ment heuristics to reduce the number of MMUs and
make better use of each MMU’s capacity.
ACKNOWLEDGMENTS
The authors register their thanks to Centro Federal
de Educação Tecnológica de Minas Gerais (CEFET-
MG), Universidade Federal de Ouro Preto (UFOP),
Universidade Federal de Viçosa (UFV), Instituto Fed-
eral de Educação, Ciência e Tecnologia de Mi-
nas Gerais (IFMG), Aston University, Instituto Fed-
eral de Educação, Ciência e Tecnologia de Brasília
(IFB), and to the Brazilian agencies Conselho Na-
A Solution Procedure for Fixed Mammography Unit Location-Allocation and Mobile Mammography Unit Routing Problems
531
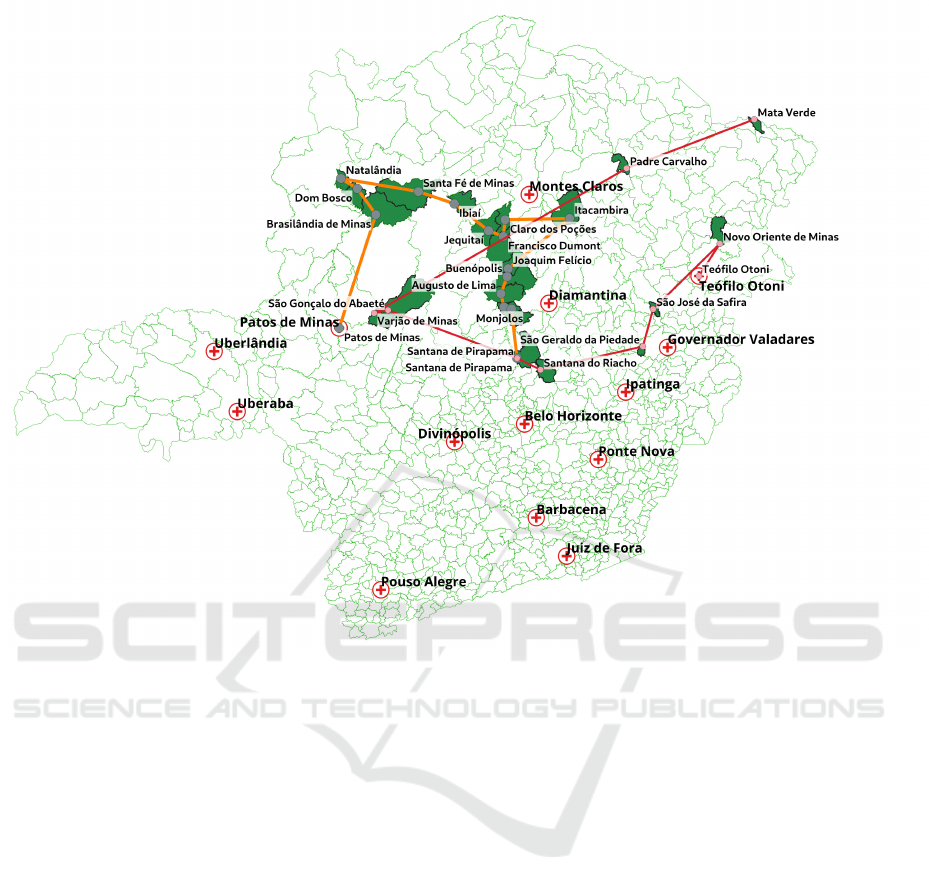
Figure 5: MMURP Routes - Instance MMURP-MG-Flexible.
cional de Desenvolvimento Científico e Tecnológico
(CNPq, grants 428817/2018-1, and 311074/2023-5),
Fundação de Amparo à Pesquisa do Estado de Mi-
nas Gerais (FAPEMIG, grant PPM-CEX 676/17),
and Coordenação de Aperfeiçoamento de Pessoal de
Nível Superior (CAPES, finance code 001 and grant
88881.934148/2024-01) for supporting the develop-
ment of this work.
REFERENCES
Azevedo, A., Ramos, A. L., Gonçalves, A. C. V., Souza, C.
F. d., Batista, G. S., Silva, R. B. V., and Loyola, E. A.
C. d. (2019). O conhecimento de mulheres acerca do
rastreamento do câncer de mama e suas implicações.
Revista de Medicina, 98(3):187–193.
Corrêa, R. d. S., Freitas-Júnior, R., Peixoto, J. E., Ro-
drigues, D. C. N., Lemos, M. E. d. F., Marins, L. A. P.,
and Silveira, É. A. d. (2011). Estimativas da cobertura
mamográfica no estado de Goiás, brasil. Caderno de
Saúde Pública, 27(9):1757–1767.
de Assis, R. S. L., de Campos, M. V. A., Souza, M. J. F.,
Silva, M. A. L., de Siqueira, E. C., and de Souza,
S. R. (2022). Um algoritmo variable neighborhood
search para o Problema de Localização de Mamó-
grafos com atendimento parcial. In Anais do LIV Sim-
pósio Brasileiro de Pesquisa Operacional, volume 54,
page 152748, Juiz de Fora, Brasil. Galoá: Campinas.
de Campos, M., Moreira de Sá, M., Rosa, P., Penna, P.,
de Souza, S., and Souza, M. (2020). A mixed lin-
ear integer programming formulation and a simulated
annealing algorithm for the mammography unit loca-
tion problem. In Proceedings of the 22nd Interna-
tional Conference on Enterprise Information Systems.
SCITEPRESS - Science and Technology Publications.
de Campos, M. V. A., de Assis, R. d. S. L., Souza, M. J. F.,
de Siqueira, E. C., Silva, M. A. L., and de Souza, S. R.
(2024). Multi-objective mammography unit location–
allocation problem: A case study. Oper. Res. Health
Care, 41:100430.
de Campos, M. V. A., de Assis, R. S. L., Souza, M. J. F.,
Silva, M. A. L., de Siqueira, E. C., and de Souza, S. R.
(2022). Algoritmos NSGA-II e SPEA2 para o prob-
lema multiobjetivo de localização de mamógrafos. In
Anais do LIV Simpósio Brasileiro de Pesquisa Opera-
cional, volume 54, page 152742, Juiz de Fora, Brasil.
Galoá: Campinas.
De Mil, R., Guillaume, E., Launay, L., Guittet, L., Dejardin,
O., Bouvier, V., Notari, A., Launoy, G., and Berchi,
C. (2019). Cost-effectiveness analysis of a mobile
mammography unit for breast cancer screening to re-
ICEIS 2025 - 27th International Conference on Enterprise Information Systems
532

duce geographic and social health inequalities. Value
Health, 22(10):1111–1118.
IARC (2024). Cancer today. International Agency for
Research on Cancer (IARC). https://bit.ly/3XfzYgF
Acessado em 26/04/2024.
INCA (2023). Câncer de mama : vamos falar sobre isso?
Instituto Nacional do Cancer. https://bit.ly/4bXlmqe.
Acesso em 26/04/2023.
Jewett, P. I., Gangnon, R. E., Elkin, E., Hampton, J. M., Ja-
cobs, E. A., Malecki, K., LaGro, J., Newcomb, P. A.,
and Trentham-Dietz, A. (2018). Geographic access to
mammography facilities and frequency of mammog-
raphy screening. Ann. Epidemiol., 28(2):65–71.e2.
Lages, R. B., Oliveira, G. d. P., Simeão Filho, V. M.,
Nogueira, F. M., Teles, J. B. M., and Vieira, S. C.
(2012). Desigualdades associadas à não realização de
mamografia na zona urbana de Teresina-Piauí-Brasil,
2010-2011. Rev. Bras. Epidemiol., 15(4):737–747.
Li, F., Golden, B., and Wasil, E. (2007). The open vehicle
routing problem: Algorithms, large-scale test prob-
lems, and computational results. Computers & Op-
erations Research, 34(10):2918–2930.
Ramos, A. C. V., Alves, L. S., Berra, T. Z., Popolin,
M. P., Arcoverde, M. A. M., Campoy, L. T., Martoreli
Júnior, J. F., Lapão, L. V., Palha, P. F., and Arcêncio,
R. A. (2018). Estratégia saúde da família, saúde su-
plementar e desigualdade no acesso à mamografia no
Brasil. Rev Panam Salud Publica.
Rosa, M. P., Sá, V. S. M., Paiva, J. N. M. Penna, P. H. V.,
and Souza, M. J. F. (2020). Análise da localização
de mamógrafos em Minas Gerais. In LII Simpósio
Brasileiro de Pesquisa Operacional, João Pessoa –
Brasil.
Rosa, O. A. S., ROSA, P. M., PAIVA, J. N. M., Penna,
P. H. V., and Souza, M. J. (2021). Um algoritmo
heurístico baseado em iterated greedy para o prob-
lema de roteamento de unidades móveis de mamo-
grafia. In LIII Simp. Bras. de Pesquisa Operacional
(SBPO 2021), João Pessoa – Brasil.
Sá, M. V. S. M., Rosa, P. M., Paiva, J. N. M., SOUZA,
M. J. F., and PENNA, P. H. V. (2019). Localização
de mamógrafos: Um estudo de caso do Estado do Es-
pírito Santo. In XXVI Simpósio de Engenharia de Pro-
dução, Baurú. Universidade Estadual Paulista.
Souza, M. J. F., Penna, P. H. V., Moreira de Sá, M. V. S.,
and Rosa, P. M. (2020). A VNS-based algorithm for
the mammography unit location problem. In Variable
Neighborhood Search, Lecture notes in computer sci-
ence, pages 37–52. Springer International Publishing,
Cham.
Souza, M. J. F., Penna, P. H. V., Stilpen, M., Rosa, P. M.,
Monteiro, J. C., and Lisboa, M. R. (2019). Localiza-
ção de mamógrafos: formulações e estudo preliminar
de caso de Rondônia. In LI Simpósio Brasileiro de
Pesquisa Operacional, Limeira - Brasil.
A Solution Procedure for Fixed Mammography Unit Location-Allocation and Mobile Mammography Unit Routing Problems
533
