
A Knowledge Discovery Pipeline to Describe the High Cholesterol
Profile in Young People Using GA for Feature Selection
Daniel Rocha Franca
1a
, Caio Davi Rabelo Fiorini
2b
, Ligia Ferreira de Carvalho Gonçalves
2c
,
Marta Dias Moreira Noronha
3d
, Mark Alan Junho Song
3e
and Luis Enrique Zárate Galvez
3f
1
Bach. Computer Science, Pontifícia Universidade Católica de Minas Gerais,
Rua Claudio Manuel, Belo Horizonte, Brazil
2
Bach. Data Science and Artificial Intelligence, Pontifícia Universidade Católica de Minas Gerais,
Rua Claudio Manuel, Belo Horizonte, Brazil
3
Institute of Exact Sciences and Computer Science, Pontifícia Universidade Católica de Minas Gerais,
Rua Claudio Manuel, Belo Horizonte, Brazil
Keywords: Hypercholesterolemia, Young Population, Machine Learning, Decision Tree, Genetic Algorithm, Data
Mining, National Health Survey, Risk Factors, Data Preprocessing, Health Informatics, CAPTO.
Abstract: Understanding the risk factors associated with hypercholesterolemia in young individuals is crucial for
developing preventive strategies to combat cardiovascular diseases. This study proposes a data mining
pipeline employing machine learning techniques to profile high cholesterol in Brazilian youth aged 15 to 25,
utilizing the 2019 National Health Survey (PNS) dataset. The PNS-2019 database has 1,088 attributes
organized into 26 modules and 293,726 anonymized records. The Knowledge Discovery in Databases
(KDD) process was implemented, incorporating a novel CAPTO-based conceptual attribute selection
followed by feature selection using a Non-dominated Sorting Genetic Algorithm II (NSGA-II). A decision
tree classifier was optimized and evaluated, achieving an F1 Score of 66%, demonstrating reasonable
predictive power despite data limitations. The results highlight the significant impact of dietary habits,
particularly high sugar and fat intake, on hyper-cholesterolemia risk. The study emphasizes the potential for
early identification and targeted interventions, contributing to public health improvements and laying the
groundwork for future research with advanced models and additional data sources.
a
https://orcid.org/0009-0008-9457-1221
b
https://orcid.org/0009-0005-3606-7623
c
https://orcid.org/0009-0000-7601-2938
d
https://orcid.org/0000-0002-2992-8422
e
https://orcid.org/0000-0001-7315-3874
f
https://orcid.org/0000-0001-7063-1658
1
INTRODUCTION
The knowledge of factors associated with diseases
affecting the inhabitants of a nation is one of the
greatest steps toward advancing the quality of health in
a country. This knowledge enables public health
authorities to guide and protect their population. In
Brazil, health authorities strive to better understand
hypercholesterolemia, more commonly known as
high cholesterol, one of the most prevalent and
common dyslipidemias (Pirillo et al., 2021). In
Brazil, the prevalence of high cholesterol increased
from 12.5% in 2013 to 14.6% in 2019 (Nogueira de
Saét al., 2022).
Dyslipidemias are metabolic disorders
characterized by alterations in the serum levels of
the main lipoproteins in the bloodstream.
Hypercholesterolemia contributes to various
cardiovascular diseases that affect a large portion of
Brazilians. In 2022, a set of 18 cardiovascular
diseases caused the death of approximately 400,000
people in Brazil, equivalent to the death toll of the
coronavirus in 2021, the worst year of the pandemic
(Mensah et al., 2023).
Franca, D. R., Fiorini, C. D. R., Gonçalves, L. F. C., Noronha, M. D. M., Song, M. A. J. and Galvez, L. E. Z.
A Knowledge Discovery Pipeline to Describe the High Cholesterol Profile in Young People Using GA for Feature Selection.
DOI: 10.5220/0013294800003929
In Proceedings of the 27th International Conference on Enterprise Information Systems (ICEIS 2025) - Volume 1, pages 805-812
ISBN: 978-989-758-749-8; ISSN: 2184-4992
Copyright © 2025 by Paper published under CC license (CC BY-NC-ND 4.0)
805

Hypercholesterolemia is often exclusively
associated with adults and the elderly, where the
proportions of this disease are much higher.
However, this condition is neglected among younger
groups. The article (Calliari et al., 2019) conducted a
study with a sample of 272 children and adolescents
in the city of Marau, in the State of Rio Grande do
Sul (RS), Brazil, on the presence of dyslipidemias.
The study found that 34.7% of participants had
hypercholesterolemia. The study also points out,
through a literature review, that similar results were
found in other parts of Brazil, indicating that juvenile
hypercholesterolemia is not endemic.
There is extensive literature ensuring that through
the use of data science techniques and the application
of machine learning algorithms, it is possible to
better understand hypercholesterolemia and
characterize patient profiles. In the work of (Dritsas
and Trigka, 2022), various classifiers are compared
to characterize patients with hypercholesterolemia
using data from the ELSA (English Longitudinal
Study of Aging) study. The ELSA contains data such
as age, gender, dietary habits, lifestyle, among many
other pieces of information.
The article (Banda et al., 2019) demonstrates the
application of a Random Forest classifier to identify
patients at higher risk of hypercholesterolemia, using
data from Stanford University’s electronic health
system. After training, the model was tested using
data from the American company Geisinger health
system, correctly classifying 84% of instances.
In the Brazilian context, the work of (Albuquerque
et al., 2023) applies supervised machine learning
techniques, specifically a logistic regression model,
to diagnose familial hypercholesterolemia (FH) as a
marker for cardiometabolic risk. The study utilized
data from the HipercolBrasil cohort, which included
genetic and clinical information from 940
individuals referred to lipid clinics. The dataset
incorporated a range of variables, including
metabolic indicators such as LDLc, HDLc, and
triglycerides, as well as behavioral and clinical
factors like smoking habits, age, hypertension, and
premature cardiovascular disease. The logistic
regression model demonstrated robust performance,
achieving an AUROC of 0.82 and an AUPRC of
0.72.
The objective of this work is to identify risk
factors for hypercholesterolemia in the young
Brazilian population (ages 15 to 25) through a data
mining process and machine learning models. For
this purpose, the recent study by the Brazilian
Institute of Geography and Statistics (IBGE), the
National Health Survey (PNS) 2019, will be
considered. This survey was conducted through
questionnaires in 2019 across the entire Brazilian
territory using sampling (https://www.pns.icict.
fiocruz.br/). The PNS-2019 database has 1,088
attributes organized into 26 modules and 293,726
anonymized records.
A decision tree-based model is developed,
representative and generalizable, following a
rigorous Knowledge Discovery in Databases (KDD)
process. The process involves several stages,
emphasizing the initial phase of conceptual attribute
selection, through the application of the CAPTO
method to understand the problem domain (Zarate et
al., 2023). This phase, which can be considered
novel in a KDD process, allows for the conceptual
selection of attributes based on prior domain
knowledge. After data preparation and
transformation, a genetic algorithm-based feature
selection process is applied to identify the best
features for domain representation through learning
models. The results aim to improve the
understanding of hypercholesterolemia in young
people aged 15 to 25.
2
MATERIALS AND METHODS
2.1
Problem Domain Understanding
The initial step for any properly executed data science
project should be understanding the problem domain
through tacit and explicit knowledge, subsequently
leading to a search for representative datasets. A well-
constituted dataset, derived from problem
understanding, enables the construction of more
accurate and representative machine learning models
(Zarate et al., 2023).
In this work, an initial stage of conceptual attribute
selection from the main attributes highlighted by the
literature as relevant factors associated with high
cholesterol is proposed, using the CAPTO method.
During the application of the method, a problem
mapping was conducted using informative literature
sources and domain specialists, aiming to gain new
perspectives, dimensions, and aspects of the problem
domain.
The five main dimensions highlighted in the
problem understanding process were: health habits,
dietary habits, socioeconomic conditions, individual
characteristics, and genetics. The conceptual model
can be seen in Figure 1. Based on these dimensions,
aspects related to the problem domain were selected.
Then, attributes are associated with each of these
aspects.
ICEIS 2025 - 27th International Conference on Enterprise Information Systems
806
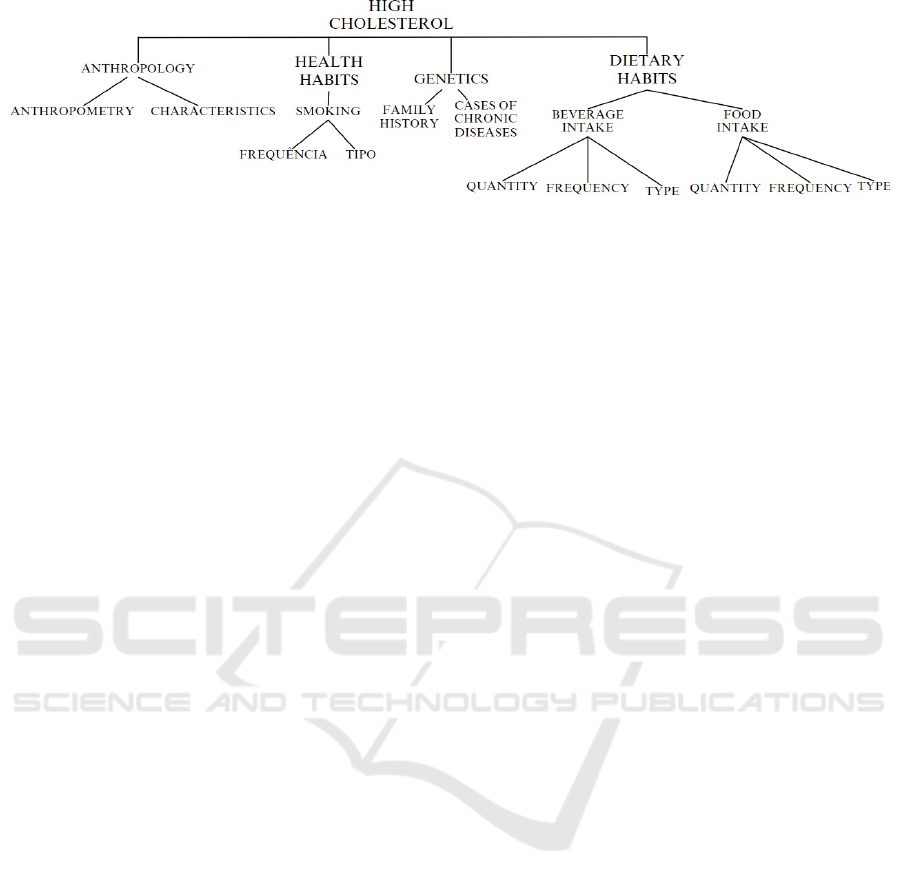
Figure 1: Cholesterol Conceptual Model.
2.2
Conceptual Attribute Selection
The 2019 National Health Survey (PNS) provides a
comprehensive view of the health conditions of the
Brazilian population, including demographic,
socioeconomic, lifestyle, chronic disease, and
healthcare access data. The original dataset contains
293,726 records and 1,088 attributes organized into
26 modules of the original questionnaire. For this
work, only data instances within the 15 to 25 age
range, without null values for the high cholesterol
diagnosis attribute (Q060, see Table 1), were
selected, resulting in only 391 cases. The number
of fully healthy individuals was 8,997, resulting in
an initial dataset comprising 9,388 records.
As indicated by the CAPTO method, attributes
identified by the conceptual model were used as
references to search for a representative dataset for
the problem, in this case, the PNS 2019. After
selecting attributes mapped by CAPTO, 150 initial
attributes were identified, which, after data treatment
and preparation, resulted in 26, as shown in Table 1.
2.3
Preprocessing Steps
The first preprocessing step, after the conceptual
attribute selection mentioned earlier, was a
correlation analysis to identify possible attributes
strongly correlated to high cholesterol, which could
contribute redundantly to describing the profile of
individuals with the disease. For the correlation
analysis, a moderate correlation threshold ranging
from 40% to 69% was used (Schober et al., 2018).
No relevant correlations were found among the
attributes present in the dataset.
It is important to note that although the age
attribute (C008) was selected, it was not used since
the model was built for a predefined age range.
Next, in the second preprocessing step, missing
data handling techniques were applied. After
identifying the exact number of null values per
attribute, an individual analysis was conducted to
decide the strategy to apply, considering aspects such
as attribute relevance, the proportion of null values
relative to the number of instances in the dataset,
and the relationship between attributes with their
respective questionnaire questions. Strategies
employed included imputing missing data and
removing instances. Imputation was applied in cases
where questionnaire questions were left blank
because they did not apply to the participant but
could be replaced based on correct responses from
other questions. Additionally, to ensure data integrity
and quality, specific instances containing multiple
null attributes were removed.
The third step consisted of merging the attributes
height and weight, resulting in the BMI (Body Mass
Index). The calculation for BMI is presented in
Equation (1). The attribute fusion process helps
reduce dimensionality and improves model
interpretation.
BMI = P00103(Weight)/P00403(Height)
2
(1)
The fourth preprocessing step consisted of outlier
identification, calculated using the lower limit, upper
limit, and interquartile range, represented in
Equations (2), (3), and (4). The analysis was
performed only on BMI, which is the only continuous
numerical variable in the dataset.
Lower Limit = Q1 − 1.5 × IQR (2)
Upper Limit = Q3 + 1.5 × IQR (3)
IQR = Q3 −Q1 (4)
The number of outliers found was 220, equivalent
to 2% of the dataset, considered relatively small and
acceptable, as they would not significantly distort the
model’s outcome.
The fifth step involved data encoding. For
nominal data, the One Hot Encoding technique was
used, avoiding interpretation issues of nonexistent
orders and hierarchies, maintaining category
independence, and ensuring that machine learning
algorithms received the data in an appropriate format
for training and prediction. For ordinal categorical
data, ranking encoding was used. For continuous
A Knowledge Discovery Pipeline to Describe the High Cholesterol Profile in Young People Using GA for Feature Selection
807

Table 1: Attribute Table.
Variable Cod
e
Variable Content Res
p
onse Values
C006 Gende
r
1: Male, 2: Female
C008 A
ge
A
g
e
(y
ears
)
Q060 High cholesterol diagnosis? 1: Yes, 2: No, 9: Ignore
d
P00901 Fre
q
uenc
y
of ve
g
etable/le
g
ume consum
p
tion 1-7: Numbe
r
of da
y
s, 9: I
g
nore
d
P01101 Frequency of red meat consumption 1-7: Numbe
r
of days, 9: Ignore
d
P013 Fre
q
uenc
y
of chicken consum
p
tion 1-7: Numbe
r
of da
y
s, 9: I
g
nore
d
P018 Frequency of fruit consumption 1-7: Numbe
r
of days, 9: Ignore
d
P02002 Fre
q
uenc
y
of soda consum
p
tion 1-7: Numbe
r
of da
y
s, 9: I
g
nore
d
P023 Frequency of mil
k
consumption 1-7: Numbe
r
of days, 9: Ignore
d
P02601 Level of salt consum
p
tion 1: Ver
y
hi
g
h, 2: Hi
g
h, 3: Ade
q
uate, 4: Low, 5: Ver
y
low, 9: I
g
nore
d
P02602 Frequency of meal substitution fo
r
snacks 1-7: Numbe
r
of days, 9: Ignore
d
P02501 Fre
q
uenc
y
of sweet food consum
p
tion 1-7: Numbe
r
of da
y
s, 9: I
g
nore
d
P015 Fre
q
uenc
y
of fish consum
p
tion 1-7: Numbe
r
of da
y
s, 9: I
g
nore
d
P02001 Fre
q
uenc
y
of
j
uice
b
ox consum
p
tion 1-7: Numbe
r
of da
y
s, 9: I
g
nore
d
P034 Ph
y
sical exercise o
r
s
p
orts
p
ractice 1: Yes, 2: No, 9: I
g
nore
d
P035 Fre
q
uenc
y
of
p
h
y
sical exercise o
r
s
p
orts
p
ractice 1-7: Numbe
r
of da
y
s, 9: I
g
nore
d
P036 T
yp
e of
p
h
y
sical exercise o
r
s
p
ort 01-17: T
yp
es of exercises, 99: I
g
nore
d
P02801 Fre
q
uenc
y
of alcohol consum
p
tion 1-7: Numbe
r
of da
y
s, 9: I
g
nore
d
P027 Fre
q
uenc
y
of alcohol consum
p
tion 1: I don’t drink, 2: Less than once a month, 3: Once o
r
more
p
e
r
month, 9: I
g
nore
d
P050 Current tobacco us
e
1: Yes, dail
y
, 2: Yes, less than dail
y
, 3: No, 9: I
g
nore
d
P051 Past tobacco us
e
1: Yes, 2: No, 9: I
g
nore
d
P052 Past dail
y
tobacco us
e
1: Yes, dail
y
, 2: Yes, less than dail
y
, 3: No, 9: I
g
nore
d
P00103 Wei
g
ht
(
k
g)
1-599: Kilo
g
rams
P00403 Hei
g
ht
(
cm
)
1-299: Centimeters, 999: I
g
nore
d
Table 2: Number of instances per class at each stage.
Class Original Base Post-processed Base Training Base
Hi
g
h Cholesterol 391 322 222
N
o Hi
g
h Cholesterol 8997 7095 222
Sum 9388 7417 444
numerical data, a data discretization technique was
applied using the BMI thresholds from the World
Health Organization (WHO), to reduce noise in the
model.
BMI < 18.5 : Underweight
18.5 ≤ BMI < 24.9 : Normal weight
25.0 ≤ BMI < 29.9 : Overweight
30.0 ≤ BMI < 34.9 : Obesity grade I
35.0 ≤ BMI < 39.9 : Obesity grade
II BMI ≥ 40.0 : Obesity grade
III
Noise can result from small numerical variations
present in continuous data, and when removed, it can
benefit the decision tree model’s ability to find its
thresholds, allowing the creation of more meaningful
decision intervals.
The sixth step removed instances that resulted in
identical records. After the six previous
preprocessing steps, 47 attributes and 7,417 records
remained in the dataset, as shown in Table 2.
The seventh step involved splitting the data into
training and test sets. The proportion used was 70%
for training and 30% for testing.
The eighth and final step was data balancing in
the training set, performed using undersampling to
reduce the majority class and balance the target class
distribution in the dataset. This process resulted in
a total of 444 instances in the training set. Table 2
shows the number of instances per class at each step.
2.4
Decision Tree Model
The Decision Tree is a supervised learning model that
uses a directed acyclic graph structure to make
decisions based on data features. A decision tree was
chosen for this classification task because of its
parametric simplicity, efficiency, and high
interpretability. The model underwent hyperparameter
optimization through iterative experiments focusing
on the most relevant parameters, as suggested in the
literature (Shetty et al., 2024). The following
hyperparameters were adjusted:
•
criterion: Quality criterion used in the
nodesplitting function. The supported criteria
are ’gini’ (Gini index) and ’entropy’
(information gain measure).
•
max depth: Maximum depth of the tree. A
higher value allows the tree to grow deeper,
capturing more attributes and variability in the
data. Values explored were 5, 10, 20, and 50.
•
min samples split: Minimum number of
ICEIS 2025 - 27th International Conference on Enterprise Information Systems
808

instances required to split a node. Values
explored were 2, 5, 10, 20, 30, and 50.
•
min samples leaf: Minimum number of
samples required to be present in a leaf node.
Values explored were 1, 5, 10, 20, 30, and 50.
The best parameters identified for the Decision
Tree model were: splitting criterion set as ’gini,’
maximum tree depth limited to 5, a minimum of one
sample per leaf, and a minimum of two samples
needed to perform a split.
2.5
Multi-Objective Genetic Algorithm
In this study, the Non-dominated Sorting Genetic
Algorithm II (NSGA-II) was used to identify the
best attribute sequence characterizing the dataset.
This algorithm uses two main criteria: (a) error
minimization, increasing reliability; and (b)
minimization of the number of attributes to represent
the domain. To achieve this, two guidelines were
considered: maximizing accuracy using the
Decision Tree classification algorithm and
minimizing the number of attributes, a task
implicitly performed by NSGA-II. At the end of
each run, the algorithm returns the ideal subset of
individuals containing 10 chromosomes. The best
individual is chosen based on the attribute ranking
among the experiments.
2.6
Representativity
Inspired by genetic evolution, NSGA-II explores
attributes by creating individuals to compose a
population subjected to mutation and recombination
processes. Each individual is represented by a
binary vector, where attributes are coded as 0’s and
1’s, indicating the presence or absence of an
attribute, as shown in Figure 2. The performance
evaluation of each individual is carried out by the
Fitness function, which ranks its performance
according to the proposed problem.
2.7
Fitness Function
The Fitness function acts as a natural selection
mechanism, evaluating each individual and guiding
the evolutionary process to favor those with better
performance. In the context of this Machine Learning
algorithm, the decision tree was chosen as the base
model due to its ability to mitigate overfitting and
efficiency in problems with a large number of
attributes. Although NSGA-II tends to reduce the
number of attributes, chromosomes generated may
not always have a reduced attribute count. These
factors justify using the decision tree in the Fitness
function. The F1-Measure was used as the evaluation
metric, prioritizing precision to minimize errors.
3
EXPERIMENTS AND RESULT
ANALYSIS
3.1
Ga Parameters
The genetic algorithm (GA) explores the search space
and, with each new generation, adjusts the search
direction. To maximize the search space, seeds were
selected to generate the first population within an
interval of 2
47
, encompassing all possible attribute
combinations. Five seeds were used, defining the
population size and generations within an interval of
200 and 400. For other parameters, such as
crossover probability (PC) and mutation probability
(PM), a range of 0.7 to 0.9 was used for PC, and for
PM, a range of 0.1 to 0.3 was used. Using intervals
for these parameters aims to cover the search space
more broadly, creating a possibility to expand the
search area and improve the obtained results. Table
3 summarizes these parameters:
3.2
Cut-off Criterion for Attribute
Selection
The cut-off point criterion for attribute selection was
based on the idea of intersections, as proposed in the
article (Reis et al., 2023). This approach allows for
an analysis of values in descending order, following
the established ranking. To define the cut-off point,
attributes with frequencies below half the total were
excluded, aligning with the algorithm’s convergence
line.
Figure 2: Chromosome.
A Knowledge Discovery Pipeline to Describe the High Cholesterol Profile in Young People Using GA for Feature Selection
809

Table 3: Parameters and their values.
Parameters Values
Seeds 134823916307688; 122466519533640; 11816952573039;
58264536736136; 6213547046596
Population 204; 404
Generations 200
CrossOverFacto
r
0.7; 0.9
TournamentSize 2
MutationRate 0.1; 0.3
ElitismFacto
r
1
Table 4: Decision Tree Rules and Case Distribution.
Rule Description High Cholesterol Cases No High Cholesterol Cases Total Cases
If fruit consumption is low, soda
consumption is high, and alcohol
consumption frequency is moderate,
then the individual has high
cholesterol.
25 13 38
If fruit consumption is low, soda
consumption is low, and chicken
consumption is high, then the
individual has high cholesterol.
8 1 9
If fruit consumption is low, soda
consumption is moderate, and
chicken consumption is low, then the
individual does not have high
cholesterol.
24 44 68
3.3
Experiments
Forty experiments were conducted to find the best
result, based on the combinatorial analysis of all
parameters. That is, a seed will be combined with
each of the population, generation, crossover, and
mutation values. After completing all the
experiments, an analysis of the frequency of attribute
appearances in the resulting subsets was performed,
ordering them from the most to the least frequent.
As the algorithm converges, certain attributes tend
to recur, enabling descending classification based on
frequency. The best attributes were selected using a
cut-off point based on the difference of four
recurring attributes, opting to draw the cut-off
between the attributes ”Walking” and ”Bicycle or
exercise bike,” where the difference indicates the
ideal cut-off point. In the end, a total of 20 attributes
were obtained, leading the decision tree model to
achieve 53.78% accuracy when analyzing the best
fold resulting from cross-validation.
After analyzing the generated decision tree, it was
observed that only 11 attributes were utilized: P051
2.0, Milk Consumption, P051 1.0, Chicken
Consumption, Soda Consumption, Water Aerobics,
Physical Exercise in the Last 3 Months,
Weightlifting, Exercise Frequency, Fruit
Consumption, Dance Class, prompting another
experiment based solely on these 11 attributes. After
performing the second attribute selection
experiment, a total of 6 attributes were selected:
Fruit Consumption, Milk Consumption, Soda
Consumption, Alcohol Consumption Frequency and
Chicken Consumption.
3.4
Result Analysis
After applying the conceptual selection together with
attribute selection using the GA, a decision tree model
with an F1 Score of 66% was obtained, indicating
that despite the limitations found in the available data
quantity, it was still possible to generate a model with
a reasonable result in classifying young individuals
with high cholesterol. From the generated tree, rules
were extracted and are represented in Table 4.
ICEIS 2025 - 27th International Conference on Enterprise Information Systems
810

Considering the highlighted rules, it can be
concluded that one of the main factors for a young
individual to have high cholesterol is diet. It is
evident that a balanced diet, such as one rich in
fruits, is associated with a lower probability of
having high cholesterol. This aligns with the
findings of (Liu et al., 2021), a study that analyzes
the association between fruit consumption and lipid
profile among children and adolescents in China.
Both highlight that moderate fruit consumption is
associated with lower odds of lipid disorders,
particularly in younger participants. However, other
aspects, such as high sugar and fat consumption, are
more decisive factors. The prominence of fat and
sugar in the development of high cholesterol
becomes clear when observing that all three rules
identify low fruit consumption as a factor, but the
decisive element is the consumption of animal meat
and soda. Similarly, (Sakaki et al., 2022) supports
this by analyzing the sugar-sweetened beverage
consumption of a sample of 9,043 participants aged
between 9 and 16 years. The study indicates that
sugar-sweetened beverage intake is associated with
hyperlipidemia, whereas like in this work fruit juice
consumption is not. Based in the comparison with
previous work, the validation of the rules is evident.
Furthermore, other factors, such as frequent alcohol
consumption, can also influence, especially when
combined with high-fat foods, as high consumption
of animal fats, like milk and chicken, is widely
recognized for significantly increasing the
probability of developing hypercholesterolemia.
4
CONCLUSIONS
The results of this study demonstrate that applying
machine learning models can effectively help
characterize individuals aged 15 to 25 with high
cholesterol using data from the 2019 National Health
Survey (PNS), despite highlighting the various
challenges to achieving this goal. The generated
decision tree model presented an F1 Score of 66%,
indicating reasonable performance in identifying
young people with high cholesterol. This accuracy
indicates significant potential to assist in initial
screenings, allowing for the early identification of
individuals at risk. This could, for example, direct
preventive efforts and educational interventions
focused on dietary habits and healthy practices
among the young population, helping to reduce
cardiovascular disease rates in the long term. It
contributes to the literature on developing machine
learning models aimed at characterizing
dyslipidemias with a combination of techniques of
feature selection, expanding the discussion of which
variables can be used and how they should be
treated. Furthermore, this work explores the
understanding of characteristics of individuals with
high cholesterol in the PNS (National Health
Survey), in an age group that has been underexplored
to date and has been growing over the years. Since
this work deals with a specific group of individuals
in a Brazilian dataset, it is necessary to exercise
caution when trying to generalize the conclusions
obtained. Even with the dataset being selected based
on features related to the problem, the model still
suffers from leakage of some attributes, and
instances which was re-ally affected by the
imbalance of the dataset. It is important to emphasize
that this result was achieved in the best fold of cross-
validation, suggesting that despite the model’s
potential, caution is needed regarding data variability
and possible generalization limitations. For future
studies, it is recommended to explore additional
preprocessing techniques to address the challenges
identified in this study, particularly concerning data
imbalance and potential attribute leakage. Advanced
methods like SMOTE (Synthetic Minority Over-
sampling Technique) could be applied to mitigate
the effects of imbalanced datasets. Furthermore,
adopting more sophisticated feature engineering
approaches, like the ones presented in this work,
could enhance the model’s ability to generalize and
improve its performance across different datasets.
Considering the limitations of the current decision
tree model, integrating more advanced machine
learning models, such as ensemble methods (e.g.,
Random Forest, Gradient Boosting) or deep learning
techniques, holds promise. In addition, expanding
the dataset by including longitudinal data could help
capture temporal patterns in dietary habits and
cholesterol levels, enabling models to better predict
long-term risks. Using and incorporating specific
datasets, made to fullfill the feature and instances
necessity of the problem. Building on the insights
from this study and previous research, future work
could delve deeper into diet-related factors. For
instance, exploring the relationship between a more
precise and complex dietary data and high
cholesterol. Validating the rules identified in this
study, such as the decisive role of soda and animal
meat consumption, through controlled experiments
or observational studies in similar age groups, would
help confirm their relevance and strengthen their use
in predictive models. Contributing to the
advancement of data science in healthcare and
improving the population’s quality of life.
A Knowledge Discovery Pipeline to Describe the High Cholesterol Profile in Young People Using GA for Feature Selection
811

ACKNOWLEDGEMENTS
The authors thank The National Council for Scientific
and Technological Development of Brazil (CNPQ);
The Coordination for the Improvement of Higher
Education Personnel - Brazil (CAPES) (Grant
PROAP 88887.842889/2023-00 – PUC/MG,
Grant PDPG 88887.708960/2022-00 – PUC/MG -
INFORMAT-ICA and Finance Code 001); Minas
Gerais State Research Support Foundation
(FAPEMIG) under grant number APQ-01929-22,
and the Pontifical Catholic University of Minas
Gerais, Brazil.
REFERENCES
Albuquerque, J., Medeiros, A. M., Alves, A. C., Jannes,
C. E., Mancina, R. M., Pavanello, C., Chora, J. R.,
Mombelli, G., Calabresi, L., da Costa Pereira, A.,
Krieger, J. E., Romeo, S., Bourbon, M., and Antunes,
M. (2023). Generation and validation of a classification
model to diagnose familial hypercholesterolaemia in
adults. Atherosclerosis, 383:117314.
Banda, J. M., Sarraju, A., Abbasi, F., Parizo, J., Pariani,
M., Ison, H., Briskin, E., Wand, H., Dubois, S., Jung,
K., Myers, S. A., Rader, D. J., Leader, J. B., Murray,
M. F., Myers, K. D., Wilemon, K., Shah, N. H., and
Knowles, J. W. (2019). Finding missed cases of
familial hypercholesterolemia in health systems using
machine learning. NPJ Digit. Med., 2(1):23.
Calliari, S. S., Grando, L. G., Bertol, C. D., and Siqueira,
L.d. O. (2019). Dislipidemia em crianc¸as e adolescentes
do município de maraurs [dyslipidemia in children and
adolescents from the municipality of maraurs].
Cadernos Saúde Coletiva, 27(4):368–373.
Dritsas, E. and Trigka, M. (2022). Machine learning
methods for hypercholesterolemia long-term risk
prediction. Sensors, 22(14):5365.
Liu, J., Li, Y., Wang, X., Gao, D., Chen, L., Chen, M., Ma,
T., Ma, Q., Ma, Y., Zhang, Y., Jiang, J., Zou, Z., Wang,
X., Dong, Y., and Ma, J. (2021). Association between
fruit consumption and lipid profile among children and
adolescents: A national cross-sectional study in China.
Nutrients, 14.
Mensah, G. A., Fuster, V., Murray, C. J., and Roth, G. A.
(2023). Global burden of cardiovascular diseases and
risks, 1990-2022. Journal of the American College of
Cardiology, 82(25):2350–2473.
Nogueira de Sá, A. C., Gomes, C. S., Moreira, A. D.,
Velasquez-Melendez, G., and Malta, D. C. (2022).
Prevalência e fatores associados ao diagnóstico
autorreferido de colesterol alto na população adulta
brasileira: Pesquisa nacional de saúde 2019
[prevalence and factors associated with self-reported
diagnosis of high cholesterol in the brazilian adult
population: National health survey 2019].
Epidemiologia e Serviços de Saúde, 31(spe1).
Pirillo, A., Casula, M., Olmastroni, E., Norata, G., and
Catapano, A. (2021). Global epidemiology of
dyslipidaemias. Nature Reviews Cardiology, 18:689 –
700.
Reis, D. R., Santos, B. C., Bleicher, L., Zárate, L. E., and
Nobre, C. N. (2023). Prediction of enzymatic function
with high efficiency and a reduced number of features
using genetic algorithm. Computers in Biology and
Medicine, 158:106799.
Sakaki, J. R., Gao, S., Ha, K., Chavarro, J., Chen, M.-H.,
Sun, Q., Hart, J., and Chun, O. K. (2022). Childhood
beverage intake and risk of hypertension and hyper-
lipidaemia in young adults. International Journal of
Food Sciences and Nutrition, 73:954 – 964.
Schober, P., Boer, C., and Schwarte, L. A. (2018).
Correlation coefficients: Appropriate use and
interpretation. Anesthesia amp; Analgesia,
126(5):1763–1768.
Shetty, A. M., Aljunid, M. F., Manjaiah, D. H., and
Shaik Afzal, A. M. S. (2024). Hyperparameter
optimization of machine learning models using grid
search for amazon review sentiment analysis. In
Nanda, S. J., Yadav, R. P., Gandomi, A. H., and
Saraswat, M., editors, Data Science and Applications,
pages 451–474, Singapore. Springer Nature Singapore.
Zarate, L., Petrocchi, B., Dias Maia, C., Felix, C., and
Gomes, M. P. (2023). Capto - a method for
understanding problem domains for data science
projects: Capto - um método para entendimento de
domínio de problema para projetos em ciência de
dados. Concilium, 23(15):922–941.
ICEIS 2025 - 27th International Conference on Enterprise Information Systems
812
