
From Syntax to Sketch: Visualizing Code for Enhanced Comprehension
with Focus on Cybersecurity
Raul Zaharia
a
and Dragos
,
Gavrilut
,
b
Al. I. Cuza University & Bitdefender, Ias
,
i, Romania
Keywords:
Learning Programming, Visual Learning, Integrated Development Environments, Cybersecurity Concepts.
Abstract:
The ability to form the mental model of programming concepts is difficult for beginners. In this paper, we
introduce “RZData”, a novel tool designed to leverage visual representations of the code, similar to what a
tutor would draw, to provide a more suitable learning environment. It transforms source code into interactive
visual sketches, enabling users to see what is happening at every step. The tool provides means for both
learning and evaluation in a dynamic manner, using dynamic questions. It also incorporates courses with
embedded cybersecurity concepts, providing a goal of learning programming while also using secure coding
practices. The visualization process highlights potential vulnerabilities and teaches the users how to deal with
them.
1 INTRODUCTION
As the society continues to evolve, more and more
jobs require digital skills (Bejakovic and Mrnjavac,
2020). One of those skills involves learning to pro-
gram computers. From a student’s perspective, it
is difficult to learn the basic concepts of program-
ming and the solution is a tool that facilitates practical
learning (Rosminah et al., 2012).
Furthermore, while teaching a first-semester com-
puter science in Data Structure and Algorithms at the
Faculty of Computer Science, we observed the need
for a tool that presents visually what really happens
in a program. While the teacher’s explanations and
drawings helped, the students found themselves in a
situation where they could not understand how that vi-
sual representation started. In response to those need,
we propose a tool called RZData, that doubles as both
a teaching assistant and as a teacher: the same vi-
sual representations, similar to what a teacher draws,
can be observed directly inside the application. The
process can be repeated as many times as it requires
for the students to understand what really happens.
Moreover, the program is also an intro to cyberse-
curity, offering both courses and safe implementation
practices.
Each teacher has her/his own unique way of de-
signing graphical representation when teaching pro-
a
https://orcid.org/0009-0005-6366-9152
b
https://orcid.org/0009-0004-3339-9625
gramming to beginners. The quality of the represen-
tation depends on the teachers’ ability to draw. When
students will encounter bugs, they will rely on those
representations to try to understand what happened.
For a beginner, it is more impactful if the visual rep-
resentation aligns with their mental models instead
of the actual computer representation. The human-
centered design builds a stronger foundation which
could be further extended by understanding the com-
puter representation. The initial programming prac-
tices will impact how the students will see and write
code: making the adoption of secure coding and clean
code practices. Moreover, having some basic knowl-
edge of cybersecurity could also lead to more secure
interactions with the online world. Hence, the follow-
ing main research question: What is the most efficient
way a tool can help someone who is eager to learn
programming, to deliver the most appropriate visual
representation and knowledge.
A possible solution to answer the previously de-
scribed question is to develop a learning tool that ad-
dresses the following objectives:
OB1. have a friendly and insightful visual presenta-
tion (closer to the mental model);
OB2. present repeatable learning experience (stu-
dents should be able to see on their own and
understand what the code does);
OB3. seamless evaluation that uses the same re-
sources (same materials used for learning
could also be used for evaluation);
752
Zaharia, R. and Gavrilu¸t, D.
From Syntax to Sketch: Visualizing Code for Enhanced Comprehension with Focus on Cybersecurity.
DOI: 10.5220/0013295000003932
In Proceedings of the 17th International Conference on Computer Supported Education (CSEDU 2025) - Volume 2, pages 752-759
ISBN: 978-989-758-746-7; ISSN: 2184-5026
Copyright © 2025 by Paper published under CC license (CC BY-NC-ND 4.0)

OB4. offer support for clean code and secure pro-
gramming practices;
OB5. integrate and offer materials for cybersecurity
concepts.
We want our tool to be available to everyone in
any context, regardless of the device (PC or phone),
operating system used or network bandwidth. While
also considering the above objectives, we developed
the tool RZData with the following practical require-
ments (PR):
PR1. be available to lower specification devices
(phones or older computers);
PR2. work the same and on any Operating System;
PR3. provide a friendly interface and experience for
both learning and evaluation;
PR4. use less network traffic to facilitate slow inter-
net connections.
2 RELATED WORK
There are already plenty of meaningful tools that
leverage the visualization as a teaching mecha-
nism (Fracis, 2024). The majority of them are special-
ized in dealing with a single algorithm or data struc-
ture at a time. (Galles, 2011) is one of those resources
that offers a lot of variety for both algorithms and data
structures. A dedicated visualization for each partic-
ular case could offer more information, but someone
who is new to programming might feel overwhelmed
by the sheer number of options to learn and the con-
siderable variety (different representation for different
algorithms and data structures). While YouTube is not
as interactive (students can only see what the teacher
presents), it is also a great resource when used prop-
erly (content selection done by the teacher) (Shoufan
and Mohamed, 2022). It could also be combined with
the visualization tools for a better outcome.
An integrated development environment (IDE) is
an application that helps programmers to develop
software code. It enriches the development process
by offering: syntax highlighting, testing, debugging
and other capabilities.
(Strijbol et al., 2024) offers an education de-
bugger experience where they develop a debugger
for the Scratch programming language to help users
learn and to be able to debug their bugs. (Cai.
et al., 2023) also provide a debugger where they deal
with first class functions in JavaScript. Python Tu-
tor (Guo, 2013)is a popular program visualization tool
for Python designed for learning that reached over one
fifth of a million users. (Guo, 2021) provides more
context on the tool history and also provides insights
on how to build and design a successful (large num-
ber of users) learning tool: how to scale, how to de-
sign the user experience. While these tools provide vi-
sual representation closer to the actual machine state,
our focus is on having representation similar to those
drawn by the teachers.
Another relevant and interesting approach is to of-
fer additional resources and use additional senses to
the learning process: from smart assistant to hearing
and speaking. (Menon, 2023) studies how GitHub
Copilot is used as a learning tool by students, with
and without prior experience and how they interact
with it, when doing coding exercises (users are asked
to solve the problems, update existing code, add new
code). To have the optimal experience, they are best
used for users that have already some experience. In
our case, since our target are students without prior
experience when programming, we will not be using
similar tools as a primary learning method. One fu-
ture research direction obtained from this is to train
a LLM to respond to questions about the concepts
presented to give explanations. (Winkler and Roos,
2019) observes that Smart Personal Assistants (SPAs)
such as Google’s Assistant, Amazon’s Alexa and oth-
ers add value to everyday learning. This is also an in-
teresting approach, where, this time, the users’ voice
is used to interact with the Smart Personal Assistants,
playing the role of Smart Tutors.
It all starts with the common met problems when
teaching programming to beginners. For this, (Sorva
et al., 2013) provides a great summarization of those
problems. The beginners have difficulties to mentally
tracing program execution due to selecting wrong
“moving parts” when trying to follow the program
state and also due to program robustness. Further-
more, certain techniques for teaching improve the
learning process: using program visualization, visual
debugger and working on their own. Each student
has their barriers to overcome when understanding
new concepts, and they might need help to overcome
them (Meyer et al., 2005).
3 SOFTWARE DESCRIPTION
RZData is an online education platform where people
can learn visually and understand programming con-
cepts while also having interactive evaluation meth-
ods. The main objective of the platform is to con-
vert the code into a visual representation that would
be as friendly and easy to use as possible (like it was
drawn by a teacher). The focus is on making the
learning process as transparent as possible, where the
From Syntax to Sketch: Visualizing Code for Enhanced Comprehension with Focus on Cybersecurity
753

user takes advantage of the visual representation to
see step-by-step what is actually happening while also
providing some evaluation, while providing resources
for cybersecurity. The solution should be able to work
on any device with access to the Internet (laptop or
mobile device) to accommodate as many students as
possible, while also having lower requirements, min-
imal amount of RAM, storage and Internet traffic.
The application is composed of two components
(see Figure 1), an interpreter which handles how the
user input is received and analyzed to be transformed
into its visual representation. The other component
handles the evaluation of the new learned concepts:
custom questions created by the teacher that also
leverage the visualizing part. A brief introduction can
also be seen in the presentation video (RZData, 2024).
3.1 Interpreter Module
The interpreter module is further composed of two in-
dependent parts: the parser and visual representa-
tion. Those two parts are working together to reach
the final form of the representation. They commu-
nicate through the core using a specific protocol for
communication: the parser understands and converts
the data into specific drawing instructions, that are
sent to the drawing component. Both components
are built independent of each other, so they can be
replaced at any time with other equivalent ones. In
this manner, the platform could support multiple lan-
guages and multiple visual representations, either by
creating new ones or extending those already exist-
ing. Both components leverage abstractions, so when
a new language or representation is needed they could
easily extend the existing classes or create new ones,
having already a base to start from.
3.1.1 Parser Submodule
The parsing (language interpretation) component
is built to support the language is used for the course
Data Structures, for those in the first year of fac-
ulty. This language in inspired from both C by having
pointers and also from Python by having instructions
delimited by spaces. The students learn to write code
that is easier to read by having to follow proper code
spacing, and they also learn to use low-level opera-
tions like working with pointers. These low-level op-
erations also serve as sources for learning about safe
coding. The application contains a language docu-
mentation page for the syntax, examples and its fea-
tures (see Figure 2). While students could use existing
algorithms like sorting, they are encouraged to write
them on their own from zero. A visual representation
can also be observed in the presentation video (RZ-
Data, 2024) (minute 2:20).
The language has a Python-like syntax, and it
is very simplistic because the emphasis is on un-
derstanding the basic concepts like basic algorithms
(e.g., checking if a number is prime) and basic data
structures like queue, stack, linked list, binary tree.
Having in mind that this language is designed for stu-
dents in their first year of learning the basics of pro-
gramming, it uses functions that accepts simple data
structures as parameter instead of objects because the
focus is on taking small steps to learn how concepts
are used, and later the user could achieve the object-
oriented programming after they understand them.
For security purposes and for having better control of
what can and cannot be used in the interpretation pro-
cess, there exists a configuration file that marks which
functions are registered to be available in the pars-
ing process. Furthermore, the entire parser is writ-
ten in Python without many optimizations because the
parser on its own could be used as a teaching material.
For exporting the drawing instructions, the parser ob-
serves every change of the variables by understanding
every operation and variables allocation in the appli-
cation. It registers and stores all changes that happen
through initiation until the end of scope for that vari-
able.
If the parser finds errors, they will be exported in-
stead, showing which line is not respecting the speci-
fications. Depending on the teacher’s decision (if safe
coding is enabled), those errors could be transformed
into lessons on cybersecurity and safe coding. Incor-
rectly using pointers and low-level operations could
lead to invalid and unsafe memory states that could
be exploited by attackers. The parser can find those
problems and point them out (e.g., use of uninitialized
variables, dangling pointers, use of a freed pointer,
etc.). The user is guided on the problem and how it
can be fixed (see Figure 3).
The parser component has a few disadvantages
that are taken care of or have reduced impact in the
entire context:
• The component is built on Python so it has slower
execution time until it gets to the result, but this
is compensated due to the complexity of the lan-
guage because it has a basic syntax and the sim-
ple errors could be spotted almost instantly. The
upside of this is the lower development time and
having faster methods of developing and adding
new features to it.
• Every new function or new created object must
be registered to be accessible. Furthermore, ev-
ery member and function in new objects must be
specifically exposed to the exterior. This feature
CSEDU 2025 - 17th International Conference on Computer Supported Education
754
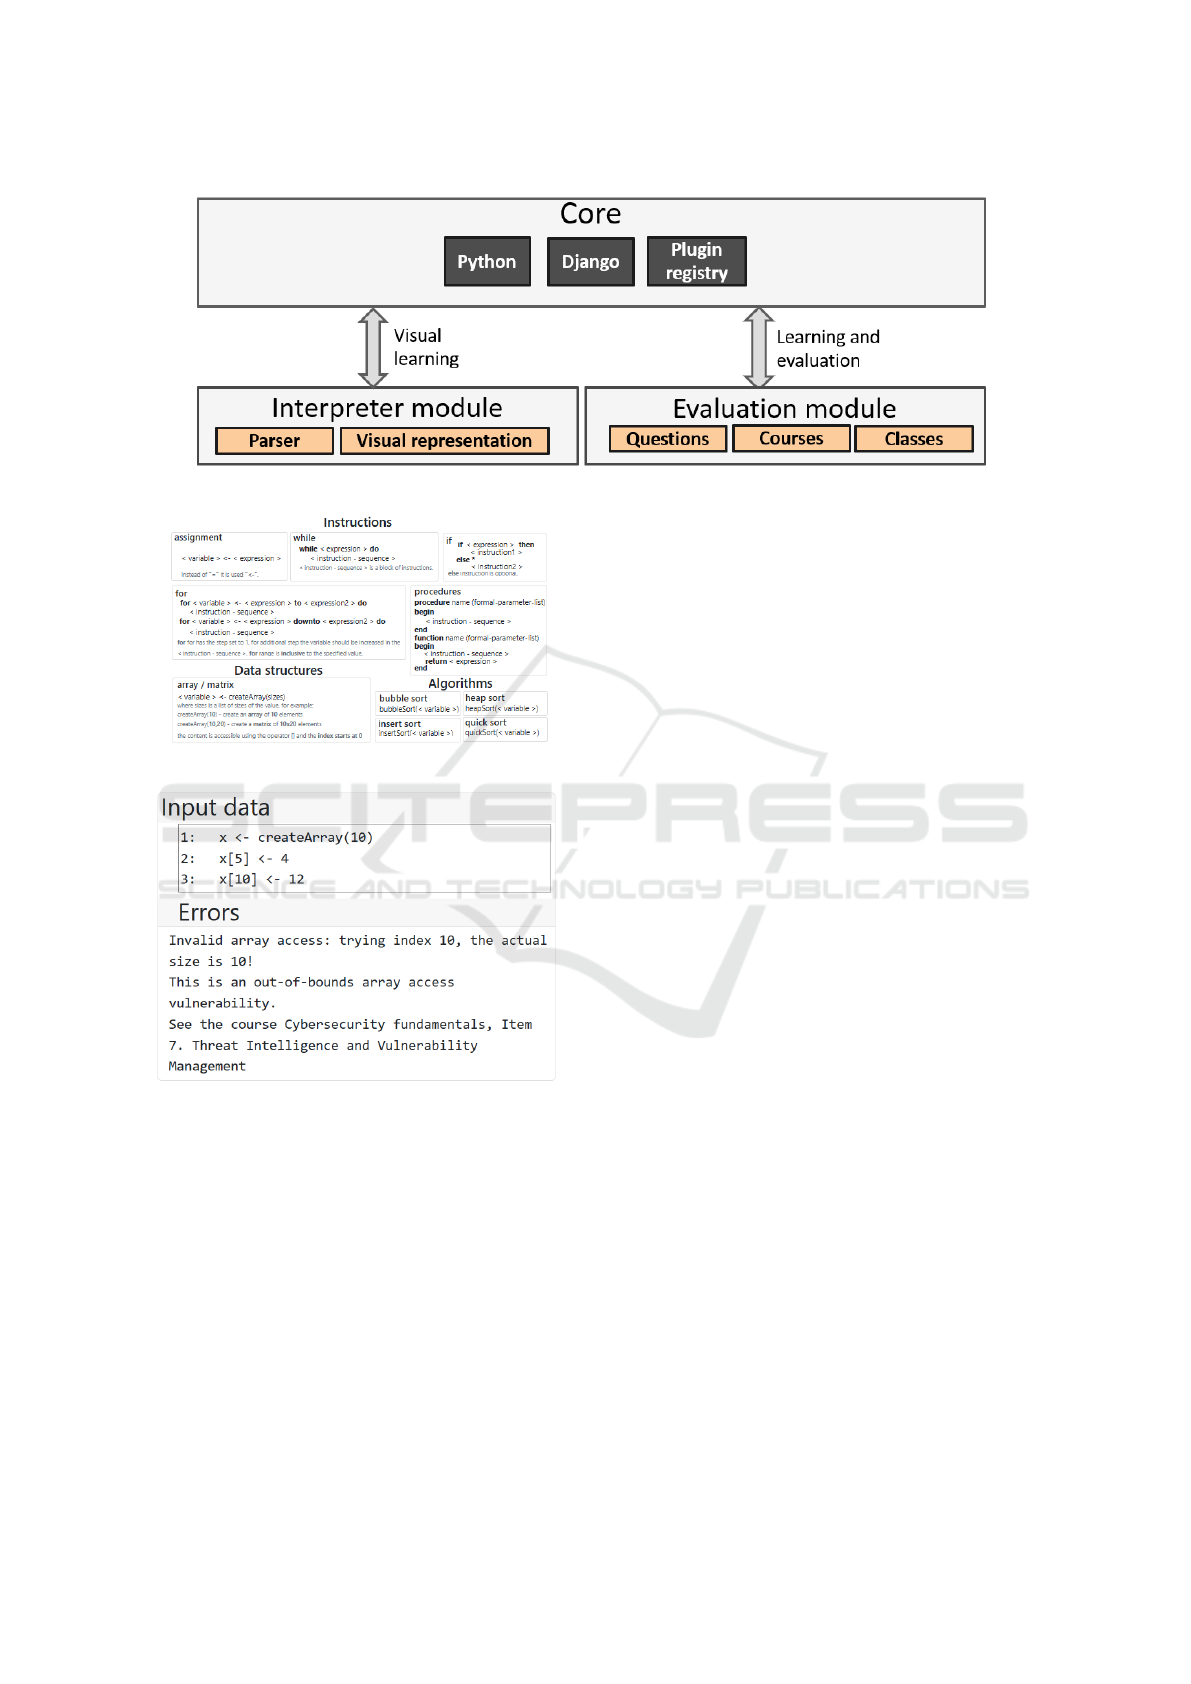
Figure 1: Architecture.
Figure 2: Language documentation.
Figure 3: User error found with additional explanation in
the course.
is very nice from the security standpoint, but this
could be a bit tedious, and later it could be auto-
mated to be automatically exported based on some
custom decorators or based on some name con-
ventions.
• Python is a dynamically typed language, mean-
ing that the types of variables are checked dur-
ing compile time. Type hints are used exactly for
this purpose of increasing the code visibility and
increasing the usability for writing ulterior unit
tests. This feature is even more helpful to catch
certain errors and to build and maintain a cleaner
architecture because they are recognized when us-
ing an IDE.
• This language is designed for learners, so one nec-
essary thing to consider dealing with is having in-
finite loops. Having in mind that the interpreter
is used in an API, it is even more relevant not to
generate extra costs by having the resource being
used forever. In this case, every loop and action
in the interpreter has a maximum number of loops
and when that is reached it throws an exception
and the execution stops. If this was not treated,
those errors could lead to service denial, having
few instances that run forever and using all avail-
able resources. The upside of using it an API is
that the program can run on any device because
the heavier computations are done on the server.
3.1.2 Visual Representation Submodule
After the parsing was successful, the program will
start to interpret the code. In the end, a list of drawing
instructions (sent as tokens) will be obtained and fed
into the visual representation component along with
input code (see Figure 4). The list of tokens contains
every variable change (along with its modified fields).
This component can be integrated into other parts of
the platform or other platforms and can be used to en-
rich the learning process while also helping teachers
evaluate students in an interactive manner. Users can
interact and practice writing code, observing what it
does at every step. To ease user integration, the ap-
plication provides a few examples from which it can
start.
The interface is simple and effective. The user
can choose from three buttons: “Restart” — to reset
the representation animation to the beginning, “Next
line” — to see what the next line of analyzed code
does and “Submit another code” — goes back to the
interface where the user can edit or insert new code.
When analyzing each line of code, the user can see
in real time what line was currently executed and its
From Syntax to Sketch: Visualizing Code for Enhanced Comprehension with Focus on Cybersecurity
755
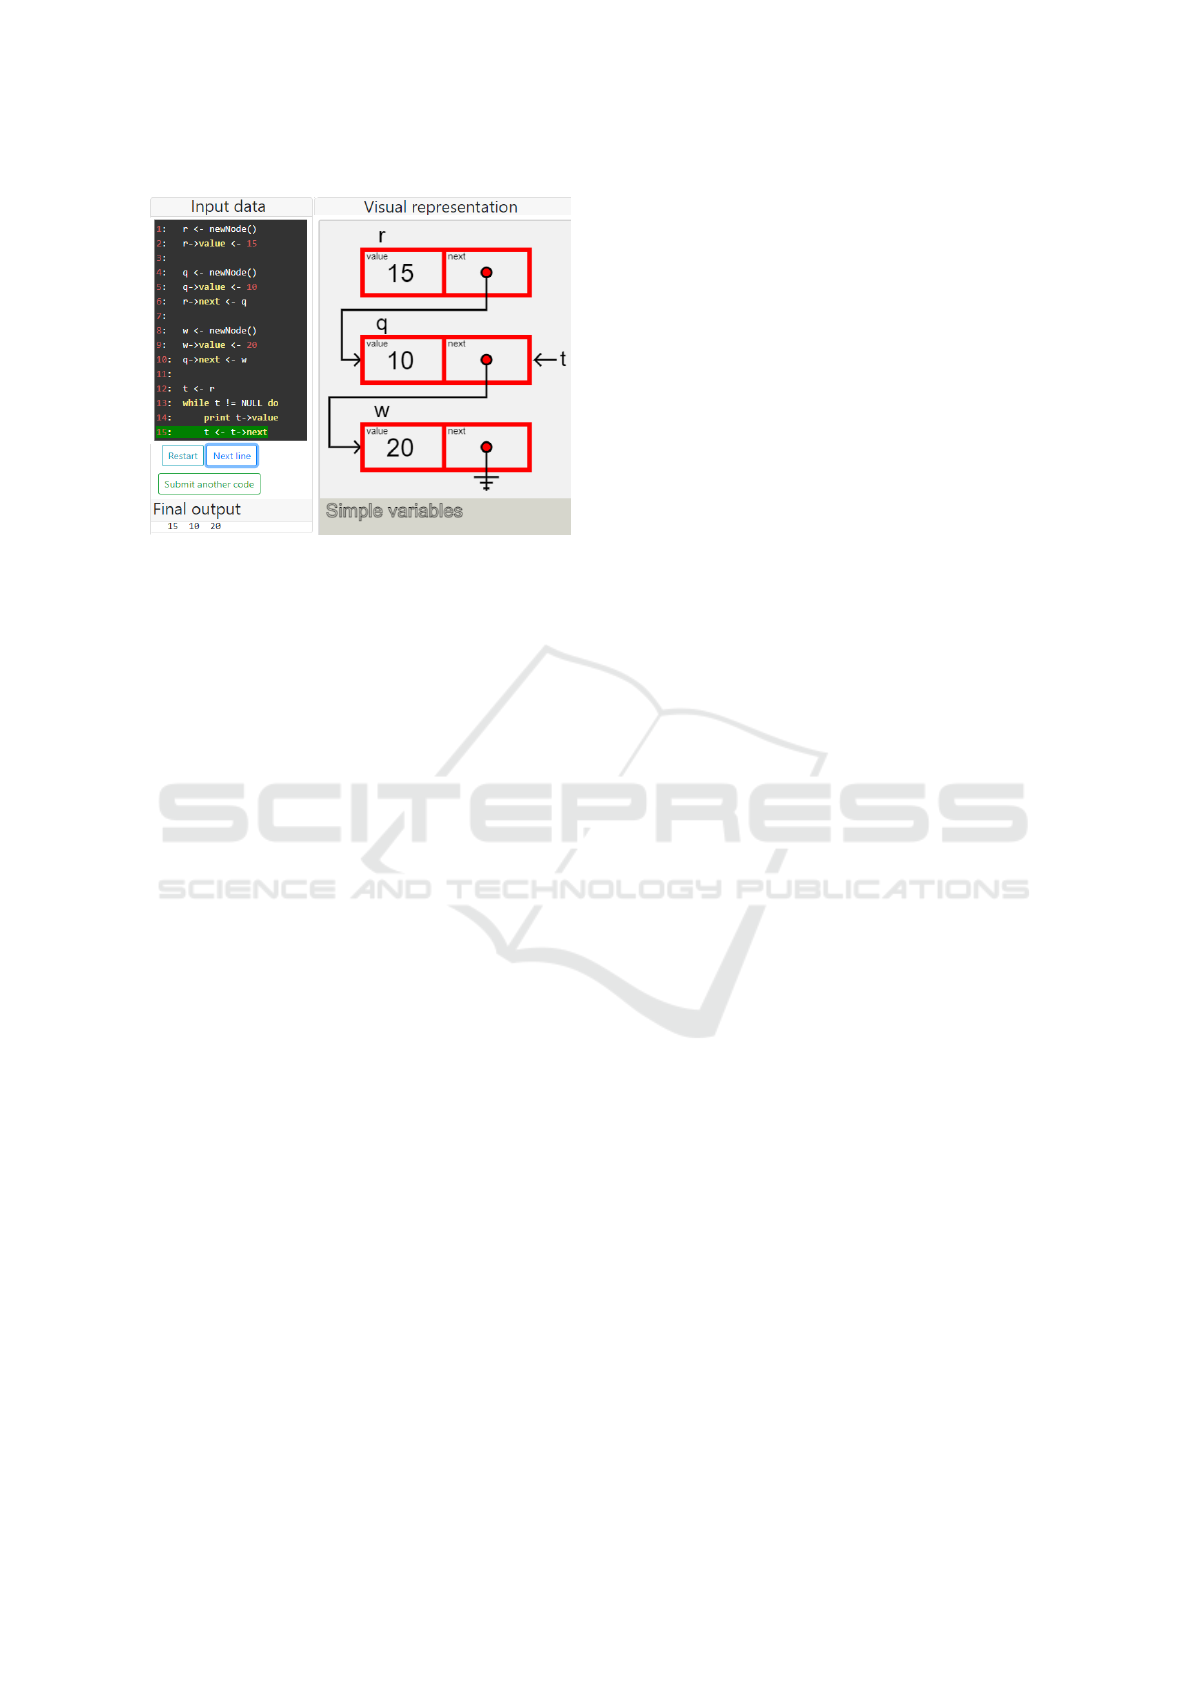
Figure 4: Visual representation of a linked list.
visual representation. To reduce the number of clicks
required for a program to reach its end state, the vi-
sual representation ignores the lines where a condi-
tion takes place (e.g., the condition inside the while in
Figure 4). Figure 4 represents the “Simple linked list”
example, where the button “Next line” was pressed a
few times to reach the current state. The final output
of the processed input is presented in the left panel at
the bottom. The visual representation area is split into
two sections: the top zone where all complex vari-
ables are being drawn (like stack, queue, linked lists)
and the bottom part named “Simple Variables” where
every simple variable is shown with its value.
This component is built using JavaScript by draw-
ing on canvas line by line, point with point to reach the
expected/shown drawing. It is written from zero with-
out external dependencies because it should be com-
patible with many browsers and also its size should be
minimal to reduce the network traffic, to be available
to all students. The difficulty of the addition process is
reduced because the drawing logic is built using ob-
jects with generic interfaces. There are present two
base classes for developing new types of variables.
The application also provides a list of variable man-
agers; a variable manager is a class type that contains
and manages multiple variable types of the new im-
plemented type. For declaring a new type, the devel-
oper must extend the base classes. For registering new
managers which have new variable types, the devel-
oper must specifically register the new type by adding
it into a specific list of allowed managers.
3.2 Evaluation Module
The other component that handles the evaluation is
the evaluation module, which offers ways for the
teacher to also evaluate the progress of learning for
the new programming concepts. The main unit in this
module is the questions part. The teacher can create
a set of generalized questions (that have automated
evaluation) to evaluate users’ progress. The courses’
module presents the new information to the students,
and they could also contain questions for further test-
ing the efficiency of learning. Multiple students are
grouped in different classes, to facilitate tests (groups
of questions) creation and evaluation.
3.2.1 Questions Submodule
The learning and evaluation process is simplified by
being capable to reuse the generic questions, saving
a lot of time in this manner. The students can take
courses and tests that are assigned to them, and they
could practice on their own in the playground new
data structures and algorithms. The same question
can be used in both scenarios: learning and evalua-
tion. Being capable to see at each step what their code
does and to see the visual representation is a great ad-
vantage because students can learn on their own and
practice the examples given in the courses. To ease
the use and search for questions, they are all found in-
side the Questions Bank (the collection that contains
all the questions).
The application provides a new type of question
called “Custom question” or dynamic question. It
solves the need that started this platform; being a way
to help users learn visually but to also define a tem-
plate that could be reused and to generate tests, dif-
ferent for each student (depending on how questions
were built). A dynamic question could be defined in
two ways, using the “Simple question” tab like it is
used in Figure 5 or using the “Complex question” tab
when there are needed even more features (see Fig-
ure 6). Let’s take for example a question where we
want to generalize the equation “x + 5 = 10”. With
the standard question, if the teacher wants to give this
question to more students having different values he
must modify the numbers, a process that could take
time (depending on the complexity of the question).
More generically, the equation could be written as “x
+ y = z” where “x = z - y”. Using the same reasoning,
we created three templates that for the Master The-
orem for each theorem case. Students will receive
the same complexity exercise with different pairs of
input-output.
The programming language used to learn the
structures is also the one interpreted in the variables
area because the teacher can use the code from an-
other question and just modify the required parts to
create a new solving process. Having a modular
build, another programming language can be used to
write questions. By using the same language, the
CSEDU 2025 - 17th International Conference on Computer Supported Education
756
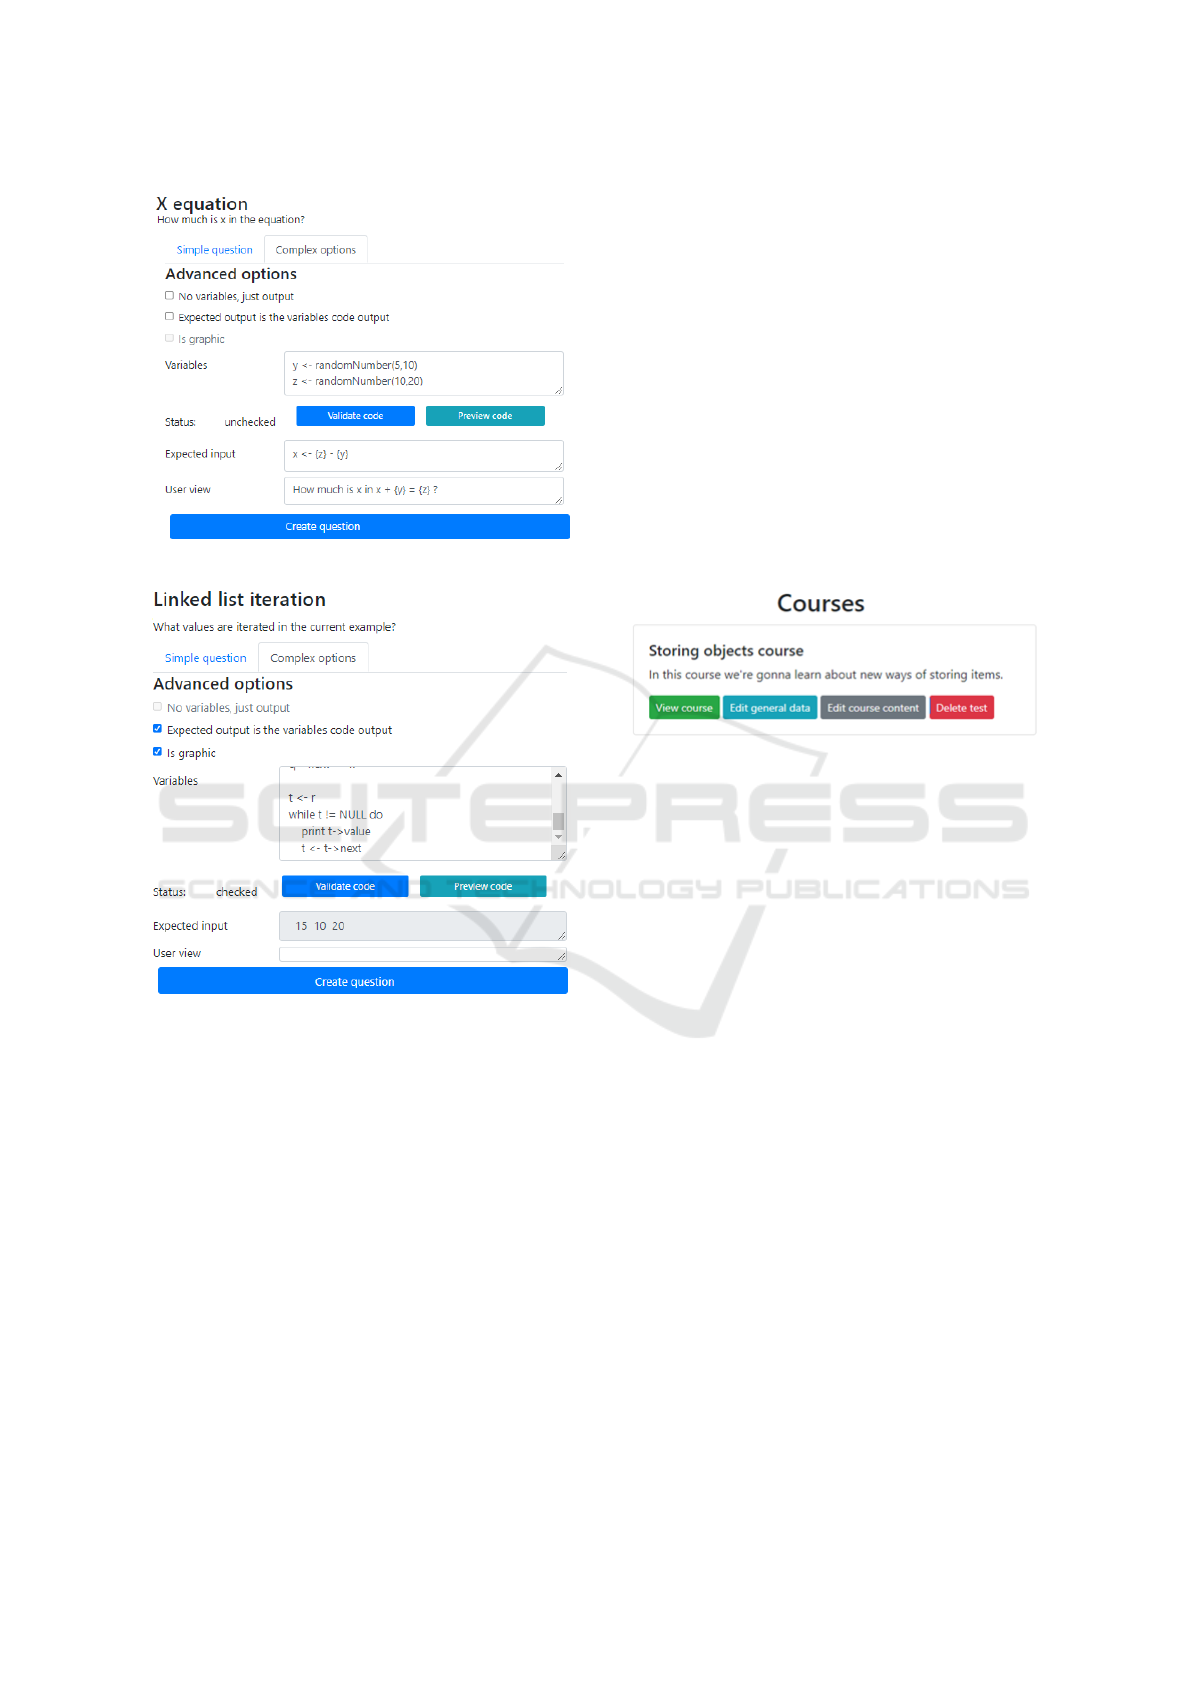
Figure 5: Dynamic question simple definition.
Figure 6: Dynamic question complex definition.
teacher can easily adapt their example code to be
more generic and to write a multitude of questions,
having the language already known (by teaching it).
The variables defined in the Simple question tab (see
Figure 5) are converted into actual code, and they are
used into expected input and user view. In this tab,
there are more features, like having a graphical inter-
face (by checking that the output is generated by the
code, and it has a graphic interface). Figure 6 presents
a complex graphical question where the expected in-
put is automatically generated by the code and the
user will have to look at the visual representation to
determine what is the output. For a graphical ques-
tion, two new buttons are useful, “Validate code” and
“Preview code”. Those two have been used to reach
the question status “checked”.
3.2.2 Courses Submodule
This submodule takes care of the introduction of new
concepts that could be used by the students. The
teacher can provide an explanation of the concept,
along with a visual way of using it (see Figure 7).
The visual learning consists of having multiple ques-
tions defined in the Question bank that are graphic.
They could also be used for checking how well a con-
cept was received and how easy it is to understand
it by having some questions that could be answered.
A course can be structured in pages and, per page, it
can have multiple entries. One course entry can be
formed from some description, a question (defined in
the Question Bank). The teacher can create and align
the content as he deems necessary, having the option
to split the data into multiple pages.
Figure 7: How a teacher sees the courses.
This app can be used to define a practical learn-
ing system where the theoretical concepts are mixed
with the practical ones, where the user has the possi-
bility to see how every concept is applied and used,
starting with a slow pace until more complex exam-
ples (depending on each the user level). Having the
possibility to see again and again what is happen-
ing along with the description is essential because the
time taken for each information to be understood is
decided by every person. With the option to learn at
any time, having the entire process at hand, the stu-
dent can learn at any time.
Furthermore, one of the initial courses present in
the application is one that introduces Cybersecurity.
Those concepts also leverage the visual representation
for an easier understanding. This course prepares the
students for the Internet, to take care of themselves
and to follow the best practices. It starts by explain-
ing the Cybersecurity world, fundamentals, threats,
security concepts (cryptography and encryption), best
practices and others. One of the categories that repre-
sent an interest is the Vulnerability Management, that
details memory management errors. It teaches about:
dangling pointers, use of freed pointers, buffer over-
flows, memory leaks, etc.. The course helps by con-
solidating the foundation on how to write better code
and what to have in mine for the most secure outcome.
From Syntax to Sketch: Visualizing Code for Enhanced Comprehension with Focus on Cybersecurity
757

3.3 Class Use
To integrate this tool in class requires an initial invest-
ment of time to translate the concepts and exercises
into questions (to be able to use the Evaluation Mod-
ule). This operation will save time in the future be-
cause dynamic questions guarantee that every student
receives different pairs of input-output but with the
same grade of complexity. Each student will be taught
(using courses) and evaluated with the same question,
being able to use the same material for both processes.
For accessing the interpreter, to see that their code
does, students do not need an account, but for tests,
where the results must be stored, both teacher and
students need an account. To ease the register pro-
cess, the application provides a join by link and in-
vite by email, where the teacher just enters the student
emails.
The application was built during the semester,
which means that we got partial, informal and incom-
plete feedback from the students, but they were exited
with the initial variant of the tool. The most exciting
part for them was the visual interpreter. A presenta-
tion video for the tool can be found here (RZData,
2024).
4 IMPLEMENTATION
CHALLENGES
Each student should be able to access the platform in
the same way from personal devices: laptop or phone.
Due to possible slower internet connection, the appli-
cation should minimize the Internet traffic needed and
should maximize the compatibility.
Even though the students watch how each data
structure is translated into its visual representation to
have a better understanding, it is not enough because
after a period of time, when they go through the ma-
terials they only see the final result and some of them
cannot repeat the same process. It is very useful to
standardize the visual representation and also to cre-
ate a more attractive visual representation than the one
drew by the teacher automatically. In this manner,
each student can see what their code does at every
step, and they can see what each instruction does and
how the visual representation looks like.
Furthermore, the process of transforming the
questions into templates and to being able to reuse
them saves a lot of time, but it comes with a price.
Each question needs to store its random data because
for later validation the initial data given to the user is
needed. If the student reloaded the page until he gets
numbers or answers that he knows the answer for, a
behavior like that should not be allowed. If the teacher
marks the question items to be random or the question
order to be random, the question data will be saved
when the user takes the test for the first time. When
the entire test will be evaluated by going through ev-
ery question, the dynamic content that will be checked
against for validating the answers will be the one gen-
erated for that specific user.
5 CONCLUSIONS AND FUTURE
WORK
In conclusion, RZData is a platform that helps with
generation of tests and courses based on generic tem-
plates helps save a lot of time. The visual automatic
visual conversion from the students’ code to the visual
representation helps them understand what is really
happening in their code and how they could under-
stand the concepts. They can see at every step what
is happening, and they can repeat the entire drawing
process how many times they want to really under-
stand what is happening.
Both the language used, and the visual interpreter
can be extended because they are built in a generic
oriented object way. In the future, we will work on
improving the debugging experience: by automating
the next step, so the user can visualize it as a movie,
by adding a break point where the program will stop
its execution upon a given line by the user. The perfor-
mance will be improved and costs reduced by convert-
ing the parsing API server to a WebAssembly module
that is automatically deployed to the users’ browser.
We will search for better ways of integration.
The courses’ submodule can be extended with the
user approval for storing how much time took to un-
derstand something, how much did it take to read the
description and to follow the code. A comparison
could be made between the automatic visual learn-
ing mechanism presented in this paper and the courses
that were used before this platform. It could also pro-
vide a more profound understanding on how fast and
well users understand the materials, and they could
be improved to meet the expected results. For exam-
ple, if a description is very difficult to understand, the
user will try to understand it by staying a larger pe-
riod of time, and it would help the user if it would be
explained better (if possible).
REFERENCES
Bejakovic, P. and Mrnjavac, Z. (2020). The importance of
digital literacy on the labour market. Employee Rela-
CSEDU 2025 - 17th International Conference on Computer Supported Education
758

tions, ahead-of-print.
Cai., K., Henz., M., Low., K., Ng., X., Soh., J., Tang.,
K., and Toh., K. (2023). Visualizing environments
of modern scripting languages. In Proceedings of
the 15th International Conference on Computer Sup-
ported Education - Volume 1: CSEDU, pages 146–
153. INSTICC, SciTePress.
Fracis (2024). Top 7 Dynamic Online Visualization web-
sites for data structures. https://light-city.medium.
com/data-structure-mastery-unleashed-8-dynamic-
online-visualization-platforms-fdc62bcc1225. Ac-
cessed: 2024-10-14.
Galles, D. (2011). Data Structure Visualizations.
https://www.cs.usfca.edu/
∼
galles/visualization/
Algorithms.html. Accessed: 2024-10-14.
Guo, P. (2021). Ten million users and ten years later:
Python tutor’s design guidelines for building scalable
and sustainable research software in academia. In The
34th Annual ACM Symposium on User Interface Soft-
ware and Technology, pages 1235–1251.
Guo, P. J. (2013). Online python tutor: embeddable web-
based program visualization for cs education. In Pro-
ceeding of the 44th ACM technical symposium on
Computer science education, pages 579–584.
Menon, P. (2023). Exploring github copilot assistance for
working with classes in a programming course. Issues
in Information Systems, 24(4).
Meyer, J., Land, R., et al. (2005). Overcoming barriers to
student understanding. Taylor & Francis Limited New
York.
Rosminah, S., md derus, s. r., Mohamad Ali, A. Z., and
Ali, M. (2012). Difficulties in learning programming:
Views of students. In 1st International Conference oo
Current Issues in Education, ICCIE2012.
RZData (2024). Rzdata. https://youtu.be/z2s6N6xw3D0.
Accessed: 2024-11-18.
Shoufan, A. and Mohamed, F. (2022). Youtube and edu-
cation: A scoping review. IEEE Access, 10:125576–
125599.
Sorva, J., Karavirta, V., and Malmi, L. (2013). A review
of generic program visualization systems for introduc-
tory programming education. ACM Transactions on
Computing Education (TOCE), 13(4):1–64.
Strijbol, N., De Proft, R., Goethals, K., Mesuere, B.,
Dawyndt, P., and Scholliers, C. (2024). Blink: An ed-
ucational software debugger for scratch. SoftwareX,
25:101617.
Winkler, R. and Roos, J. (2019). Bringing ai into the class-
room: Designing smart personal assistants as learning
tutors. In Krcmar, H., Fedorowicz, J., Boh, W. F.,
Leimeister, J. M., and Wattal, S., editors, Proceedings
of the 40th International Conference on Information
Systems, ICIS 2019, Munich, Germany, December 15-
18, 2019. Association for Information Systems.
From Syntax to Sketch: Visualizing Code for Enhanced Comprehension with Focus on Cybersecurity
759
