
Emotions and Experiences on the Road: Unveiling UX in Automotive
Infotainment Through YouTube Comments
L
´
ıgia Teixeira
a
, Yago Alencar
b
, Lorena Bastos
c
, Pollyana Rodrigues
d
,
Raquel Pignatelli da Silva
e
and Adriana Lopes Damian
f
Eldorado Research Institute, Brazil
Keywords:
Automotive Infotainment Systems, User Experience (UX), Consumer Opinion, UX Dimensions, Sentiment
Analysis, YouTube Comments, ChatGPT, Natural Language Processing.
Abstract:
Automotive technologies have been advancing, and infotainment systems have become a key component in the
User Experience (UX). Given the complexity of these systems and the diversity of user preferences, consumer
opinions are crucial to analyze satisfaction and overall experience. This paper presents an investigation about
the UX of information system based on consumer opinions. We started our investigation on YouTube plat-
form, collecting comments regarding consumer opinions in review videos from several kinds of infotainment
systems. We analyze comments with the support of sentiment analysis and UX dimensions to characterize user
perceptions about information systems. We adopted a hybrid approach, which combined Natural Language
Processing support and human analysis. Our findings reveal that performance, connectivity, and functionality
issues often result in negative perceptions, while intuitive interfaces and device integration caused positive
experiences. This investigation can address research opportunities for UX of infotainment systems, such as
proposals to support the reduction of negative perceptions, including positive recommendations for the evolu-
tion of these systems.
1 INTRODUCTION
With the advancement of automotive technologies, in-
fotainment systems have increasingly become a core
element of the user experience in modern vehicles
(Lamm and Wolff, 2019). The growing complexity
of these systems, which includes the diverse prefer-
ences of end users, underscores the critical need to
analyze user feedback to identify elements that di-
rectly affect satisfaction and overall user experience
(Krsta
ˇ
ci
´
c et al., 2024).
With regard to the quality of these systems, the
User Experience (UX) can be an important attribute.
The ISO 9421 (DIS, 2010) defines UX as “a person’s
perceptions and responses resulting from the use or
anticipation of using a product”. The UX of a product
is related to pragmatic and hedonic attributes (Has-
a
https://orcid.org/0000-0003-0406-2658
b
https://orcid.org/0009-0002-0488-3982
c
https://orcid.org/0009-0000-1162-3455
d
https://orcid.org/0009-0002-1883-9288
e
https://orcid.org/0009-0006-1203-877X
f
https://orcid.org/0000-0002-0072-6958
senzahl, 2018). Pragmatic attributes consider effec-
tiveness and efficiency in the implementation of the
software, while hedonic attributes are related to the
user’s stimuli and feelings when interacting with the
software.
Researchers have investigated which factors could
affect users’ perception of interaction with a software
product, such as the mental effort expended to use
the product (Hassenzahl and Sandweg, 2004) and pre-
vious experience (Sagnier et al., 2020). However,
evaluating UX requires several users to perform tasks
and highly trained experts (Hedegaard and Simon-
sen, 2014). On the other hand, open sources with
consumer opinions can be a potential support to un-
derstand the UX of several kinds of system. More-
over, sentiment analysis could be applied to quantify
user preferences based on their comments expressed
in natural language (Betancourt and Ilarri, 2020).
In order to characterize the UX regarding info-
tainment systems, we started our investigation on
YouTube platform, collecting comments regarding
consumer opinions in review videos from several
kinds of infotainment systems. This leads us to the
following research questions (RQ):
436
Teixeira, L., Alencar, Y., Bastos, L., Rodrigues, P., Pignatelli da Silva, R. and Damian, A. L.
Emotions and Experiences on the Road: Unveiling UX in Automotive Infotainment Through YouTube Comments.
DOI: 10.5220/0013295700003929
In Proceedings of the 27th International Conference on Enterprise Information Systems (ICEIS 2025) - Volume 2, pages 436-447
ISBN: 978-989-758-749-8; ISSN: 2184-4992
Copyright © 2025 by Paper published under CC license (CC BY-NC-ND 4.0)

RQ1 - How can we analyze user-expressed senti-
ments on YouTube regarding automotive infotain-
ment systems?
RQ2 - What specific experiences with infotainment
systems generate positive or negative perceptions
from the users?
We applied UX dimensions that supported re-
searchers to explore the user perspective in other
products of systems (Hassenzahl and Tractinsky,
2006). In addition, we applied sentiment analysis
to understand user satisfaction and frustrations, char-
acterizing user perceptions as positive and negative.
To support this analysis, we adopted a hybrid analy-
sis method that combines Natural Language Process-
ing (NLP), supported by ChatGPT, and human vali-
dation. ChatGPT has the ability to comprehend and
interpret complex language patterns (Fatouros et al.,
2023), demonstrating effectiveness in sentiment anal-
ysis for a customer review (Mathebula et al., 2024).
Our findings characterized the UX of automotive
infotainment systems, such as performance, connec-
tivity, and functionality issues that resulted in nega-
tive perceptions, while intuitive interfaces and device
integration caused positive experiences. This investi-
gation can address research opportunities for the UX
of infotainment systems.
This research is structured as follows. The Intro-
duction presents the topic and the research objectives.
The background provides a theoretical context, dis-
cussing the pragmatic and hedonic aspects of UX, the
relationship between UX and sentiment analysis, and
the application of these approaches in infotainment
systems. The Methodology describes the methods
used for data extraction, sentiment classification, and
UX dimension analysis, detailing the use of tools such
as ChatGPT and human validation. The Results sec-
tion presents the findings, including sentiment classi-
fication, analysis of UX dimensions divided into prag-
matic and hedonic poles, and categorization of UX
in infotainment systems. In the Discussion, the pa-
per explores how user-expressed sentiments on plat-
forms like YouTube can be analyzed, addressing both
positive and negative experiences, and discussing the
study’s limitations. Finally, the Final Remarks and
Future Works provide a conclusion on the implica-
tions of the results and suggest possible directions for
future research in the areas of UX and sentiment anal-
ysis.
2 BACKGROUND
Automotive infotainment systems integrate function-
alities like GPS navigation, smartphone connectivity,
and multimedia entertainment, significantly influenc-
ing the driving experience for both drivers and passen-
gers (Savolainen, 2022). A detailed understanding of
consumer opinions is essential for refining these sys-
tems to align better with user needs (Hassenzahl and
Tractinsky, 2006; Ouyang et al., 2024).
The use of NLP tools like ChatGPT allows for
rapid and nuanced sentiment analysis, capable of in-
terpreting informal expressions and contextual cues.
While these tools are efficient, human validation re-
mains necessary to ensure accuracy, particularly when
analyzing ambiguous or noisy data (Ouyang et al.,
2024). This hybrid approach combines the strengths
of automated processing with the contextual aware-
ness of human reviewers.
2.1 Related Work
Sentiment analysis has been a valuable tool in UX
research. Martens and Johann (Martens and Johann,
2017) analyzed app reviews on the Apple App Store
to uncover usability challenges and emotional pat-
terns, while Li et al. (Yang et al., 2020) examined e-
commerce product reviews using sentiment lexicons
and deep learning to capture both technical and emo-
tional aspects of user feedback. However, these stud-
ies often rely on structured datasets and do not take
advantage of the potential for spontaneous feedback
from platforms like YouTube. In automotive infotain-
ment, Krsta
ˇ
ci
´
c et al. (Krsta
ˇ
ci
´
c et al., 2023) explored
cognitive load, while Savolainen (Savolainen, 2022)
discussed the balance between information and enter-
tainment, but neither extensively addressed unstruc-
tured user feedback.
Natural Language Processing (NLP) tools, such as
ChatGPT, have demonstrated efficiency in analyzing
large volumes of data, Fatouros et al. (Fatouros et al.,
2023) highlighted its ability to capture nuanced senti-
ments, although Ouyang et al. (Ouyang et al., 2024)
emphasized the need for human validation in ambigu-
ous scenarios to ensure accuracy.
This study differs by using YouTube comments
to capture spontaneous real-world feedback about au-
tomotive infotainment systems. It employs a hybrid
methodology that combines ChatGPT’s NLP capabil-
ities with human validation to ensure precise senti-
ment classification.
2.2 User Experience: Pragmatic,
Hedonic Aspects and Dimensions
User Experience (UX) goes beyond simple function-
ality, encompassing emotional, sensory, and subjec-
tive factors influencing user satisfaction (Norman,
Emotions and Experiences on the Road: Unveiling UX in Automotive Infotainment Through YouTube Comments
437

2004). Hassenzahl and Tractinsky (2006) argue that
UX should be seen as a combination of pragmatic and
hedonic aspects, both essential to creating a complete
and positive experience (Hassenzahl and Tractinsky,
2006). In this context, UX becomes a multidi-
mensional concept, where system functionalities and
emotions triggered by the interaction are equally im-
portant (Forlizzi and Battarbee, 2004).
2.2.1 Pragmatic and Hedonic Aspects
The pragmatic aspects of UX focus on utility and
functional efficiency, addressing the system’s ability
to meet users’ practical needs. These include ease of
use, interface, clarity, and overall usability (Sauro and
Lewis, 2016). In automotive infotainment systems,
this is reflected in intuitive navigation, smartphone in-
tegration, and easy access to entertainment and navi-
gation features (Krsta
ˇ
ci
´
c et al., 2024). Such elements
improve task efficiency, reduce cognitive load, and
improve driving effectiveness.
Hedonic aspects, on the other hand, involve emo-
tions and subjective experiences that arise during in-
teraction, such as visual appeal, emotional engage-
ment, and a sense of control (Norman, 2004). Ac-
cording to the hedonic-pragmatic (Hassenzahl and
Tractinsky, 2006), systems should provide pleasure,
identification, and aesthetic satisfaction beyond ad-
dressing practical needs (Effie Law et al., 2023). In
infotainment systems, personalized interfaces and at-
tractive design are key to fostering emotional bonds
(Savolainen, 2022).
2.2.2 Dimensions of UX
UX dimensions encompass factors that shape the
overall user experience with a system (Law et al.,
2014). Measuring these dimensions helps evaluate
how well a system, such as infotainment, meets func-
tional needs and impacts user emotions (Hassenzahl,
2008).
Hallewell (Hallewell et al., 2022) highlights key
dimensions that influence UX in automotive inter-
faces, including functionality, aesthetics, innovation,
and emotional appeal. User satisfaction relies on bal-
ancing these aspects to meet expectations effectively.
Savolainen (Savolainen, 2022) emphasizes the im-
portance of harmonizing information and entertain-
ment in infotainment systems, ensuring an engaging
experience without compromising functionality. This
balance fosters both practical utility and emotional
satisfaction (Savolainen, 2022).
2.3 UX and Sentiment Analysis
User experience (UX) analysis has been widely stud-
ied across digital contexts, using techniques like sen-
timent analysis to assess user perceptions and emo-
tions from reviews on platforms such as the Play
Store, forums, and social media. This method evalu-
ates both pragmatic and hedonic aspects of UX, iden-
tifying sentiments related to functionality, aesthetics,
and usability (Hassenzahl and Tractinsky, 2006).
For example, Martens and Johann (Martens and
Johann, 2017) analyzed more than seven million re-
views on the Apple App Store, highlighting the role
of emotional sentiment in understanding user satis-
faction and frustration. Similarly, (Yang et al., 2020)
developed a sentiment analysis model that combines
lexicons and deep learning to evaluate e-commerce
reviews, demonstrating how neural networks improve
the detection of emotional patterns. These studies un-
derscore sentiment analysis as a key tool for exploring
hedonic UX by focusing on emotions and pleasure be-
yond technical concerns.
On platforms like YouTube, comments often pro-
vide detailed insights into user experiences, encom-
passing technical aspects and emotional narratives
that reflect real-world usage (Walsh et al., 2014).
This facilitates comprehensive UX analysis, captur-
ing pragmatic elements like usability and efficiency,
alongside hedonic factors such as aesthetic appeal and
emotional engagement (Hallewell et al., 2022).
In automotive infotainment systems, sentiment
analysis of user comments can uncover both usabil-
ity challenges, such as interface issues, and emo-
tional aspects tied to system design and personaliza-
tion (Krsta
ˇ
ci
´
c et al., 2024).
2.4 UX Aspects in Automotive
Infotainment Systems
Automotive infotainment systems integrate function-
alities like GPS navigation, media control, and smart-
phone connectivity to enhance the driving experience.
The challenge lies in balancing ease of use, function-
ality, and emotional satisfaction while ensuring safety
(Savolainen, 2022).
UX in these systems must address pragmatic as-
pects, such as efficiency and interface clarity, along-
side hedonic aspects like aesthetic appeal and person-
alization (Hassenzahl and Tractinsky, 2006). Stan-
dards like ISO 9241-11 (International Organization
for Standardization, 2018) provide criteria for assess-
ing effectiveness and satisfaction in safety-critical au-
tomotive contexts (Krsta
ˇ
ci
´
c et al., 2024).
ICEIS 2025 - 27th International Conference on Enterprise Information Systems
438

Advancements in voice commands and touch in-
terfaces have increased cognitive load, emphasizing
the need for designs that minimize distractions and
ensure seamless interactions (Krsta
ˇ
ci
´
c et al., 2024).
The integration of smartphones through platforms
such as Apple CarPlay and Android Auto enhances
personalization and user satisfaction (Savolainen,
2022).
The success of infotainment systems depends
on achieving a balance between usability, safety,
and emotional engagement, delivering a functional
and enjoyable experience for drivers and passengers
(Diefenbach and Hassenzahl, 2019).
3 METHODOLOGY
The purpose of this study is to analyze the UX of
infotainment systems based on YouTube comments,
and to characterize positive and negative user senti-
ments in relation to UX dimensions proposed in the
literature. Given that, understanding user sentiments
towards automotive infotainment systems is crucial to
improving these technologies and enhancing the over-
all user experience. Through the analysis of user feed-
back from platforms like YouTube
1
, we can gain valu-
able insight into the specific aspects that users appre-
ciate or find frustrating. This motivated us to explore
and classify the sentiments expressed on YouTube
comments. The choice of YouTube as a data extrac-
tion platform was driven by the globalization of com-
ments, allowing us to gather input from individuals
of various nationalities. It also provided a convenient
way to extract honest feedback from real consumers.
The steps for this research were Data Extraction,
Sentiment Classification, and UX Dimensions, as
shown in Figure 1. Each of these steps are detailed
in the following subsections.
3.1 Data Extraction
The data collection process aimed to classify user
sentiments through YouTube comments. Initially, a
search was conducted for videos related to automo-
tive infotainment system reviews. The selection of
videos was based on relevance, popularity, and align-
ment criteria with the target audience of such systems.
Therefore, it was extracted from 35 videos 603 com-
ments of different car models.
In this way, the comments were extracted using a
Python script executed on the Google Colab
2
plat-
1
YouTube: https://www.youtube.com/
2
Google Colab: https://colab.research.google.com
form, which facilitated collaboration among the team
members. This script used YouTube API to access the
video IDs and collect associated comments. Subse-
quently, an additional library was applied to filter the
comments, ensuring that only the most relevant were
retained in the final data frame. This step was essen-
tial to ensure that the data used in the analysis were
meaningful and aligned with the study objectives.
The filtered comments were exported into a
Google Colab CSV file, allowing for easy and sub-
sequent analysis. In total, 603 comments were
extracted, which were then subjected to sentiment
classification using the ChatGPT
3
natural language
model.
3.2 Sentiment Classification
After data extraction, we initiated the sentiment anal-
ysis phase based on the text comments left on the
videos, this stage was divided into two steps: first,
comments were automatically classified using Chat-
GPT; subsequently, a manual validation was con-
ducted to ensure the accuracy of the initial classifi-
cation. This combined process allowed greater con-
sistency and reliability in identifying the sentiments
expressed by the users.
3.2.1 ChatGPT Classification
The initial classification of sentiments (positive, neg-
ative, neutral) was performed automatically by the
ChatGPT model. This model categorizes them into
three groups: positive, negative, and neutral. Based
on the tone and polarity of the user’s expressed opin-
ions. ChatGPT was used to automate this catego-
rization process, facilitating the identification of the
general sentiment within the comments. To work
with ChatGPT sentiment analysis, we used a proposal
based on (Ouyang et al., 2024) that considers these
steps: input, prompt, ChatGPT, responsive and out-
put.
Input. With each iteration, 100 comments were
added for classification.
Prompt. Here is a list of comments. Generate a ta-
ble where column A has an ID starting from one. In
column B, repeat the comment, in column C indicate
the sentiment expressed by the comment by classifying
it as neutral, positive, or negative. Finally, in column
D, add the justification for each classification and dis-
play all classifications.
ChatGPT. Generated a table with ID, comment in
column A, sentiment classification in column C, and
justification for classification in column D.
3
ChatGPT4: https://openai.com/chatgpt/
Emotions and Experiences on the Road: Unveiling UX in Automotive Infotainment Through YouTube Comments
439

Figure 1: Methodology process flowchart.
Responsive. Here is the complete sentiment analysis
content.
Output. Table with ID, comment, classification, and
justification. See in (Teixeira et al., 2024) more de-
tails.
ChatGPT4 classified 100 comments per iteration,
which requires seven iterations to complete the pro-
cess. A re-evaluation was followed to check for
changes, but none were detected.
3.2.2 Human Validation
Human validation played a crucial role in correcting
errors made by the automatic model, ensuring greater
accuracy in sentiment classification, particularly in
ambiguous or complex texts. It helps filter out irrel-
evant information, ensuring that the final data is re-
liable and accurately reflect the sentiments of these
users.
Figure 2 illustrates the validation process, high-
lighting how the reviewers assessed the automatic
classification results, corrected inconsistencies, and
improved the precision of the study to ensure the qual-
ity and reliability of the final data. In this review, we
invited four UX experts and two researchers.
The process of validating automatic classification
of comments begins with the output generated by
ChatGPT. This workflow ensures that the classifica-
Figure 2: Human validation of the automatic classification.
tion is accurate through a series of steps involving the
participants to review all the classification.
The first step involved importing all the comments
to Google sheets. After this, we divided the comments
to analyze them.
The comments were distributed as follows: neu-
tral (343) comments were assigned to six reviewers,
while positive (135) and negative (125) comments
were assigned to three reviewers.
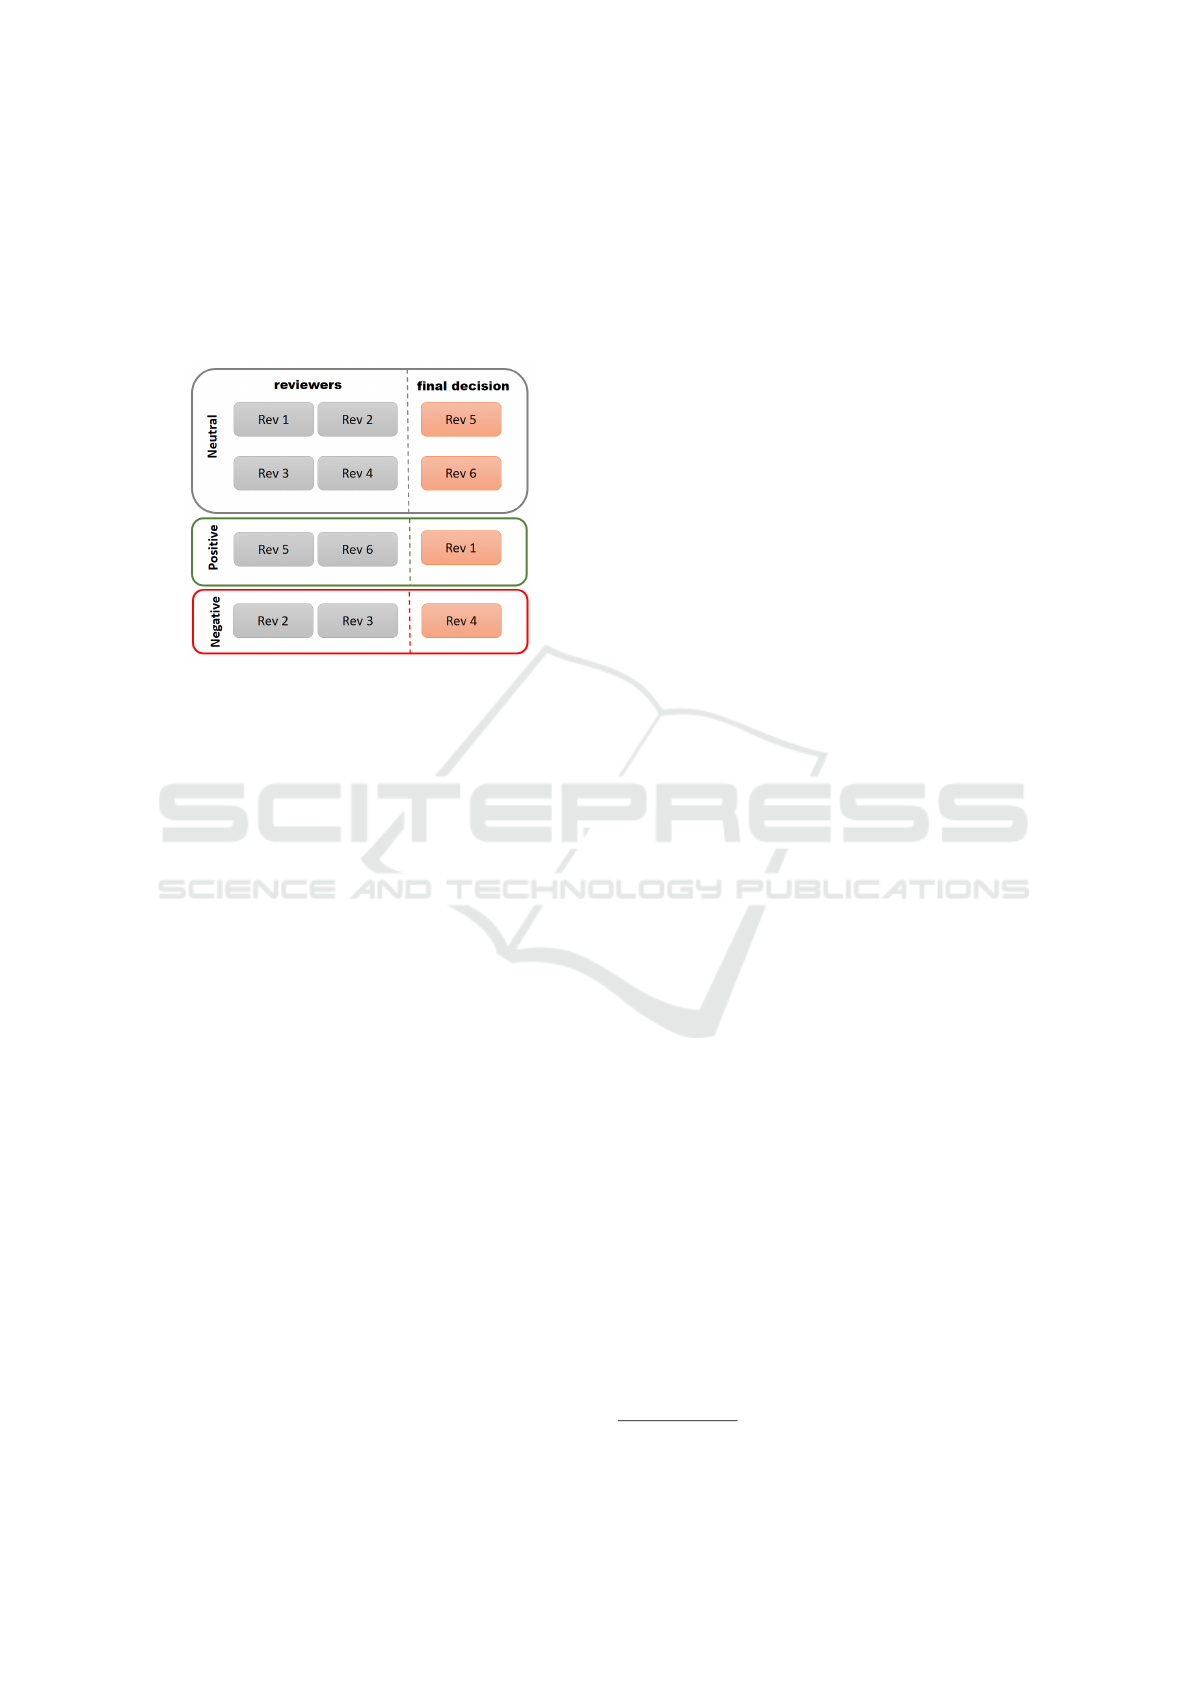
Figure 3 shows the division of reviewers and each
step in which the participants conducted the reviews.
ICEIS 2025 - 27th International Conference on Enterprise Information Systems
440
The review method adopted will be detailed in the
next steps.
First Phase Validation. After grouping the com-
ments, two independent reviewers, Rev1 and Rev2
(highlighted in gray in Figure 3), independently eval-
uated the same set, confirming or contesting the initial
ChatGPT classification.
Figure 3: Human reviewers division.
Second Phase Validation. After Rev1 and Rev2
complete their assessments, the classification is val-
idated if they agree. If they disagree, a second valida-
tion phase is required, involving Rev3 (highlighted in
orange in Figure 3) to resolve discrepancies and en-
sure consensus.
Revised Automatic Classification. After resolving
disagreements in the second phase or achieving agree-
ment in the first, the final step was revising the auto-
matic classification. This revised version represents
the final outcome, combining automated and human-
reviewed assessments.
After the final classification was completed, the
research focused on analyzing the UX dimensions of
only positive and negative comments.
3.3 UX Dimensions Classification
During the UX dimensions classification stage, we fo-
cused on comments classified as positive or negative,
excluding neutral comments due to their inconclusive
nature, which hindered clear analysis and interpreta-
tion. Our objective was to categorize these comments
according to the pragmatic and hedonic dimensions of
the user experience. This stage consisted of two steps:
automatic classification using ChatGPT and followed
by human validation.
Following the Hassenzahl methodology (Hassen-
zahl and Tractinsky, 2006), we categorized 189 com-
ments on pragmatic and hedonic aspects.
Pragmatic Dimensions. include usability, which rep-
resents the perceived ease of use by users, and utility,
which relates to the functional or utilitarian value of
content.
Hedonic Dimensions. encompass stimulation, refer-
ring to the entertainment and engagement potential
offered by the content; identification, which reflects
the ability of the content to personally resonate with
users; and evocation, which focuses on how the con-
tent evokes memories or emotions in users.
3.3.1 ChatGPT Classification
We used ChatGPT to perform a preliminary classifi-
cation of the comments, associating them with poles
and UX dimensions described above. This step was
essential to streamline the analysis and provide an ini-
tial basis for validation following these steps:
Input. With each iteration, 30 comments were added
for classification with their ID.
Prompt. Classify the comments below between Has-
senzahl’s pragmatic and hedonic poles in column C,
also classifying the dimensions between (Usability,
Utility, Stimulation, Identification, and Evocation) in
column D, with the justification of why they were clas-
sified in this way.
ChatGPT. Processed the prompt with input and gen-
erated a table with ID, comment, pole, UX dimension,
and justification.
Responsive. Classification of each comment, consid-
ering Hassenzahl’s pragmatic and hedonic poles, di-
mensions, and their respective justifications.
Output. Table with ID, comment, pole classification,
UX dimension, and justification. See (Teixeira et al.,
2024) for more details.
3.3.2 Human Validation
After automated classification, a human validation
process was performed to improve the precision and
consistency of the results. A total of 189 comments
were evenly distributed among three reviewers, with
each reviewer assigned to validate the automated clas-
sification of 63 comments.
The reviewers assessed the comments using pre-
defined criteria, guided by the descriptions of the
poles (pragmatic and hedonic) and UX dimensions.
During this process, 30 cases of disagreement arose,
primarily due to subjective interpretations or ambigu-
ities in the content of the comments.
Furthermore, 11 comments, although displaying
positive or negative sentiment, could not be attributed
to any specific pole or UX dimension due to insuffi-
cient contextual indicators.
The disagreement cases were discussed in an on-
line meeting conducted via the Google Meet
4
plat-
4
Google Meet: https://meet.google.com
Emotions and Experiences on the Road: Unveiling UX in Automotive Infotainment Through YouTube Comments
441
form. During this session, the reviewers presented
their arguments, and the group reached a consensus
based on the established criteria and the contextual
evidence provided by the comments.
Ultimately, the 30 disputed comments were col-
lectively reclassified to the most appropriate pole and
UX dimension, and 11 comments were excluded due
to insufficient context for meaningful classification.
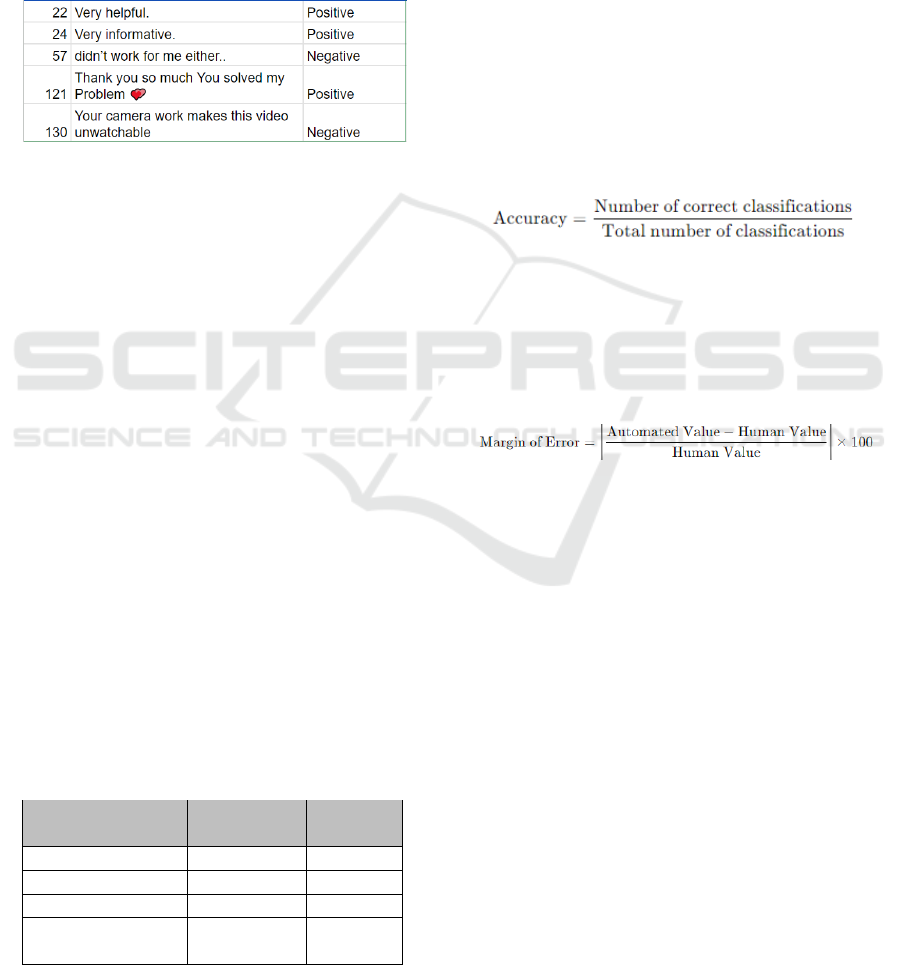
See an example in Figure 4 of a sentimental comment
but lacking enough context to identify a pole and UX
dimension.
Figure 4: Example of comment with sentiment but lacking
enough context to classify pole and UX dimension.
For more details, see the supplementary material
available (Teixeira et al., 2024).
4 RESULTS
This section describes the results, detailing our find-
ings for this research.
4.1 Sentiments Classification
The UX specilists began by reviewing the 343 com-
ments classified as neutral by the model, followed
by 135 positive and 125 negative comments. This
process aimed to validate the model classifications
and ensure accurate alignment with the content of the
comments. When discrepancies were found between
the model and human evaluation, the comments were
manually reclassified.
After human validation, a total of 414 comments
were reclassified as neutral, 61 positive and 128 neg-
ative. See in table 1.
Table 1: Comparison of Sentiment Analysis by Automated
and Human Methods.
Sentiment Automated Human
Analysis Analysis
Neutral 343 414
Positive 135 128
Negative 125 61
Total Comments 603 603
Analyzed
In this way, it is possible to see some discrepancies
between automated and human analyses.
For neutral sentiment, the human analysis identi-
fied more comments (414) than the automated anal-
ysis (343). This suggests that the automated method
may be underestimating neutral comments, possibly
misclassifying them as positive or negative.
In the case of positive and negative sentiments, the
automated method classified more comments as pos-
itive (135 vs. 128) and negative (125 vs. 61) com-
pared to human analysis. This may indicate a ten-
dency for the automated model to classify comments
with a stronger polarity, potentially being less conser-
vative than human analysis.
Based on the final results, we used the formula
shown in Figure 5 to calculate the overall accuracy of
the automated sentiment classification, which reached
88.3% . This result demonstrates the effective contri-
bution of ChatGPT to this study.
Figure 5: Accuracy Formula applied in the study.
For a more accurate analysis, it was necessary to
apply the margin of error, as shown in the formula
in Figure 6, for each sentiment category. The results
were: neutral (17.15%), positive (5.47%), and nega-
tive (104.92%).
Figure 6: Margin of Error Formula applied in the study.
The ChatGPT-based automated method showed
high accuracy and efficiency for large-scale sentiment
analysis. However, human validation is vital for nu-
anced interpretations. The largest error margin in
the negative category reveals significant discrepancies
with human analysis.
4.2 UX Dimensions
After identifying 11 comments excluded due to insuf-
ficient context for proper classification and 30 reclas-
sifications during human analysis. As a result, the
analysis was finalized with 178 comments classified
with their respective poles and dimensions. In this
table 2 we can analyze the distribution of the dimen-
sions of user experience (UX) across the pragmatic
and hedonic poles.
ICEIS 2025 - 27th International Conference on Enterprise Information Systems
442
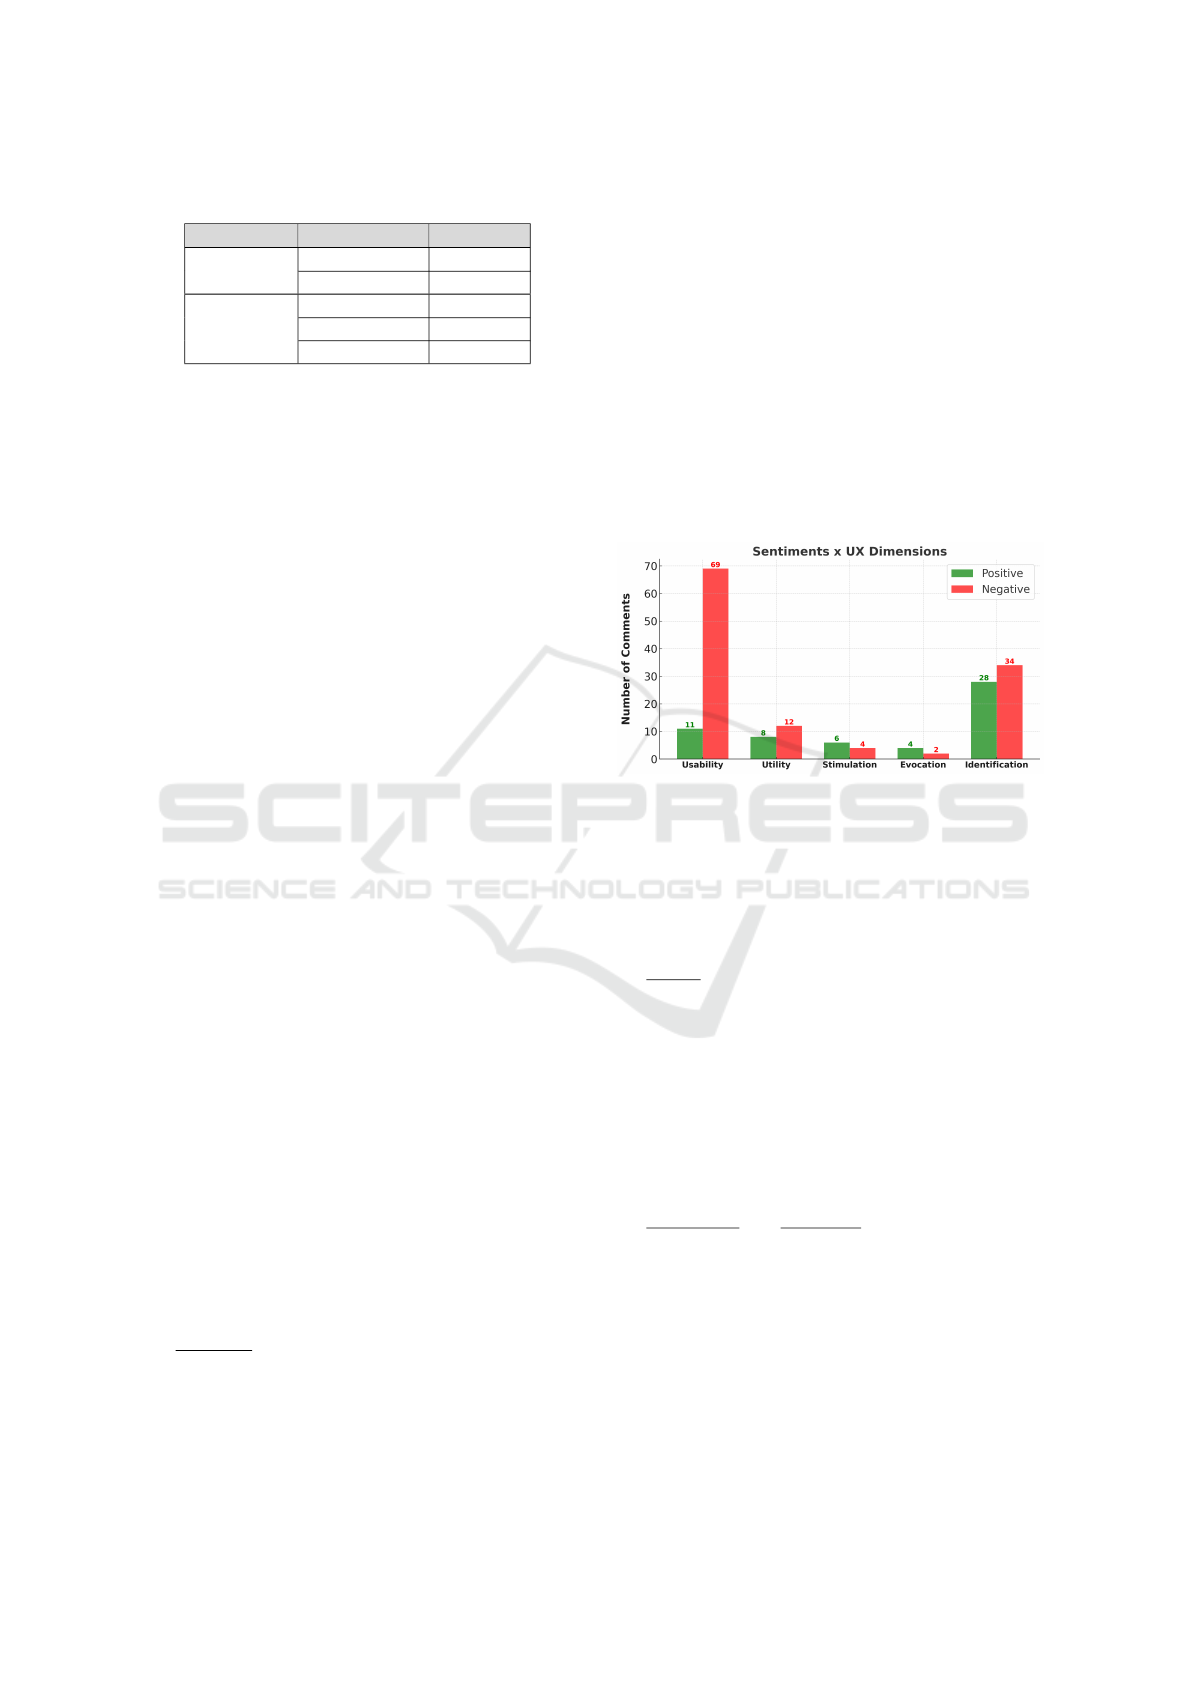
Table 2: Quantification of UX Dimensions and Their Poles.
Pole Dimension Quantity
Pragmatic Usability 80
Utility 20
Hedonic Stimulation 10
Evocation 6
Identification 62
4.2.1 Pragmatic Pole
The pragmatic pole consists of Usability and Utility,
which together account for a total of 100 occurrences.
This suggests that users place a significant emphasis
on the functional and practical aspects of the content.
Usability (80). The high number of mentions reflects
the importance users place on ease of use. Usability
appears to be a critical factor that attracts both praise
and critique.
Utility (20). Although mentioned less frequently,
utility remains essential. Users are likely to evaluate
the extent to which the content meets their practical
needs.
4.2.2 Hedonic Pole
The hedonic pole, including stimulation, evoca-
tion, and identification, accounts for 78 occurrences.
This indicates that emotional engagement and per-
sonal connection are also important to users.
Stimulation (10). Stimulation garnered the fewest
mentions, suggesting that the content may not con-
sistently engage or excite users.
Evocation (6). With just six mentions, evocation
seems to play a minor role in user engagement, al-
though it succeeded in eliciting positive emotions for
a subset of users.
Identification (62). Identification, on the other hand,
received substantial attention. Many users connected
with the content on a personal level, sharing values or
experiences.
4.3 UX Categories for Infotainment
Systems
The Figure 7 summarizes user sentiment across UX
dimensions, detailing experience categories identified
in the comments. For this study, car brands and phone
names were omitted, instead referred to as Car1,
Car2, and others, as well as Phone1 and Phone2.
Usability
received the highest number of negative
comments (69), suggesting frequent frustrations with
the following categories of user experience:
Connectivity:
”Does not work when out of internet reach and No
wi fi... Don’t by. Stop lying Car13. . . ”.
”To connect CarPlay it ask me use usb but it seems
like it ask for original usb cable for Phone 2...”.
Performance
”Makes no difference. Still looks as slow and
laggy as the older Car10 units from earlier cars. Total
crap”.
”The worst infotainment system. Slow”.
Functionality
”My media just stopped working”.
”On my car12 the second page of shortcuts is
missing i have just the first page”.
Figure 7: Correlation of Sentiments with UX Dimensions.
Regarding positive aspects, most refer to Appear-
ance and Satisfaction, for instance:
“Hi! It is nice that you found the 3D view for sat
nav. . . ”.
”Just used the Car6 as a rental. It was easy and
simple to use”.
Utility also leaned toward negative comments.
We noticed negative comments that affected the util-
ity of this type of systems, such as Touch and But-
tons for interface interaction not clearly, Lack of In-
formation for the widgets, and Technical Failures in
the use of infotainment as follow:
”My Uncle’s Car was a complete write-off be-
cause the Infotainment Screen died”.
”Worst car tech are the big fugly touchscreens...
we just need a place for our phone not a crap screen
which is outdated 3 years later”.
Stimulation and Evocation generated fewer com-
ments, with relatively balanced sentiment. In terms of
comments, most of them are related to the user per-
spectives to get this type of system. Regarding user
experience, we observed positive comments regarding
the Infotainment Systems in General and the use of
Known Technologies, such as Google Maps:
”Car13 uses Google Maps as its inbuilt naviga-
tion? Thats amazing in itself tbh just like a Car1”.
”Great to see the car in actual driving mode...”.
Emotions and Experiences on the Road: Unveiling UX in Automotive Infotainment Through YouTube Comments
443

Regarding Identification, it demonstrated a nearly
equal division between positive (28) and negative (34)
comments. Regarding positive comments, the major-
ity of experiences express Positive Experiences with
the use of infotainment:
”I personally love the clear and simple look of the
system”.
”I love everything about the Car2 system”.
Furthermore, we noticed negative comments re-
garding the Car Interface, a category related to
Driver Safety, as demonstrate the following com-
ments:
Car Interface
”I don’t agree with Car1 removing every button in
the car especially with the stalks...”
”No attractive colours... Why dont you provide
Black and Dark blue colours??”.
Driver Safety
”All these people complain about driving “dis-
tracted” probably text and swerve on a daily basis...”.
”This thing is a joke. I wonder how many acci-
dents it has caused”.
The findings highlight Usability, Utility, and
Evocation as key areas of improvement due to higher
negative feedback. Despite predominantly positive
sentiment, Evocation also presents opportunities for
improvement. Stimulation and Identification show
balanced sentiment but still offer potential to enhance
engagement. In general, balancing pragmatic and he-
donic elements is essential to improve user experi-
ence.
5 DISCUSSION
This study underscores the importance of balancing
pragmatic and hedonic aspects to enhance UX in in-
fotainment systems. Positive experiences stemmed
from intuitive interfaces and seamless device integra-
tion, while connectivity issues and system responsive-
ness were common pain points.
The hybrid approach of combining ChatGPT with
human validation proved effective for sentiment anal-
ysis, though limitations in NLP tools highlight the
need for further refinement. Future work should ex-
plore cultural and regional differences in UX percep-
tions and refine NLP models to address nuanced sen-
timents like sarcasm and irony.
5.1 How Can We Analyze
User-Expressed Sentiments on
YouTube Regarding Automotive
Infotainment Systems?
Analyzing user-expressed sentiments on YouTube
regarding automotive infotainment systems can be
achieved through a combination of sentiment analysis
and UX dimension classification. In addition, Chat-
GPT classifications can support this analysis. Some
lessons learned are summarized below.
5.1.1 NLP Classification
With support of NLP model, such as ChatGPT, it fa-
cilitate the comments classification into sentiments
neutral, positive and negative. The classifications
considered each dimension, including pragmatic and
hedonic aspects. We noticed patterns to identify fre-
quent pain points or appreciated features. For in-
stance, if usability issues like connectivity are a com-
mon negative topic, this could indicate a need for de-
sign improvements.
The automated sentiment classification achieved
an overall accuracy of 88.3%, highlighting the signif-
icant contribution of ChatGPT to the success of this
study.
5.1.2 Human Validation
To improve accuracy, incorporate human validate, es-
pecially for ambiguous or nuanced comments such as:
sarcasm or complex language. Having UX experts
validate a portion of comments ensures higher relia-
bility and corrects potential misclassifications.
Regarding UX dimensions, for instance, com-
ments about ease of use or functional issues could
fall under usability or utility, while those reflecting
personalization or emotional responses might relate
to identification or evocation.
5.1.3 Data Analysis and Visualization
Regarding data analysis, we have the following rec-
ommendations:
Quantitative Analysis. Calculate the distribution of
sentiments with each UX dimensions. This step helps
reveal how users generally feel about each aspect,
showing which dimension receives more positive or
negative feedback.
Visualization. Use charts, tables or flowchart to vi-
sually represent sentiment distribution across dimen-
sions. This visualization provides an at-a-glance un-
derstanding of which UX aspects require attention.
ICEIS 2025 - 27th International Conference on Enterprise Information Systems
444

Insights for Developments. Use the findings to make
recommendations for infotainment system improve-
ments, focusing on areas that most strongly affect user
satisfaction. For instance, if users express frustration
with response time, this feedback can guide perfor-
mance optimization efforts.
Tracking Changes Over Time. If the analysis is
repeated periodically, it can help monitor user sen-
timents as new updates or system improvements are
released, offering a measure of UX impact for each
iteration.
Combining automated tools with human valida-
tion and structuring findings around UX dimensions
creates a comprehensive understanding of user senti-
ment, offering actionable insights into both functional
and emotional user needs. This led us to identify the
following findings:
Keys findings of RQ1
• Automated Classification and Human
Validation: ChatGPT’s initial classification was
effective, but human validation was essential to
refine accuracy, especially for nuanced expressions
like sarcasm.
• UX Dimensions: Categorizing comments into
UX dimensions (usability, utility, stimulation,
identification, evocation) enabled a detailed
analysis of pragmatic and hedonic aspects.
• Sentiment Visualization and Quantification:
Quantitative and visual analysis helped identify
patterns in UX dimensions, highlighting areas of
positive and negative feedback for design
improvements.
5.2 What Specific Experiences with
Infotainment Systems Generate
Positive or Negative Perceptions
from the Users?
The experience of users with automotive infotainment
systems typically leads to positive or negative percep-
tions based on both functional and emotional factors.
Here are some key aspects that often drive these per-
ceptions.
5.2.1 Positive Experiences
The following are the main factors of positive experi-
ences.
Ease of Use and Intuitive Interface. Users value
infotainment systems that are easy to navigate, with
clear menus and accessible controls. Intuitive layouts
and minimal steps for common tasks are highly ap-
preciated.
Seamless Connectivity. Reliable connections with
devices like smartphones-via Bluetooth, USB, or in-
tegrations like Apple CarPlay and Android Auto-
enhance user satisfaction. Fast, consistent connec-
tions without frequent repairs are valued.
Performance and Responsiveness. Fast loading
times and smooth transitions improve user perception.
Systems with minimal lag and seamless multitasking
enhance the experience.
Personalization Options. Customizable interfaces-
like setting preferred apps and adjusting layouts-
enhance user experience. Systems that adapt to in-
dividual preferences improve usability.
Aesthetic Design and Visual Appeal. A visually
appealing design with modern, clean graphics en-
hances engagement. High-resolution screens and
user-friendly color schemes improve readability and
create a pleasant experience.
Voice Command Accuracy. Accurate voice recogni-
tion that understands natural language enhances con-
venience and safety by reducing manual input while
driving.
5.2.2 Negative Experiences
The following are the main factors of negative expe-
riences.
Connectivity Issues. Systems that struggle to main-
tain a stable connection with smartphones or other
devices are often sources of frustration. Users fre-
quently complain when connections are dropped, do
not sync, or require complex pairing processes.
Slow or Unresponsive Interface. Long loading
times, lag responses, or freezes during operation lead
to a negative user experience. Users especially notice
these issues when they interfere with core functions,
such as navigation or audio playback.
Complex or Overly Intricate Interface. Interfaces
that require multiple steps for simple tasks or have
cluttered layouts contribute to user dissatisfaction.
When critical functions are difficult to locate or use
while driving, users often report frustration and dis-
satisfaction.
Lack of Compatibility with Devices or Apps. Lim-
ited compatibility with popular apps, such as stream-
ing services, or with newer smartphone models can
be disappointing for users, especially those who ex-
pect seamless integration with commonly used tools.
Frequent Software Bugs or Crashes. Unreliable
performance, including bugs, crashes, and unintended
reboots, harms the user experience. Technical fail-
ures, especially unpredictable ones, reduce satisfac-
tion and erode trust in the system.
Emotions and Experiences on the Road: Unveiling UX in Automotive Infotainment Through YouTube Comments
445

Distracting or Overlay Complicated Visuals. In-
fotainment systems with animations or flashy visuals
can be distracting for drivers. Users prefer simple,
clean interfaces that maintain focus on driving.
Inconsistent Voice Recognition. Inaccurate voice
commands or overly precise wording frustrates users.
Poor recognition requiring repetitive commands re-
duces convenience.
Poor Feedback on Navigation and Safety Features.
Systems lacking clear navigation prompts or inter-
rupting safety interactions are often criticized. Users
value infotainment systems that support safe driving
rather than disrupt it. Positive perceptions are influ-
enced by usability, responsiveness, personalization,
and aesthetics, while negatives stem from technical,
connectivity, and interface issues. Addressing these
challenges enhances user satisfaction and driving ex-
periences. Key findings include:
Keys findings of RQ2
• Positive Perceptions - Intuitive Interface and
Integration: Intuitive interfaces and seamless
integration with devices, such as smartphones,
foster a positive user experience. When
infotainment systems are easy to navigate and
connect, users report high satisfaction.
• Negative Perceptions - Connectivity and
Performance Issues: connectivity problems, slow
performance, and lack of responsiveness are key
sources of frustration. Frequent comments
highlight that device connection failures and
unstable performance are problematic for users.
• Impact of Functionality and Personalization:
The ability to personalize the interface and adapt
the system to user preferences enhances positive
experiences. Conversely, overly complex or
cluttered interfaces negatively affect satisfaction,
especially when they hinder navigation.
5.3 Limitations
This study offers valuable insight into UX in auto-
motive infotainment systems via YouTube comment
analysis but has notable limitations.
First, sentiment analysis combined ChatGPT with
human validation. Although ChatGPT effectively
identifies general sentiment, it struggles with nuances
such as sarcasm, irony, and context-specific language.
Human validation addressed some of these issues, but
highlighted the limitations of NLP tools when analyz-
ing unstructured, informal online language.
Second, the study relied solely on YouTube as
a feedback source. As a platform, YouTube at-
tracts a specific audience, which may not represent
the broader demographic of automotive infotainment
users. Self-selection bias is also a concern, as com-
mentators often express strong opinions, potentially
excluding more neutral perspectives.
Furthermore, the study did not account for re-
gional or cultural differences in user feedback, which
can influence sentiment interpretation and UX expec-
tations. Cultural factors may affect perceptions of
usability, aesthetics, and functionality, which under-
scores the need for future research to explore these
variations.
Lastly, the UX dimension framework used (Has-
senzahl and Tractinsky, 2006), while comprehensive,
may not fully capture the unique interactions and
safety considerations of automotive systems. A spe-
cialized UX model tailored to the automotive context
could enhance analysis.
These limitations highlight the need for future re-
search using more diverse data sources, advanced sen-
timent analysis tools, and region-specific UX models
to better understand user experiences in demograph-
ics and cultural contexts.
6 FINAL REMARKS AND
FUTURE WORKS
This research emphasizes the balance of functionality
and emotional involvement in shaping user percep-
tions of automotive infotainment systems. Effective
design must prioritize usability, connectivity, and per-
sonalized experiences. Combining ChatGPT with hu-
man validation improves sentiment classification, but
exposes limitations in handling nuances like sarcasm,
highlighting the need for refinement.
User feedback helps manufacturers adapt systems
to diverse needs, enhancing satisfaction and loyalty.
However, the study sample limits generalizability and
future research should explore cultural and regional
influences to guide inclusive and adaptable designs.
Addressing challenges such as anonymity, sar-
casm, and error margins in sentiment analysis is cru-
cial to advancing NLP tools. Efforts must focus on
reducing negative perceptions, offering constructive
recommendations, and embracing cultural diversity to
improve global relevance and user adoption.
REFERENCES
Betancourt, Y. and Ilarri, S. (2020). Use of text mining
techniques for recommender systems. In Proceedings
ICEIS 2025 - 27th International Conference on Enterprise Information Systems
446

of the 22nd International Conference on Enterprise
Information Systems (ICEIS 2020), pages 780–787.
SciTePress.
Diefenbach, S. and Hassenzahl, M. (2019). Combining
model-based analysis with phenomenological insight:
A case study on hedonic product quality. Qualitative
Psychology, 6(1):3–23.
DIS, I. (2010). 9241-210 2010. ergonomics of human sys-
tem interaction-part 210: Human-centred design for
interactive systems. standard. International Organi-
zation for Standardization, Tech. rep. International.
Effie Law, E., Vermeeren, A., Hassenzahl, M., and
Blythe, M. (2023). The hedonic/pragmatic
model of user experience. Towards a UX
Manifesto. Available online: http://www.
academia. edu/2880396/The hedonic pragmatic
model of user experience (accessed on 04 October
2024).
Fatouros, G., Soldatos, J., Kouroumali, K., Makridis, G.,
and Kyriazis, D. (2023). Transforming sentiment anal-
ysis in the financial domain with chatgpt. Machine
Learning with Applications, 14:100508.
Forlizzi, J. and Battarbee, K. (2004). Understanding experi-
ence in interactive systems. In Proceedings of the 5th
Conference on Designing Interactive Systems, pages
261–268.
Hallewell, M. J., Large, D. R., Harvey, C., Briars, L., Evans,
J., Coffey, M., and Burnett, G. (2022). Deriving UX
dimensions for future autonomous taxi interface de-
sign. Journal of Usability Studies, 17(4):140–163.
Hassenzahl, M. (2008). User experience (ux): Towards
an experiential perspective on product quality. In
Proceedings of the 20th Conference on l’Association
Francophone d’Interaction Homme-Machine, pages
11–15. ACM.
Hassenzahl, M. (2018). The thing and i: understanding the
relationship between user and product. Funology 2:
from usability to enjoyment, pages 301–313.
Hassenzahl, M. and Sandweg, N. (2004). From mental ef-
fort to perceived usability: transforming experiences
into summary assessments. In CHI’04 extended ab-
stracts on Human factors in computing systems, pages
1283–1286.
Hassenzahl, M. and Tractinsky, N. (2006). User experience
– a research agenda. Behaviour & Information Tech-
nology, 25(2):91–97.
Hedegaard, S. and Simonsen, J. G. (2014). Mining until
it hurts: automatic extraction of usability issues from
online reviews compared to traditional usability eval-
uation. In Proceedings of the 8th Nordic Conference
on Human-Computer Interaction: Fun, Fast, Founda-
tional, pages 157–166.
International Organization for Standardization (2018). Iso
9241-11: Ergonomics of human-system interaction -
part 11: Usability: Definitions and concepts. https:
//www.iso.org/standard/63500.html.
Krsta
ˇ
ci
´
c, R.,
ˇ
Zu
ˇ
zi
´
c, A., and Orehova
ˇ
cki, T. (2024). Safety
aspects of in-vehicle infotainment systems: A system-
atic literature review from 2012 to 2023. Electronics,
13(13):2563.
Krsta
ˇ
ci
´
c, R.,
ˇ
Zu
ˇ
zi
´
c, A., and Orehova
ˇ
cki, T. (2023). Safety
aspects of in-vehicle infotainment systems: A system-
atic literature review from 2012 to 2023. Journal of
Safety Research.
Lamm, L. and Wolff, C. (2019). Exploratory analysis of
the research literature on evaluation of in-vehicle sys-
tems. In Proceedings of the 11th International Con-
ference on Automotive User Interfaces and Interactive
Vehicular Applications, pages 60–69.
Law, E. L.-C., van Schaik, P., and Roto, V. (2014). At-
titudes towards user experience (ux) measurement.
International Journal of Human-Computer Studies,
72(6):526–541.
Martens, D. and Johann, T. (2017). On the emotion of users
in app reviews. In Proceedings of the International
Conference on Empirical Software Engineering and
Measurement (ESEM), pages 1–10. IEEE.
Mathebula, M., Modupe, A., and Marivate, V. (2024). Chat-
gpt as a text annotation tool to evaluate sentiment anal-
ysis on south african financial institutions. IEEE Ac-
cess, 12:10782–10790.
Norman, D. A. (2004). Emotional Design: Why We Love
(or Hate) Everyday Things. Basic Books, New York.
Ouyang, T., MaungMaung, A., Konishi, K., Seo, Y., and
Echizen, I. (2024). Stability analysis of chatgpt-
based sentiment analysis in ai quality assurance. arXiv
preprint arXiv:2401.07441.
Sagnier, C., Loup-Escande, E., and Vall
´
ery, G. (2020). Ef-
fects of gender and prior experience in immersive user
experience with virtual reality. In Advances in Usabil-
ity and User Experience: Proceedings of the AHFE
2019 International Conferences on Usability & User
Experience, and Human Factors and Assistive Tech-
nology, July 24-28, 2019, Washington DC, USA 10,
pages 305–314. Springer.
Sauro, J. and Lewis, J. R. (2016). Quantifying the User Ex-
perience: Practical Statistics for User Research. Mor-
gan Kaufmann, Cambridge, MA.
Savolainen, R. (2022). Infotainment as a hybrid of informa-
tion and entertainment: a conceptual analysis. Journal
of documentation, 78(4):953–970.
Teixeira, L., Alencar, Y., Bastos, L., Rodrigues, P.,
Pignatelli da Silva, R., and Lopes Damian, A.
(2024). Supplementary material: Emotions and
experiences on the road. https://figshare.com/s/
49b156c2f58125db07e6?file=51834908.
Walsh, T., Varsaluoma, J., Kujala, S., Nurkka, P., Petrie, H.,
and Power, C. (2014). Axe ux: Exploring long-term
user experience with iscale and attrakdiff. In Proceed-
ings of the 18th international academic mindtrek con-
ference: Media business, management, content & ser-
vices.
Yang, L., Li, Y., Wang, J., and Sherratt, R. S. (2020). Senti-
ment analysis for e-commerce product reviews in chi-
nese based on sentiment lexicon and deep learning.
IEEE Access, 8:23522–23530.
Emotions and Experiences on the Road: Unveiling UX in Automotive Infotainment Through YouTube Comments
447
