
Identification of Traffic Bottlenecks in Central Dhaka Through
Spreading Graph-Based Congestion Analysis
Manash Sarker
a
, Kazi Sakib
b
and Naushin Nower
c
Institute of Information Technology, University of Dhaka, Dhaka, Bangladesh
{manash, sakib, naushin} @iit.du.ac.bd
Keywords:
Bottleneck, Congestion Spreading, Dhaka City.
Abstract:
The persistent traffic congestion in Dhaka, Bangladesh, calls for innovative and efficient solutions tailored
to its unique urban dynamics. This study introduces a novel approach to traffic bottleneck identification that
combines congestion levels and their potential to spread, addressing the critical need for targeted traffic man-
agement. Our methodology integrates traffic data collection through Google Maps snapshots, congestion
intensity mapping, congestion spreading graphs (CSG), maximal spanning trees (MST), and applying Na
¨
ıve
Bayes’ theorem to calculate congestion costs. These tools identify bottlenecks by quantifying both congestion
impact and propagation costs within the urban road network. Key findings highlight three major bottlenecks:
Kawran Bazar, Mohammadpur Bus Stand, and Dhanmondi 32 intersections, validated using the SUMO sim-
ulation platform. These points exhibit significant congestion spread and network-wide delays. The proposed
methodology not only identifies critical bottlenecks effectively but also offers actionable insights for urban
planners and policymakers to devise targeted interventions. This research bridges existing gaps, providing a
cost-effective, adaptable framework for mitigating traffic challenges in resource-constrained cities like Dhaka.
1 INTRODUCTION
An intelligent transportation system (ITS) aims to of-
fer significant advancements for enhancing the func-
tionality of a public transportation system; neverthe-
less, the magnitude of these advantages may be con-
strained by several aspects and difficulties. Traffic
congestion is one of them, which impacts nearly ev-
ery aspect of urban life, from daily commuting to
the cost of living. For example, in the USA, trav-
elers spend about seven billion additional hours (42
hours per traveler) locked in their cars every year, as
well as it also costs billions in Europe (Jamil et al.,
2020). In Dhaka, Bangladesh, one of the world’s most
densely populated cities with over 20 million resi-
dents, the impact of traffic congestion is even more
pronounced (Macrotrends, 2024). Traffic congestion
costs five million working hours every day, leading
to an annual loss of 200- 550 billion BDT in Dhaka
city (Haider, 2018), (Ali et al., 2022). This challenge
is only expected to grow as Dhaka’s population con-
tinues to rise, placing even more strain on the city’s
a
https://orcid.org/0009-0009-9622-8352
b
https://orcid.org/0009-0002-0514-7362
c
https://orcid.org/0000-0001-5640-829X
transport infrastructure.
One of the main contributors to traffic conges-
tion is bottlenecks—specific points where the road is
always congested and capacity is heavily restricted,
causing delays and impeding the smooth flow of ve-
hicles (Hale et al., 2016). (Administration, nd) indi-
cates that bottlenecks are the leading cause of traf-
fic congestion, contributing 40% of significant fac-
tor, followed by traffic incidents (25%), bad weather
(15%), work zones (10%), poor signal timing (5%),
and special events or other factors (5%). Thus, it
indicates that the bottleneck is the major source of
traffic congestion. Based on the reason for the oc-
currence, a bottleneck can be classified into two cat-
egories: i) recurrent and ii) non-recurrent bottleneck.
Demand fluctuations, network topologies, off-ramps,
on-ramps, poor road alignment, road width narrow-
ing, etc, cause recurrent bottlenecks. On the other
hand, nonrecurrent bottlenecks are caused by random
and unpredictable events (Yuan et al., 2014).
There are extensive studies on traffic signal con-
trol, signal optimization, and traffic prediction for
congestion mitigation, but studies on bottleneck iden-
tification are not focused on that much (Karim and
Nower, 2024). The initial study (Long et al., 2008)
on bottleneck identification is based on the cell trans-
Sarker, M., Sakib, K. and Nower, N.
Identification of Traffic Bottlenecks in Central Dhaka Through Spreading Graph-Based Congestion Analysis.
DOI: 10.5220/0013296200003941
Paper published under CC license (CC BY-NC-ND 4.0)
In Proceedings of the 11th International Conference on Vehicle Technology and Intelligent Transport Systems (VEHITS 2025), pages 125-135
ISBN: 978-989-758-745-0; ISSN: 2184-495X
Proceedings Copyright © 2025 by SCITEPRESS – Science and Technology Publications, Lda.
125

mission model (CTM)–based congestion propaga-
tion model where the average trip velocity (AJV)
is used to calculate bottleneck. Bottleneck identi-
fication method for Kaohsiung city is proposed in
(Yue et al., 2018) where causal congestion tree is
used on loop detector data. In addition, a map
data-driven bottleneck identification approach is pre-
sented in (Mirzahossein et al., 2024) for Tehran
city. Besides these, wavelet-based bottleneck detec-
tion for Washington (Ke et al., 2018), congestion
propagation-based method for Taipei (Li et al., 2020),
and bottleneck detection approach for Wisconsin (Jin
et al., 2012) are proposed. Though these existing ap-
proaches provide valuable insights, their dependency
on sophisticated technology, high costs, or lack of
adaptability to highly congested, resource-limited ur-
ban settings makes them unsuitable for Dhaka city.
In addition, there is minimal infrastructure to collect
traffic congestion data for Dhaka city. Apart from the
lack of traffic data, every city has a unique road lay-
out and transportation system (Rahman and Nower,
2023). These factors significantly impact traffic con-
gestion, as a result, we cannot simply apply other
bottleneck detection approaches in our capital city
Dhaka.
Dhaka is the fifth most congested city in the world
with an estimated 17 million people living in an area
of 1,528 square kilometers. According to the Asian
Development Bank (ADB), average speeds in some
places have dropped to as low as 7–10 km/h dur-
ing peak hours because of severe traffic congestion
(Moshiur Rahman and Nower, 2024). As a result,
bottlenecks, as the most contributing factor to traf-
fic congestion, are necessary to identify for this city.
Bottlenecks are created by several factors in this city:
inadequate road infrastructure, an ever-growing num-
ber of private vehicles, poor traffic management, etc.
These choke points not only slow down traffic but
also lead to ripple effects across the entire network,
where even a minor delay at a bottleneck can cre-
ate significant congestion downstream. The cumula-
tive effect of these bottlenecks exacerbates the con-
gestion problem, making it challenging to maintain
consistent traffic flow throughout the city (Hossain
and Nower, 2022). Thus we need a cost-effective,
adaptable method for bottleneck identification tai-
lored to the constraints and unique congestion pat-
terns of Dhaka, aiming to bridge the gap left by ex-
isting research methods.
To address this gap, this study proposes a novel
urban traffic bottleneck identification approach based
on Congestion Spreading Graph (CSG) and Maxi-
mal Spanning Tree (MST) analysis using traffic in-
tensity data calculated from Google Map snapshots.
The proposed approach collects traffic data using our
previously developed tool (Hossain and Nower, 2022)
by processing Google map snapshots. By leveraging
traffic data and advanced algorithms, our approach
aims to identify specific bottleneck points accurately
throughout Dhaka’s road network. This data-driven
solution can offer affordable solutions and actionable
insights to policymakers and urban planners, help-
ing them to create targeted interventions that address
Dhaka’s unique traffic challenges more effectively.
Our primary contributions are as follows:
• A novel methodology is developed using a combi-
nation of snapshot processing, graphical models,
maximal spanning trees, and Markov analysis to
model and analyze congestion spreading in urban
roads. It offers an effective way to quantify both
the spread of congestion and the congestion costs
of individual road links.
• Validation using SUMO demonstrates that the
proposed method identifies Dhaka city’s bottle-
necks properly.
2 RELATED WORK
With the increase in urban dynamics, the urban trans-
port system is becoming more crucial in the citizen’s
daily life. The bottleneck, the most critical road seg-
ment is one of the main reasons for traffic congestion.
Thus, these critical road segments, or bottlenecks,
must be identified in road networks. Once the conges-
tion on the identified bottlenecks is reduced by using
these sophisticated traffic control/management tech-
niques, the overall traffic network’s conditions will
be effectively and efficiently improved. The existing
bottleneck identification studies on different cities are
highlighted in this section.
Numerous methods have been developed to iden-
tify traffic bottlenecks in different transport network
settings. (Long et al., 2008) introduced a congestion
propagation model for urban networks using the cell
transmission model (CTM), incorporating link and
node models to simulate flow propagation and iden-
tify bottlenecks. The model estimates average jour-
ney velocity (AJV) and demonstrates, through sim-
ulations on the Sioux Falls network, that increasing
traffic demand is a key factor in bottleneck forma-
tion, influenced by link position, flow composition,
and network demand. While their approach identified
bottlenecks, the study was limited by a lack of real-
time data and relied heavily on predefined thresholds
which can be highly varied from city to city. More-
over, this method cannot effectively represent traffic
VEHITS 2025 - 11th International Conference on Vehicle Technology and Intelligent Transport Systems
126

congestion propagation under special conditions or
manage traffic congestion control.
The author of (Jin et al., 2012) developed an al-
gorithm to tackle noise and error issues in freeway
detector data, aiming at recurrent bottleneck identifi-
cation on Wisconsin freeways, which, when tested on
field data, outperformed existing methods by reducing
false alarms, particularly in severe congestion scenar-
ios. They identified recurrent freeway bottlenecks by
analyzing loop detector data to pinpoint bottlenecks’
locations, timing, and activation rates. However, the
major limitation is that it focused on test sites in Wis-
consin, which lack the large-scale congestion seen in
major metropolitan areas, limiting generalizability.
The paper (Ke et al., 2018) introduced a wavelet-
based framework for automating bottleneck identifi-
cation on Washington’s I-405. This novel method
effectively distinguished recurring bottlenecks and
quantified their impacts using daily delay and con-
gestion indicators. However, their proposed approach
utilizes wavelet-based transformation on various loop
detector data which is not feasible in the resource-
constrained city Dhaka.
Another bottleneck identification approach is pre-
sented in (Yue et al., 2018) where causal congestion
graphs are utilized for Kaohsiung city. They proposed
a new definition of urban bottlenecks that combines
congestion propagation costs and congestion weights
of road segments. Using causal congestion trees and
graphs, the method identifies bottleneck groups based
on data from urban inductive loop detectors. To val-
idate the results, the study enhances road capacity
at these bottlenecks and compares congestion levels
and propagation ranges before and after the enhance-
ments. A major shortcoming of this paper is its inabil-
ity to pinpoint the most significant bottleneck within
each identified bottleneck group based on congestion
level and congestion costs. This limitation restricts
the effectiveness of targeted interventions, as it fails
to prioritize the bottlenecks with the highest impact
on overall congestion.
The authors of the paper (Li et al., 2020) devel-
oped a congestion propagation-based traffic bottle-
necks identification method in Taipei by evaluating
congestion costs, considering both road segment con-
gestion and the spread of congestion to adjacent seg-
ments. The model employs graph theory and maxi-
mal spanning trees and uses Markov analysis to es-
timate the probability of congestion transfer between
segments. Simulations on the SUMO platform and
experiments with real-world data from Taipei demon-
strate the method’s effectiveness. The major short-
coming of this paper is its lack of integration between
traffic data and detailed road characteristics, limiting
its ability to identify specific congestion sources ef-
fectively. Their data collection method is very ex-
pensive for a mega city like Dhaka. A cost-effective
method is necessary for the traffic bottleneck identifi-
cation process for Dhaka.
Typically, fixed detectors on the road, including
speed cams, loop detectors, video cameras, sensors,
etc., are used to gather traffic data. However, there is
not much reliable architecture in Bangladesh to col-
lect traffic data as a result, research on traffic con-
gestion, gridlock, and bottleneck analysis in the fifth
most congested city Dhaka is not so extensive. For ex-
ample, (Momin et al., 2023) used their recorded video
to gather traffic statistics for just three hours, and then
they applied Kalman filtering for prediction. Another
study (Rahman et al., 2018) provides a traffic pattern
analysis of Dhaka using GPS data collected for only
15 days. Due to a dearth of traffic data, (Al Noor and
Mehanaz, 2022) used a questionnaire survey to collect
responses from 721 different road users to investigate
the dynamics of journey times in Dhaka.
As far as we know, till now no studies have sys-
tematically identified traffic bottlenecks in Dhaka that
could provide insights for alleviating the city’s se-
vere traffic congestion. This lack of targeted research
represents a significant gap in the existing literature,
highlighting the need for focused investigations to un-
derstand and address the underlying causes of con-
gestion in this rapidly urbanizing environment. Our
proposed novel traffic bottleneck identification pro-
cess will help to overcome the existing shortcomings
of the mentioned works as well as the need for such
studies for Dhaka city.
3 PROPOSED BOTTLENECK
IDENTIFICATION APPROACH
FOR DHAKA CITY
This section presents a systematic approach to identi-
fying road traffic bottlenecks in Dhaka by analyzing
traffic intensity snapshots. In this proposed bottleneck
identification approach (as shown in Fig. 1), a Google
map image of a road network for a certain interval is
taken as input and then continues with image cropping
and color masking to extract the traffic features, fol-
lowed by a grid-based analysis that assigns intensity
values to each grid cell using color codes. Congested
lanes are then identified based on their traffic inten-
sity value. Next, a correlation analysis is performed
among the adjacent lanes within a specific time win-
dow, forming a Congestion Spreading Graph (CSG)
to visualize the spread of congestion. In the CSG,
Identification of Traffic Bottlenecks in Central Dhaka Through Spreading Graph-Based Congestion Analysis
127

Figure 1: Proposed bottleneck identification process.
maximal spanning trees are applied to identify critical
connections in this graph. Then, Na
¨
ıve Bayes’ The-
orem is used to calculate the contagion cost for each
lane of the CSG. Finally, the bottleneck is identified
by summing up the lane cost and contagion cost. This
integrated approach allows for precise detection of
high-traffic areas, helping to predict and manage con-
gestion, and making it useful for traffic control and
infrastructure planning. Figure 1 presents the overall
bottleneck identification process.
3.1 Traffic Data Collection from Road
Network
For data collection, we have used our previously pro-
posed tool (Moshiur Rahman and Nower, 2024; Hos-
sain and Nower, 2022), which uses the Selenium Web
Driver to capture screenshots from Google Maps. Fi-
nally, these screenshots are processed using image-
processing techniques to extract road traffic informa-
tion. Using that tool, we can extract traffic data for
any place and any duration.
3.2 Image Cropping and Masking
The original traffic images from Google Maps were
cropped to a standardized size of 940x1440 pixels to
focus on the relevant road area and minimize unnec-
essary data. This size was chosen to encompass the
usable road region where traffic flow was most con-
centrated. A color masking technique was employed
to isolate traffic-related elements in the images. We
have applied different masking HSV (Hue, Satura-
tion, Value) values for default and satellite map types
to extract traffic data from captured images. These
masking values help to identify the relevant color re-
gions indicating traffic congestion levels, enabling the
extraction of necessary information from the images.
All colors except red, yellow, and green were con-
verted to black, effectively highlighting the key traf-
fic indicators: Red HSV (0-10, 100-255, 100-255) =
High intensity, Yellow HSV (20-30, 100-255, 100-
255) = Medium intensity, Green HSV (35-85, 100-
255, 100-255) = Low intensity and Black HSV (0-
180, 0-255, 0-50) = No traffic.
Figure 2: Image preprocessing for analysis.
3.3 Grid Map & Intensity Calculation
Each cropped image is subdivided into a grid of
20x20 pixel segments, yielding a total of 3,384 grid
cells per image. Traffic intensity for each grid cell
was determined independently based on the predom-
inant color present, with a defined color scale used
for classification: red is assigned an intensity value of
three, yellow is assigned a value of two, green a value
of one, and black a value of zero. The overall inten-
sity for each snapshot is then calculated by summing
the intensity values across all grid cells, resulting in
a comprehensive and granular measure of traffic con-
ditions at each time point. In this way, we have col-
lected the intensity of each lane of the road network
and stored it in a CSV file as shown in Fig. 2.
VEHITS 2025 - 11th International Conference on Vehicle Technology and Intelligent Transport Systems
128

3.4 Congestion and Congestion
Correlation
Based on the previously calculated intensity value
congestion and congestion correlation are deter-
mined. Congestion refers to the condition where
traffic demand exceeds roadway capacity, leading to
slower speeds, longer travel times, increased vehi-
cle density, and associated impacts such as reduced
safety, higher fuel consumption, and greater environ-
mental pollution. In this research, we use a definition
of congestion based on traffic intensity which is used
as the metric of traffic congestion in Dhaka city.
Definition 1- Congestion: From our field study, a
specific lane is considered congested if its traffic in-
tensity exceeds 10 percent of its average value. The
formula for detecting congestion is given by:
C =
CT I − MT I
MT I
> 0.10 (1)
Where:
• C represents the congestion status of the lane,
• CT I is the current traffic intensity at a given time,
• MT I is the mean traffic intensity over the obser-
vation period. MTI > 0
Traffic intensity refers to the volume of vehicles
passing through a specific point over a given period,
offering a direct measure of road usage and demand.
By setting thresholds for traffic intensity, one can de-
termine when the flow of vehicles surpasses the road’s
capacity, leading to congestion. When the real-time
traffic intensity on a road segment exceeds the pre-
defined threshold, it indicates that the road is con-
gested. Congestion correlation, on the other hand, an-
alyzes the congestion-spreading relationship among
the adjacent road segments. This concept is crucial as
the onset of congestion on one road segment can have
a significant effect, disrupting traffic patterns on adja-
cent road segments in urban areas like Dhaka city and
contributing to increased congestion in the surround-
ing regions as well. It establishes the necessity of ex-
amining the relationships between congestion levels
across various road segments. Thus, this definition of
congestion correlation focuses on the spatial-temporal
dynamics between two road segments, as outlined be-
low:
Definition 2 Congestion Correlation Between Two
Road Segments: Congestion on road segment A is
correlated with congestion on road segment B if the
following requirements are satisfied.
Spatial Threshold: Node A and node B are con-
nected roads and adjacent in a given road network.
Temporal Threshold: The congestion spreading
time between node A and node B should be within
a predefined interval in the given road network.
In this paper, we consider that congestion at two
different road segments is correlated only if both the
spatial and temporal thresholds are met. The spatial
threshold requires that node A and node B are con-
nected and adjacent in the given road network, while
the temporal threshold specifies that the traffic prop-
agation delay between node A and node B is no more
than 40 minutes. This congestion correlation defi-
nition offers two advantages: first, using the spatial
threshold based on the connectivity of adjacent nodes
reflects the actual congestion propagation path and
direction in the traffic network; second, the tempo-
ral threshold better captures the relationship between
congestion propagation and the time it takes for traffic
delays to spread.
Figure 3: An illustration of the congestion correlation be-
tween road segments.
An example is shown in Figure 3, where conges-
tion occurs on road segment A at 8:00 AM, and we
need to investigate the correlated congested road seg-
ments for road segment A based on the proposed con-
gestion correlation definition. According to the spa-
tial threshold, we first identify the road segments ad-
jacent and directly connected to congested road seg-
ment A in the road network, as shown in Figure 3
Road segments B and C are connected to the road
segment A, satisfying the spatial threshold. Next, we
consider the temporal threshold, which states that the
traffic propagation delay between two segments is 40
minutes. Congestion on road segment C occurred at
8:55 AM, not meeting the temporal threshold of 45
minutes. Therefore, congestion on road segment C
is not considered to be correlated with congestion on
road segment A. In contrast, congestion on road seg-
ment B occurred at 8:45 AM, making it likely that
congestion on road segment B is correlated with con-
gestion on road segment A. Thus, considering both
the spatial and temporal thresholds, only the conges-
tion on road segment B is correlated with congestion
on road segment A, and we can establish the causal re-
lationship: ”congested road segment A → congested
road segment B.
Identification of Traffic Bottlenecks in Central Dhaka Through Spreading Graph-Based Congestion Analysis
129
3.5 Congestion Spreading Graph and
Maximal Spanning Tree
In this subsection, we construct Congestion-
Spreading Graphs (CSG) by connecting correlated
road segments based on their spatial and temporal
relationships, as defined earlier. After identifying
congested road segments, they are connected as
directed edges, and these connected segments are
added to form a directed graph. Afterward, we apply
a maximal spanning tree algorithm to the graphs,
forming a set of trees that maximizes the number of
edges and efficiently captures the causal congestion-
spreading relation at different road segments within
the selected transport network.
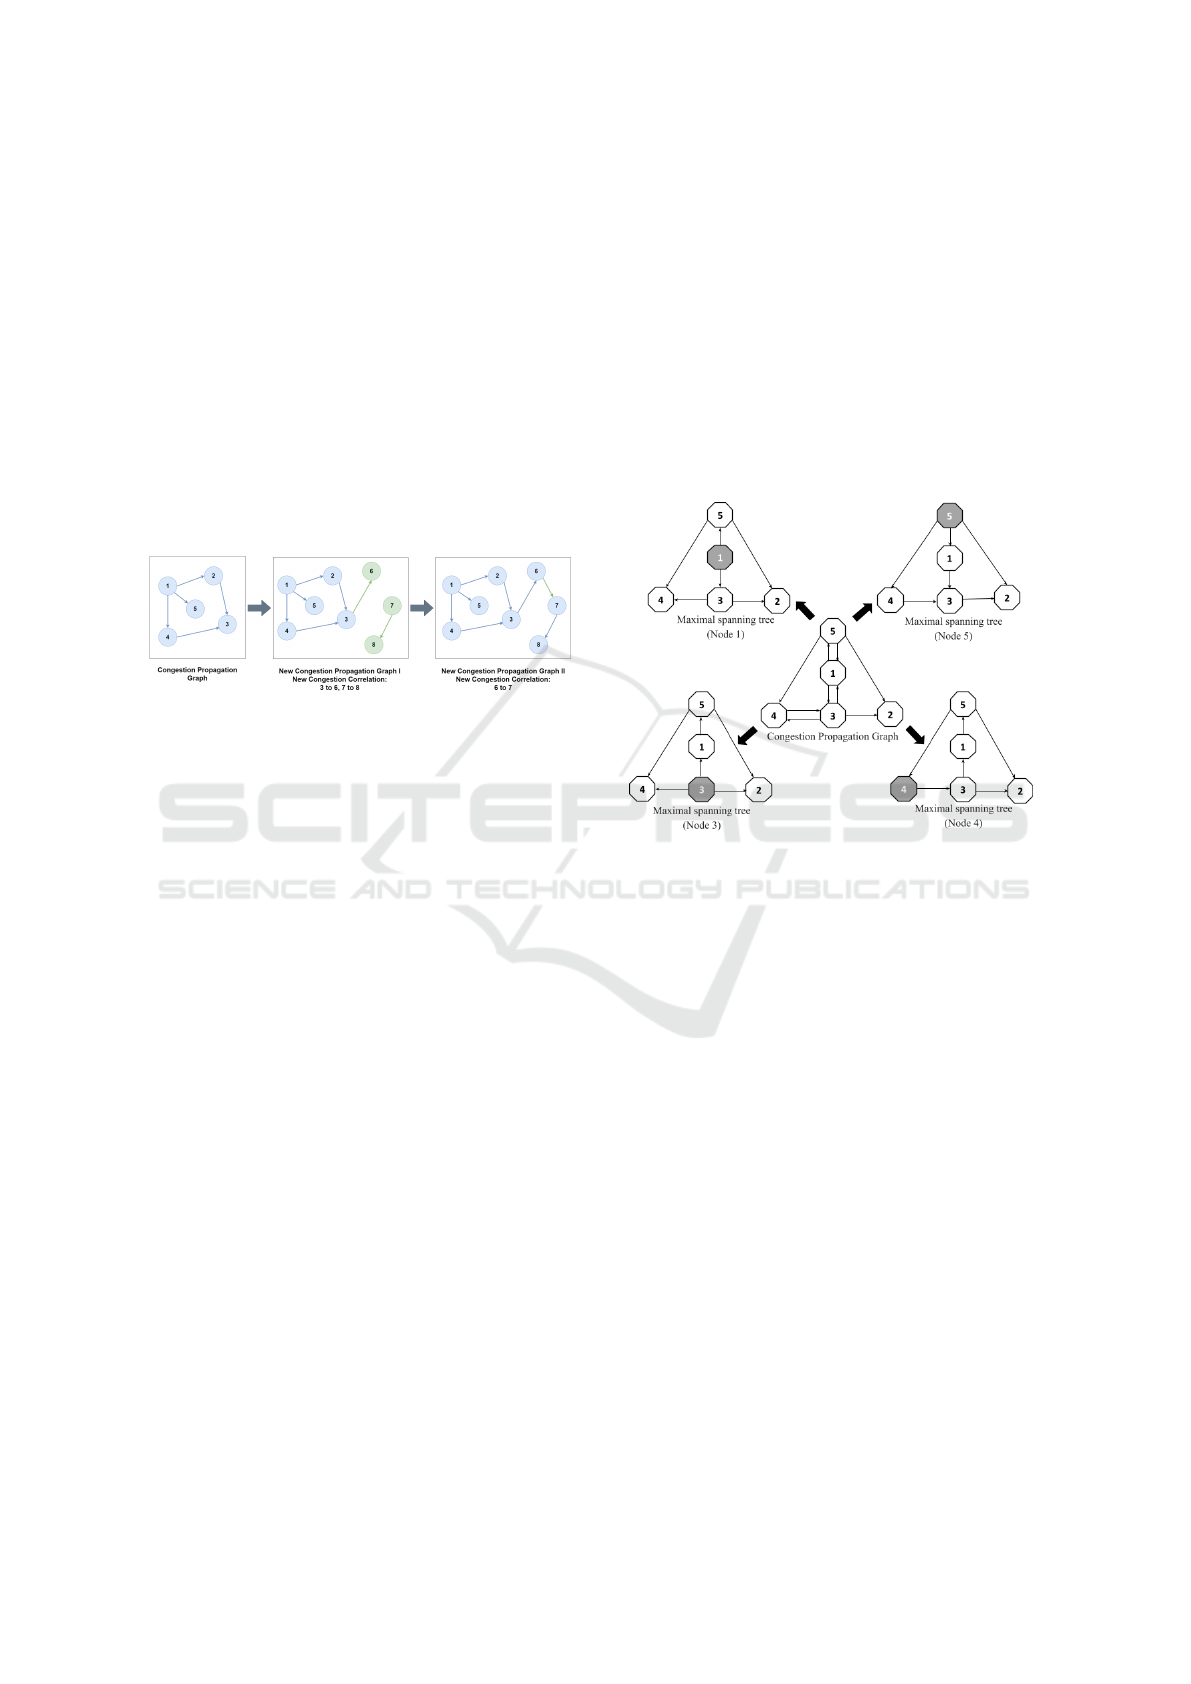
Figure 4: An illustration of the construction of congestion
spreading graphs.
An example is shown in Figure 4 to illustrate the
construction of the congestion spreading graph gen-
eration process. Suppose we have constructed one
disjoint congestion propagation graph, and we need
to add the other three new correlations 3 -→ 6, 7 -
→ 8, and 6 -→ 7 into the graphs. As depicted in
the congestion propagation graph I of Figure 4, if ei-
ther road segment in a correlation relation already ex-
ists in the current graphs, such as correlation 3 -→ 6,
we can connect the correlation to the corresponding
graph. Suppose none of the two road segments in a
correlation relation are in the existing graphs, such as
correlation 7 -→ 8. In that case, this edge (and the as-
sociated vertices) should form the first edge of a new
graph, as shown in the congestion propagation graph
I. Moreover, suppose one road segment in a correla-
tion is in a graph, and another road segment in a cor-
relation is in another graph, such as correlation 6 -→
7. In that case, we can join the two graphs together
and form one graph, as shown in the congestion prop-
agation graphs II. However, if two road segments in
a correlation are both in the same graph, then we can
delete this correlation. In this way, we can construct
several disjoint congestion propagation graphs using
the correlation, as mentioned earlier. The outcome of
constructed congestion propagation graphs and maxi-
mal spanning trees is the input used in calculating the
congestion cost of each road segment of each span-
ning tree.
Definition 3- Maximal Spanning Tree: A maximal
spanning tree is a tree with a maximal set of directed
edges (i.e., correlations) such that there is a unique
(directed) path from the root of the tree (i.e., a road
segment) to any other vertex (i.e., the endpoint of
an edge) of the tree. To measure the congestion-
spreading effects of a road segment, we calculate
its spreading cost by applying Breadth First Search
(BFS). In this approach, each road segment is treated
as a root node to construct a maximal spanning tree
from the congestion propagation graphs. An example
is provided to demonstrate the construction of these
maximal spanning trees.
Figure 5: An illustration of the construction of maximal
spanning trees from the congestion-spreading graph.
As depicted in Figure 5, a conceptual congestion
spreading graph is presented based on our proposed
method. The graph consists of five road segments and
nine directed edges (correlations). Regarding road
segments 1, 2, 3, 4, and 5 as the root of a tree re-
spectively, we can get five different maximal spanning
trees (because congestion on road segment 2 does not
propagate to the other road segments, the fifth tree
only consists of a root node, i.e., road segment 2).
These maximal trees indicate the congestion propa-
gation path and influence areas during congestion.
3.6 Bottleneck Identification
Bottlenecks are critical points in a road network, mak-
ing their identification essential. We describe the pro-
cess for identifying bottlenecks by calculating both
the congestion cost of individual road segments and
the contagion cost. To identify long-term bottlenecks
and assess their network-wide impact, we calculate
the congestion level of each road based on traffic in-
tensity. Using Na
¨
ıve Bay’s Theorem and maximal
spanning trees, we also estimate the cost of conges-
VEHITS 2025 - 11th International Conference on Vehicle Technology and Intelligent Transport Systems
130
tion spreading to neighboring roads. Thus, the fol-
lowing definitions of congestion cost and urban bot-
tlenecks are proposed in this research.
B− > A =
N
AB
N
A
(2)
where:
• N
AB
is the number of instances where lane A is
congested at time t and lane B becomes congested
at time t + threshold
• N
A
is the total number of time instances where
lane A is congested.
Definition 4- Congestion Cost:Traffic congestion
cost of a road segment indicates the quantification of
congestion on this road segment that causes the neg-
ative influence on the whole road network, which can
be expressed as the sum of the congestion level cost
of the road segment itself and the congestion propa-
gation cost that the congestion may propagate to other
road segments.
Definition 5- Bottlenecks in Urban Areas: The
lanes that have contagion costs greater than a certain
value are marked as Bottleneck points.
In our work, the contagion cost for each lane was
calculated using Na
¨
ıve Bayes’ Theorem to assess the
probability that congestion in one lane would spread
to adjacent or connected lanes. This probabilistic ap-
proach allowed for the quantification of how likely
it was that congestion in a given lane would propa-
gate throughout the road network. The contagion cost
represents the cumulative risk of congestion transmis-
sion, with higher values indicating lanes that are more
prone to causing network-wide traffic issues. Lanes
with a contagion cost exceeding a certain value were
flagged as potential bottleneck points, meaning they
were critical to the overall traffic flow and posed a
heightened risk of exacerbating congestion.
4 SIMULATION AND
DISCUSSION
In this section, we have applied our proposed bottle-
neck identification approach to one of the busy ar-
eas of the capital city, Dhaka. We chose a road net-
work covering eight major areas with twenty-three
lanes as a study area. Finally, we have validated our
proposed bottleneck identification approach using a
widely used traffic simulator, Simulation of Urban
MObility (SUMO).
4.1 Data Description
Our work focused on identifying traffic bottlenecks
in eight major areas in Dhaka by analyzing a net-
work of connecting twenty-three lanes. Table 1 shows
the name, geographic location, and direction of con-
nected lanes of the selected eight major traffic nodes
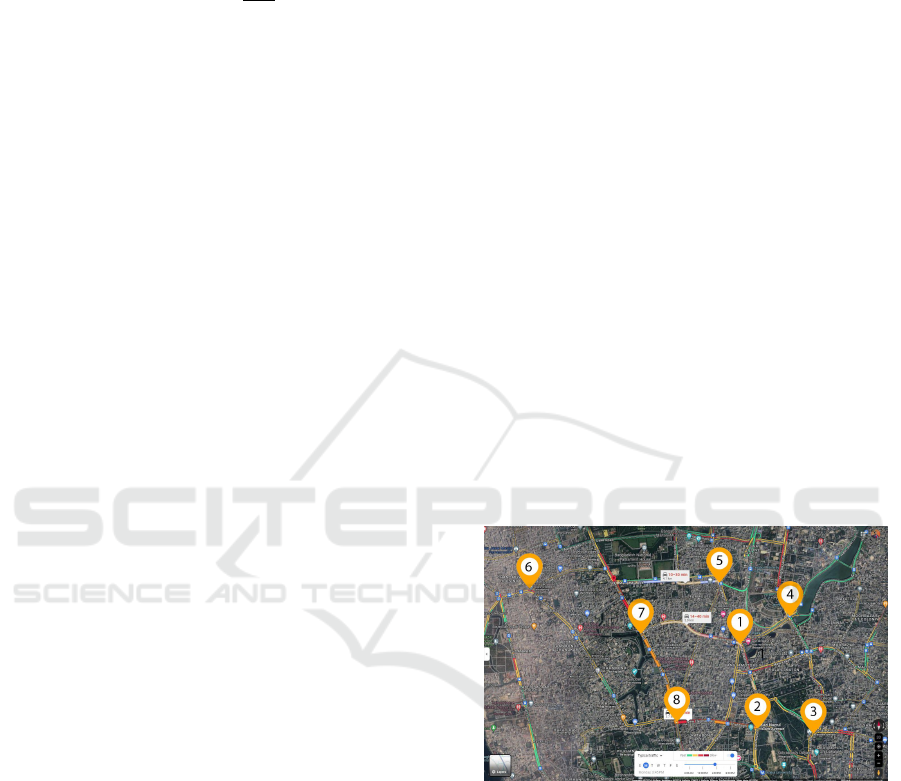
within the study area. This area (as shown in Fig.
6) is a crucial hub for traffic flow, as it experiences
heavy congestion almost daily, particularly during
peak hours. Its strategic importance, serving com-
muters from various city sectors, makes this area an
ideal candidate for bottleneck identification work. To
identify the bottleneck in the area, we have collected
snapshots from Google Maps for three months (Jan-
uary 2024- March 2024) using our tool (Moshiur Rah-
man and Nower, 2024) in ten-minute intervals. These
collected snapshots are processed by cropping, mask-
ing, and grid map generation and finally generate the
intensity of each road in ten-minute intervals. Our
collected data set comprises 13104 (91 Days * 24
Hours * 6 Snapshots per hour) data instances for each
road segment. Thus, we have a data set of a total of
13104*23 = 301392 instances for twenty-three road
segments with intensity values. From this intensity
value of the road segment, we calculate congestion
cost and contagion cost.
Figure 6: Location of the selected eight nodes.
4.2 Simulation for Bottleneck
Identification
1) Simulation on Bottleneck Identification: In this
subsection, we first calculate the costs of all twenty-
three lanes based on our congestion spreading graph
and maximal spanning tree. The result is shown in
Table 2.
Table 2 shows that the estimated cost varies from
0.36 to 17.82. Unlike traditional lane-specific anal-
ysis, this study aggregates lane-wise costs to deter-
mine the overall congestion impact at each intersec-
tion, providing a comprehensive view of traffic dy-
Identification of Traffic Bottlenecks in Central Dhaka Through Spreading Graph-Based Congestion Analysis
131
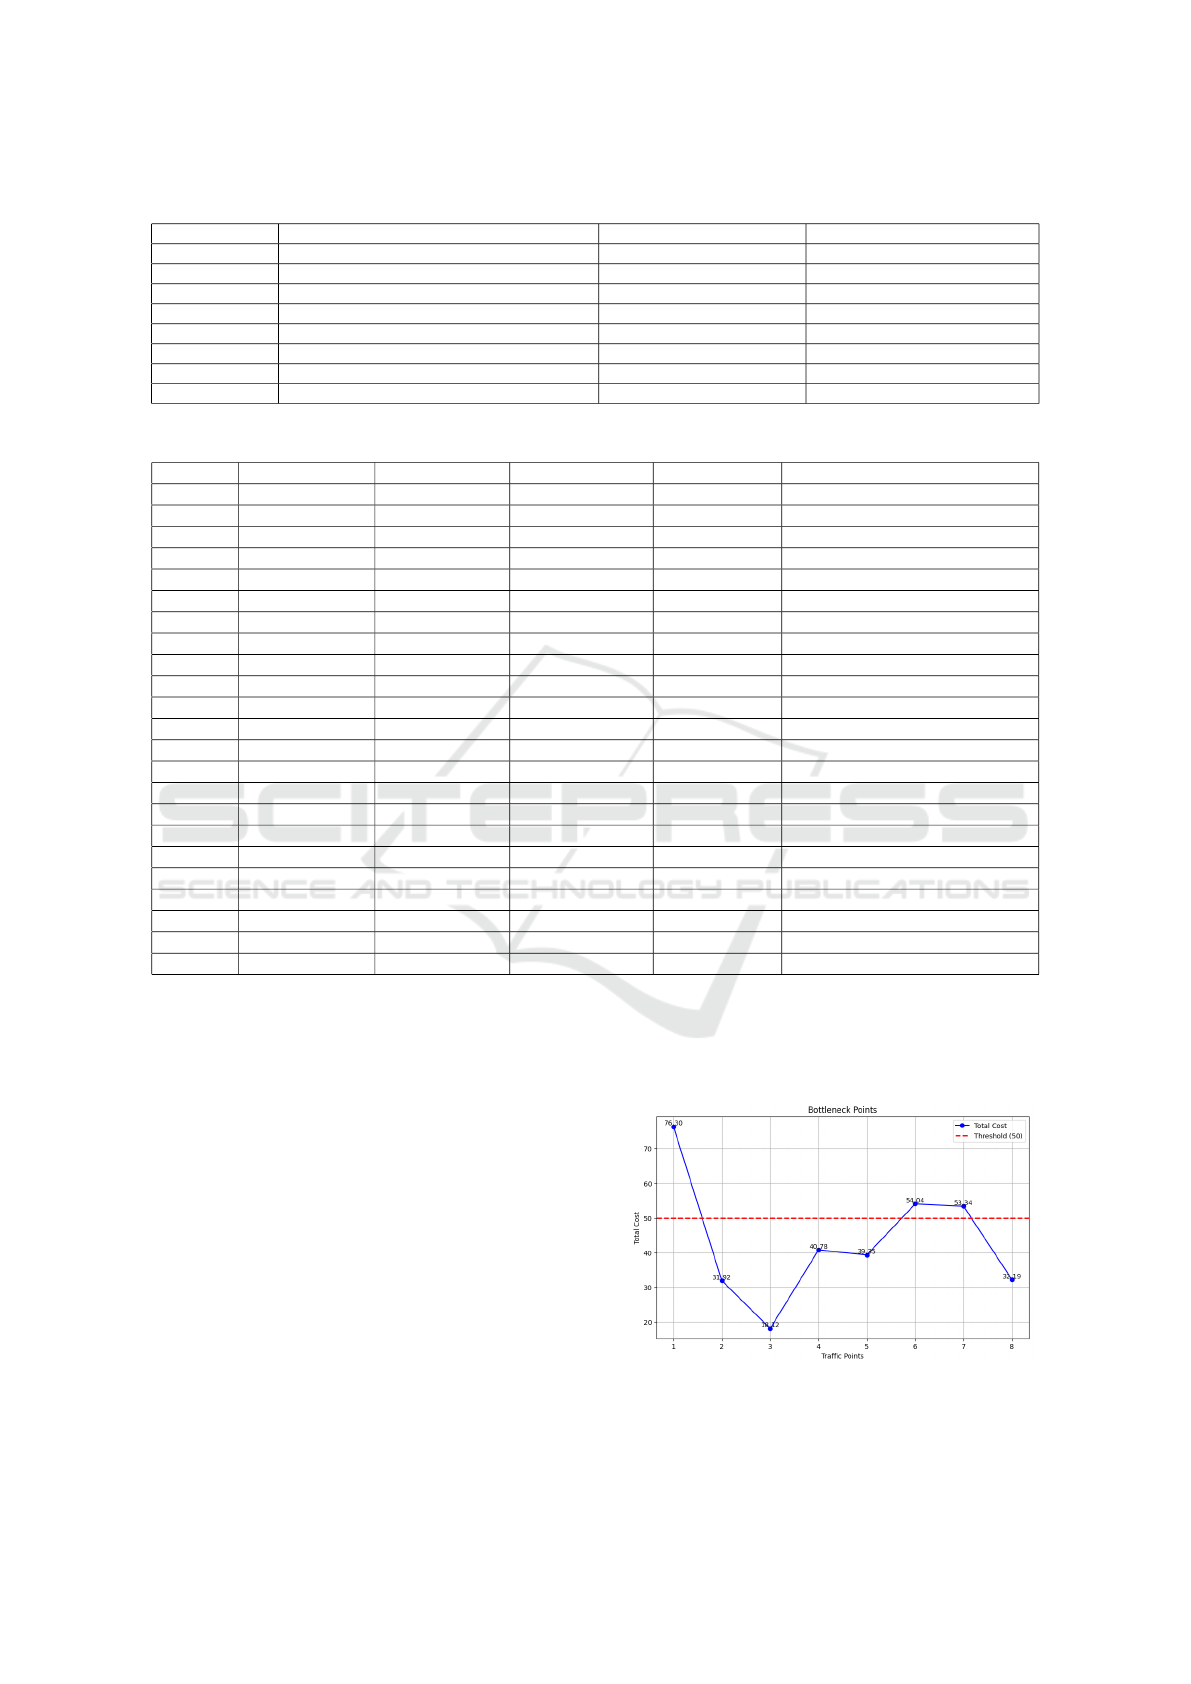
Table 1: Name, Location, and ID of connected lanes of the selected eight nodes.
Selected Nodes Name Geographic Position Direction of Connected Lanes
1 Kawran Bazar Intersection 23.749876°N, 90.393197°E 1-2, 1-4, 1-5, 1-7
2 Shahbagh Intersection 23.738136°N, 90.395844°E 2-1, 2-3, 2-8
3 Shahed Captain Mansur Ali Sarani (Kakrail) 23.737350°N, 90.404211°E 3-2, 3-4
4 FDC Intersection 23.753535°N, 90.400696°E 4-1, 4-3, 4-5
5 Farmgate Intersection 23.758640°N, 90.389878°E 5-1, 5-4, 5-6
6 Mohammadpur Bus Stand 23.756996°N, 90.361499°E 6-5, 6-7, 6-8
7 Dhanmondi 32 23.751288°N, 90.378258°E 7-1, 7-6, 7-8
8 Science Lab Intersection 23.738840°N, 90.383451°E 8-2,8-6
Table 2: Traffic Contagion Cost for Each Lane in the first quarter of 2024.
Lane No Lane Direction Cost - January Cost - February Cost - March Average Cost January - March
1 1-2 4.82 7.04 7.71 5.98
2 1-4 9.12 5.40 9.79 8.93
3 1-5 3.45 2.98 2.74 5.41
4 1-7 11.90 15.82 10.20 14.09
5 2-1 8.93 14.59 7.02 10.21
6 2-3 6.61 6.38 5.95 6.24
7 2-8 9.04 7.95 4.42 7.72
8 3-2 2.48 1.62 1.26 1.56
9 3-4 6.91 6.53 9.56 8.84
10 4-1 10.97 19.56 13.29 12.47
11 4-3 0.49 0 0.94 0.81
12 4-5 6.45 3.44 10.38 8.34
13 5-1 3.54 4.49 8.89 5.66
14 5-4 0.29 10.87 0.91 0.69
15 5-6 12.22 18.46 13.25 17.48
16 6-8 22.18 18.43 11.83 14.78
17 6-5 13.45 1.99 1.11 1.99
18 6-7 22.64 19.62 10.61 12.45
19 7-1 10.78 17.17 20.49 16.95
20 8-6 3.35 3.55 Not Correlated 3.44
21 7-6 2.65 3.64 1.42 3.17
22 7-8 7.85 6.86 3.53 5.55
23 8-2 0.92 0.78 Not Correlated 0.67
namics.
The total propagation cost for each intersection is
calculated by summing up the individual lane-wise
costs associated with that intersection. This approach
considers the cumulative congestion effect stemming
from all connected lanes, allowing for a holistic iden-
tification of critical traffic bottlenecks. Traffic data
was collected over three months (January to March
2024) at 10-minute intervals, ensuring the analysis
captures both temporal and spatial variations in con-
gestion.
We set a bar that only the lanes with a contagion
cost greater than fifty will be considered Bottlenecks.
Let C
i
represent the contagion cost for Point i, and let
B
i
be a binary variable indicating whether a point i is
a bottleneck. This condition is expressed as :
Bi =
(
1, if Ci > 50
0, otherwise
(3)
In Figure 7, we present the estimated costs for
each intersection along with the bottleneck’s min-
imum cost line for these three months (January -
March).
Figure 7: Estimated costs of all the traffic points.
Figure 7 clearly shows that only three points ex-
VEHITS 2025 - 11th International Conference on Vehicle Technology and Intelligent Transport Systems
132
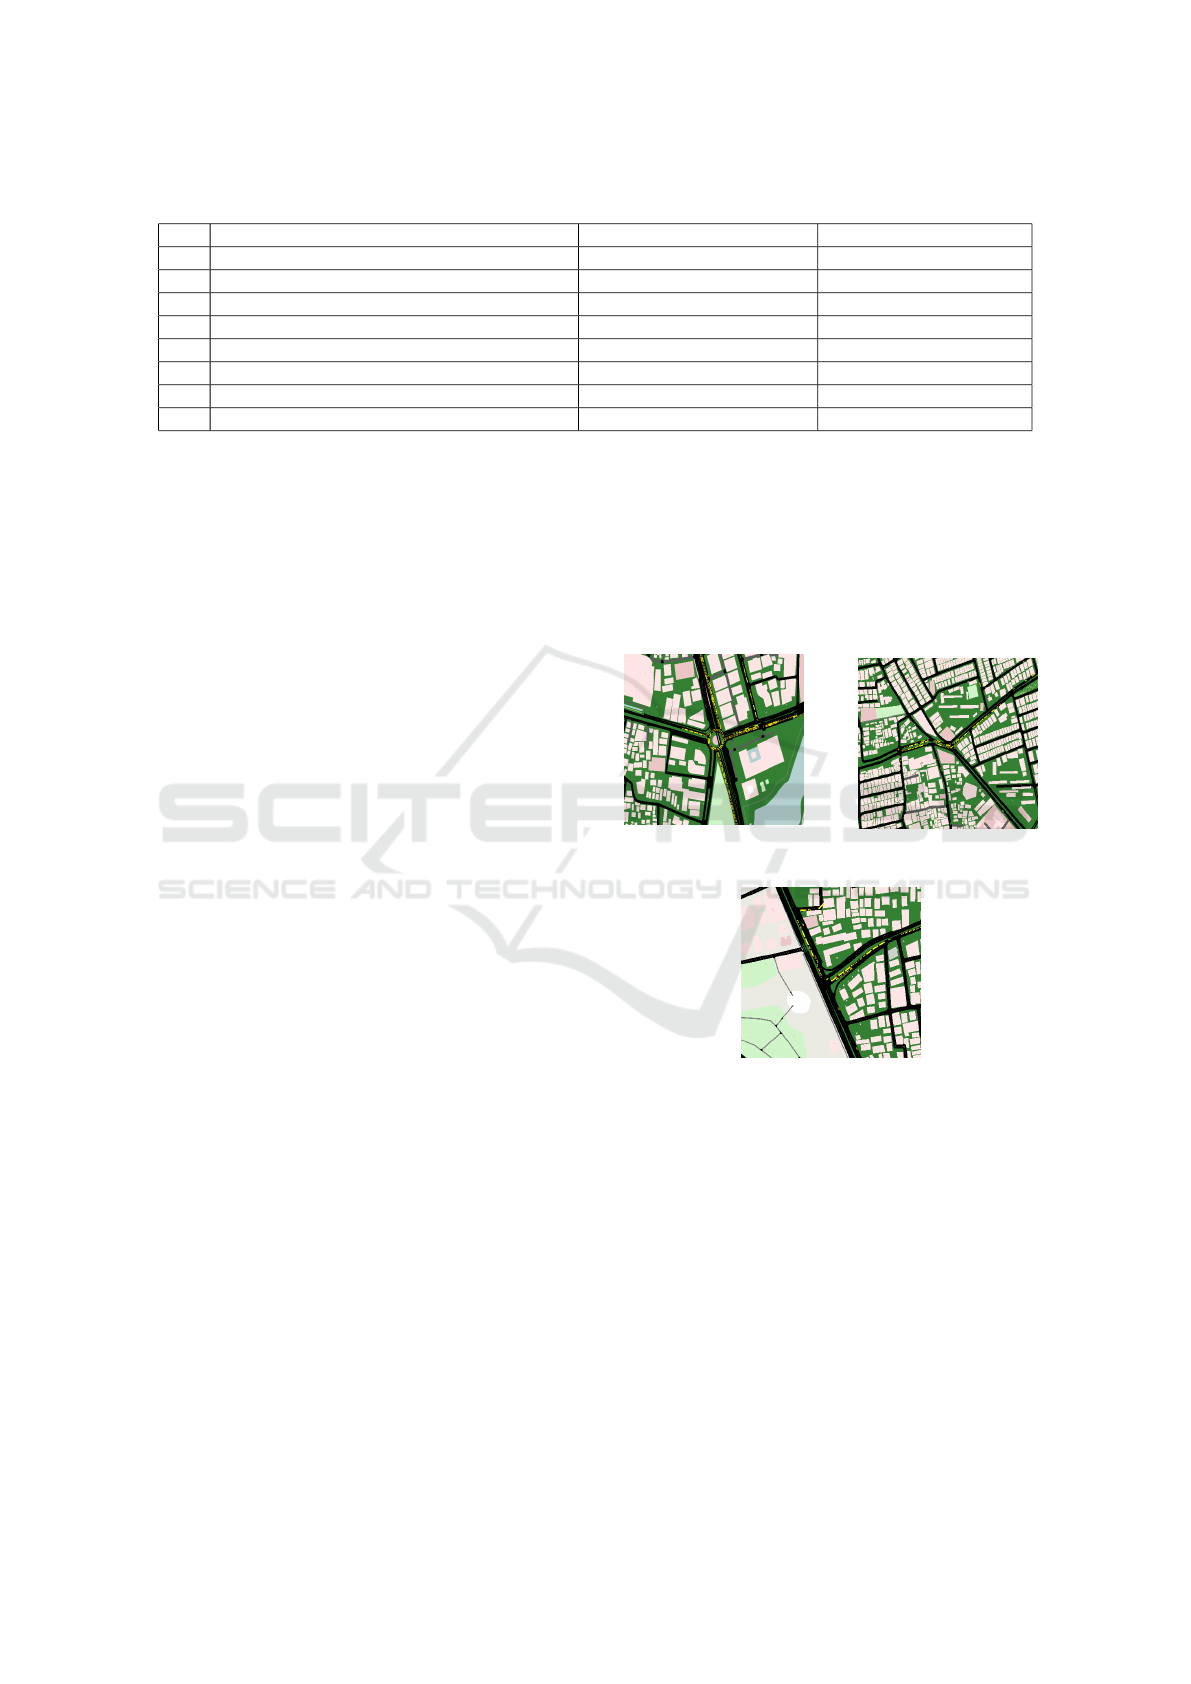
Table 3: Total propagation costs for selected traffic intersection points.
No Intersection Point Geographic Position Total Propagation Cost
1 Kawran Bazar Intersection 23.749876
◦
N, 90.393197
◦
E 76.30
2 Shahbagh Intersection 23.738136
◦
N, 90.395844
◦
E 31.92
3 Shahed Captain Mansur Ali Sarani (Kakrail) 23.737350
◦
N, 90.404211
◦
E 18.12
4 FDC Intersection 23.753535
◦
N, 90.400696
◦
E 40.78
5 Farmgate Intersection 23.758640
◦
N, 90.389878
◦
E 39.35
6 Mohammadpur Bus Stand 23.756996
◦
N, 90.361499
◦
E 54.04
7 Dhanmondi 32 23.751288
◦
N, 90.378258
◦
E 53.34
8 Science Lab Intersection 23.738840
◦
N, 90.383451
◦
E 32.19
ceed the minimum cost line of bottleneck: Intersec-
tion Point 1 (Kawran Bazar), Intersection Point 6
(Mohammadpur Bus Stand), and Intersection Point
7 (Dhanmondi 32). Using a combination of field
data and traffic simulations, these three lanes have
been identified as primary congestion bottlenecks in
the study area, demonstrating frequent delays that
propagated to neighboring segments and exacerbated
network-wide delays. The congestion analysis high-
lighted these lanes as high-impact zones where merg-
ing traffic flows, pedestrian crossings, and vehicle
stoppages at intersections created significant disrup-
tions.
Intersection Point 1 from Kawran Bazar Intersec-
tion to Dhanmondi 32 along the Panthapath corridor
demonstrated significant congestion, particularly dur-
ing peak hours, attributed to high volumes of merging
traffic from adjoining feeder roads. This lane serves
as a critical artery, connecting major hubs such as
Farmgate, Kawran Bazar, Tejgaon, and Dhanmondi,
making it highly susceptible to traffic buildup. The
convergence of vehicles from these secondary routes
intensified local delays, which subsequently spread to
adjacent lanes, impacting the broader network flow.
Intersection Point 6 (Mohammadpur Bus Stand)
shows high pedestrian activity and frequent stoppages
by public transport, which contribute to significant
delays at this node. Its role as a transit hub for buses
and other vehicles amplifies congestion impacts on
the surrounding network.
Intersection Point 7 (Dhanmondi 32) serves as a
junction for multiple feeder roads. This intersection
suffers from persistent delays due to traffic merging.
The limited capacity to handle peak-hour traffic in-
flows further compounds the congestion issues, mak-
ing it a critical bottleneck.
2) Verification of Identified Bottleneck:
Traffic simulations were conducted using SUMO
to validate the identified bottlenecks. The simulations
modeled traffic flows across the twenty-three lanes.
Using SUMO we can confirm that three bottlenecks
identified need congestion mitigation measures, such
as signal timing optimization, lane reconfiguration,
and pedestrian flow management. The results con-
firmed that among all the central nodes, only the fol-
lowing three are the critical bottlenecks— Intersec-
tion 1 (Kawran Bazar), Intersection 6 (Mohammad-
pur Bus Stand), and Intersection 7 (Dhanmondi 32).
The impact of traffic bottlenecks is evident in the con-
nected intersections. Figure 8-10 shows the intersec-
tions facing bottleneck effects.
Figure 8: Kawran Bazar
Intersection.
Figure 9: Mohammad-
pur Bus Stand.
Figure 10: Dhanmondi
32.
SUMO analysis also showed that the remaining
five major traffic nodes are not congested, which vali-
dates our findings from the traffic intensity-based con-
gestion calculation process using CSG and Maximal
Spanning Tree.
5 CONCLUSION
In our paper, we introduced a novel approach to iden-
tifying bottlenecks in urban road networks by calcu-
lating road congestion levels based on traffic intensity.
First, we gathered traffic intensity data to assess the
Identification of Traffic Bottlenecks in Central Dhaka Through Spreading Graph-Based Congestion Analysis
133
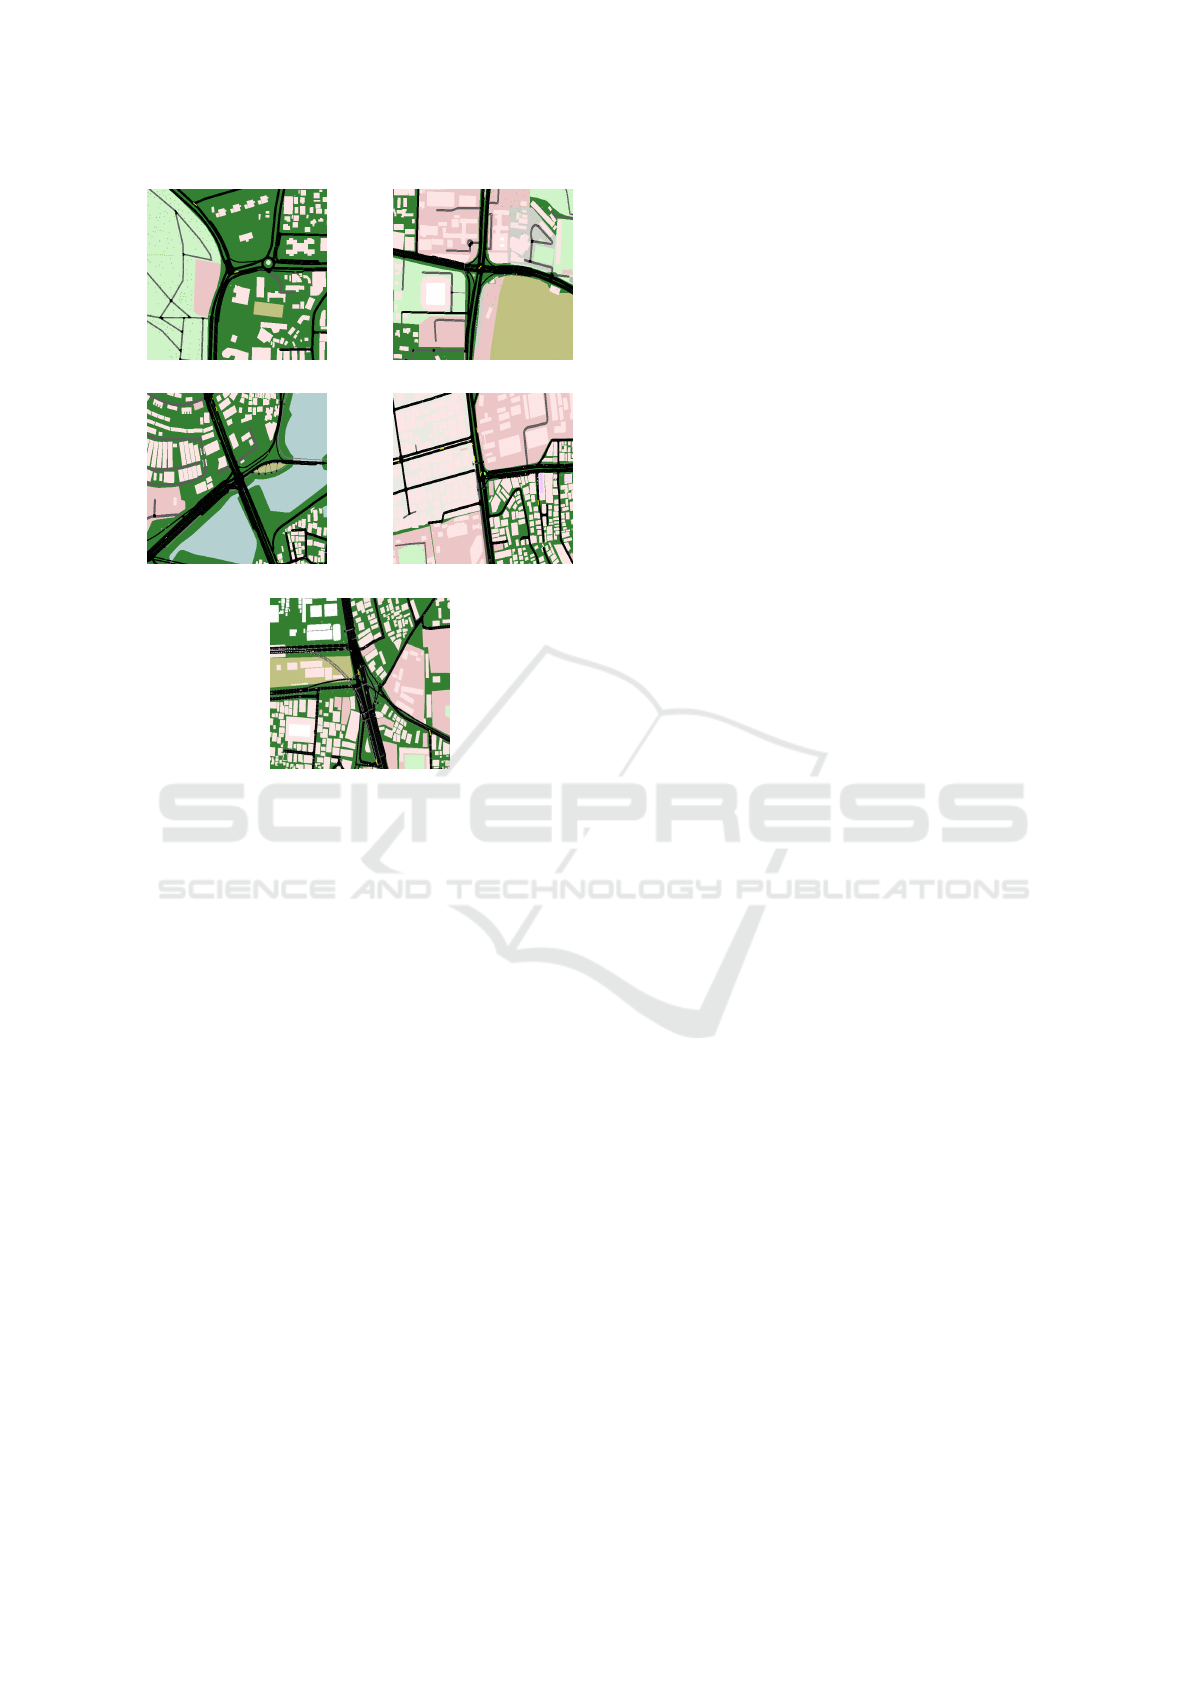
(a) (b)
(c) (d)
(e)
Figure 11: (a) Shahed Captain Mansur Ali Sarani (Kakrail);
(b)Shahbagh Intersection; (c) FDC Intersection; (d) Science
Lab Intersection; (e) Farmgate Intersection.
severity of congestion on individual road segments.
We then proposed an algorithm to connect congestion
correlations between road segments, forming CSG
that maps the spread of congestion across the net-
work. To analyze these graphs, we constructed max-
imal spanning trees to identify critical connections
between congested areas. Using the road conges-
tion intensity, we calculated the congestion costs for
road segments, allowing us to pinpoint bottlenecks
in the network. Our method was validated through
simulation using SUMO, demonstrating that bottle-
necks at three key intersection points caused a cas-
cading effect, leading to delays throughout the sur-
rounding area. This approach offers a more refined
technique for identifying traffic bottlenecks, provid-
ing actionable insights for improving road capacity
and mitigating congestion which can be applied to
other major urban cities. In the future, we aim to inte-
grate more detailed road characteristics, such as type,
length, shoulder width, narrowness, etc, into the anal-
ysis to achieve finer-grained identification of bottle-
necks and further enhance urban traffic performance.
ACKNOWLEDGEMENTS
We would like to extend our heartfelt gratitude to
the Information and Communication Technology Di-
vision under the Ministry of Posts, Telecommunica-
tions and Information Technology, Bangladesh for
their generous funding and support, which made
this research possible. Our sincere appreciation
also goes to the Dhaka Transport Coordination Au-
thority under the Ministry of Road Transport and
Bridges, Bangladesh, for their invaluable collabora-
tion throughout the study. Their cooperation have
been instrumental in achieving the objectives of this
research.
REFERENCES
Administration, F. H. (n.d.). Traffic congestion and relia-
bility: Trends and advanced strategies for congestion
mitigation. Accessed: 2024-11-15.
Al Noor, M. and Mehanaz, S. (2022). Analysis of travel
time in urban area of a developing country, context:
Dhaka, bangladesh.
Ali, M., Didar, M., Hosna, A.-U., Moni, S., and Nobi, M. N.
(2022). Traffic jam in bangladesh: An analysis focus-
ing the economic impact. 01:39–43.
Haider, A. A. (2018). Traffic jam: The ugly side of dhaka’s
development. The Daily Star.
Hale, D., Jagannathan, R., Xyntarakis, M., Su, P., Jiang, X.,
Ma, J., Hu, J., and Krause, C. (2016). Traffic bottle-
necks: Identification and solutions.
Hossain, I. and Nower, N. (2022). Traffic data collection
and visualization tool for knowledge discovery using
google maps. International Journal of Software Inno-
vation (IJSI), 10(1):1–12.
Jamil, A. R. M., Ganguly, K. K., and Nower, N. (2020).
Adaptive traffic signal control system using composite
reward architecture based deep reinforcement learn-
ing. IET Intelligent Transport Systems, 14(14):2030–
2041.
Jin, P., Parker, S., Fang, J., Ran, B., and Walton, M.
(2012). Freeway recurrent bottleneck identification
algorithms considering detector data quality issues.
Journal of Transportation Engineering, 138.
Karim, A. A. and Nower, N. (2024). Probabilistic spatio-
temporal graph convolutional network for traffic fore-
casting. Applied Intelligence, pages 1–16.
Ke, R., Zeng, Z., Pu, Z., and Wang, Y. (2018). New frame-
work for automatic identification and quantification of
freeway bottlenecks based on wavelet analysis. Jour-
nal of Transportation Engineering Part A: Systems,
144.
Li, C., Yue, W., Mao, G., and Xu, Z. (2020). Congestion
propagation based bottleneck identification in urban
road networks. IEEE Transactions on Vehicular Tech-
nology, PP:1–1.
VEHITS 2025 - 11th International Conference on Vehicle Technology and Intelligent Transport Systems
134

Long, J., Gao, Z., Ren, H., and Lian, A. (2008). Urban
traffic congestion propagation and bottleneck identifi-
cation. Science in China Series F: Information Sci-
ences, 51:948–964.
Macrotrends (2024). Dhaka population 1950-2024. Ac-
cessed: 2024-11-15.
Mirzahossein, H., Nobakht, P., and Gholampour, I. (2024).
Data-driven bottleneck detection on tehran highways.
Transportation Engineering, 18:100273.
Momin, K., Barua, S., Jamil, M., and Hamim, O. F. (2023).
Short duration traffic flow prediction using kalman fil-
tering. page 040011.
Moshiur Rahman, M. and Nower, N. (2024). Inferring traf-
fic patterns of dhaka city: A spatio-temporal analysis
over a year. Transport and Telecommunication Jour-
nal, 25(4):409–426.
Rahman, M. M. and Nower, N. (2023). Attention based
deep hybrid networks for traffic flow prediction using
google maps data. In Proceedings of the 2023 8th in-
ternational conference on machine learning technolo-
gies, pages 74–81.
Rahman, M. M., Shuvo, M., Zaber, M., and Ali, A. (2018).
Traffic pattern analysis from gps data: A case study of
dhaka city. pages 1–6.
Yuan, S., Zhao, X., and An, Y. (2014). Identification
and optimization of traffic bottleneck with signal tim-
ing. Journal of Traffic and Transportation Engineer-
ing (English Edition), 1(5):353–361.
Yue, W., Li, C., and Mao, G. (2018). Urban traffic bottle-
neck identification based on congestion propagation.
pages 1–6.
Identification of Traffic Bottlenecks in Central Dhaka Through Spreading Graph-Based Congestion Analysis
135
