
IoT-Driven Livestock Monitoring: Leveraging LoRaWAN for Behavior
Analysis and Enhanced Farm Management
Khadijah Febriana, Rahul Thakur and Sudip Roy
Indian Institute of Technology Roorkee, India
Keywords:
Livestock Monitoring, IoT, Sensors, LoRaWAN.
Abstract:
Cattle play a crucial role in farming by providing essential resources such as milk, meat, leather, and labor,
contributing significantly to both economic and social stability in rural areas of India. This work develops an
energy-efficient IoT system based on LoRaWAN to monitor and analyze livestock behavior. The system em-
ploys an MPU6050 sensor and TTGO T-Beam microcontroller to capture livestock’s movement and positional
data. This data is continuously transmitted via a mesh network, utilizing The Things Network and ThingSpeak
for remote analytics. A neural network with two hidden layers and ReLU activation functions is trained with
sparse categorical cross-entropy loss. Validation on a 20% subset of the training data demonstrates high accu-
racy in classifying complex animal behaviors. Classification results, including F1-scores, precision, and recall
metrics, highlight the model’s strong capability in behavior differentiation. Overall, this system enhances an-
imal health and welfare, improves farm productivity, promotes environmental sustainability, and strengthens
India’s food security.
1 INTRODUCTION
The Internet of Things (IoT) is a transformational
technology that connects numerous items over Inter-
net networks, allowing for real-time data collection
and exchange (Lu et al., 2024). This technology has
transformed several industries, particularly agricul-
ture, by driving innovation to improve productivity,
resource efficiency, and sustainability. In crop farm-
ing, IoT systems monitor crucial characteristics such
as temperature, humidity, soil moisture, and nutri-
ent levels to optimize resources and increase yields
(Chamara et al., 2022). Similarly, IoT devices provide
real-time monitoring of animal behavior, health, and
location in cattle farming, giving farmers actionable
data to improve herd management and farm produc-
tivity (McClune et al., 2014) (Ladha et al., 2013).
Agriculture and livestock production are critical
components of India’s economy, employing more
than half of the population and contributing signifi-
cantly to the country’s GDP. Despite its crucial rel-
evance, the sector faces several obstacles, including
the negative consequences of climate change, volatile
commodity prices, and limited access to sophisticated
technologies. Livestock farmers, in particular, face
challenges in successfully monitoring animal health
and well-being, preventing strays and theft, and man-
aging their resources. These difficulties are exacer-
bated in rural settings, where animals frequently graze
freely throughout large distances, making them harder
to follow and protect. IoT offers a disruptive solution
by allowing for real-time monitoring of cattle con-
ditions, detecting behavioral abnormalities, and of-
fering early warnings of health risks (Farooq et al.,
2022). This enables farmers to take prompt, proactive
steps to improve animal care, cut losses, and improve
overall farm management.
While IoT applications in livestock husbandry are
still in their early stages in India, its potential to trans-
form traditional techniques is becoming more widely
recognized. Farmers can use IoT-based systems to
enhance resource utilization, reduce livestock losses,
and detect diseases early, supporting efficient and sus-
tainable farming methods. Monitoring animal move-
ments and behavior can provide crucial information
about health and welfare. Changes in activity pat-
terns frequently indicate stress, illness, or injury, al-
lowing for early intervention (Atthari, 2017). This is
especially critical in rural India, where livestock roam
freely and are more likely to get lost or stolen. IoT-
enabled tracking solutions can help to reduce these
hazards, increase farm security, and boost economic
stability in farming communities.
LoRaWAN (Long Range Wide Area Network),
Febriana, K., Thakur, R. and Roy, S.
IoT-Driven Livestock Monitoring: Leveraging LoRaWAN for Behavior Analysis and Enhanced Farm Management.
DOI: 10.5220/0013296600003944
In Proceedings of the 10th International Conference on Internet of Things, Big Data and Security (IoTBDS 2025), pages 273-280
ISBN: 978-989-758-750-4; ISSN: 2184-4976
Copyright © 2025 by Paper published under CC license (CC BY-NC-ND 4.0)
273
Application
Data
pre-processing
Dataset
structure
Data collection
TTGO T-Beam
MPU6050
The Things Indoor
Gateway
Network Server: TTN
App Server: ThingSpeak
LoRa end-node Gateway Network & App Server
Set of Parameters
Freq: 868 MHz-915 MHz
Transmit power: 14 dBm
Spreading Factor (SF): 12
Bandwidth: 125 kHz, 250 kHz
Tabular Data
Scikit-Learn Train-test-split
Active Searching
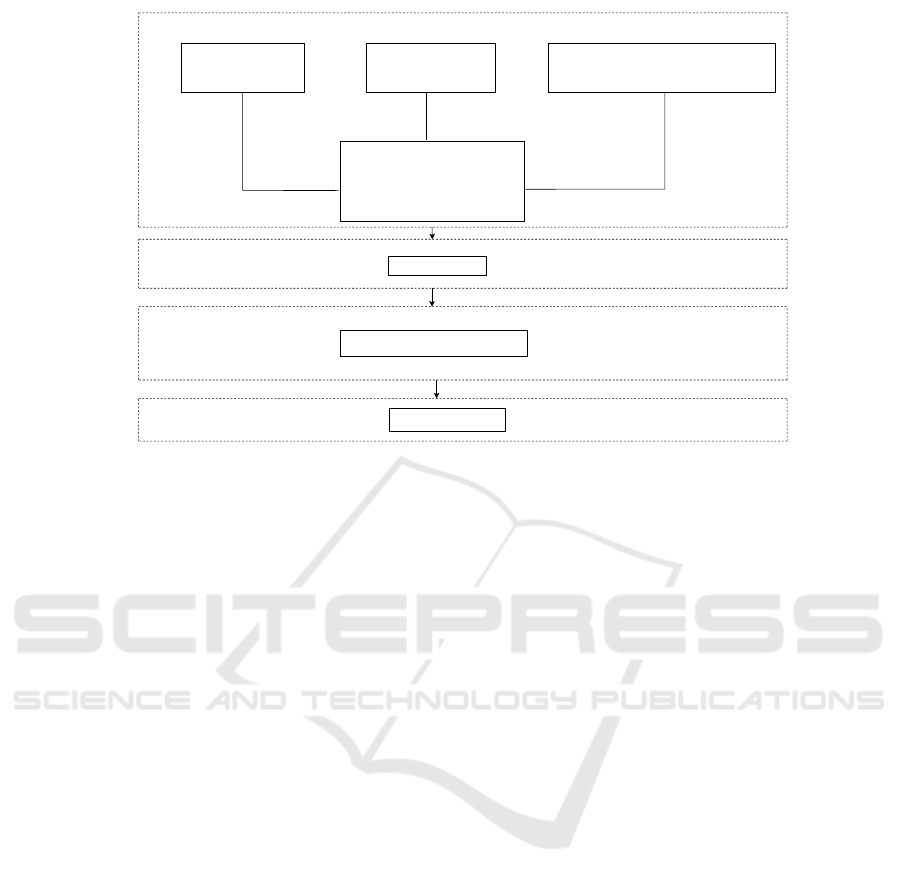
Figure 1: Key Steps in the Proposed Method.
a wireless communication protocol, has emerged
as a game changer for IoT applications in remote
places, thanks to its long-range, low-power, and cost-
effective features. Previous research has demon-
strated LoRa’s effectiveness in tackling connectivity
difficulties in rural areas. (Joshitha et al., 2021) in-
vestigated a LoRa-based system for remote data trans-
mission, emphasizing its potential for IoT in locations
without standard communication networks. Similarly,
(Joshitha et al., 2021) created a long-range tracking
device that uses LoRa to ensure independence from
third-party networks while lowering operational ex-
penses. These tests demonstrate LoRa’s appropri-
ateness for livestock tracking, as it provides depend-
able, long-distance communication even in resource-
constrained environments.
This work’s primary IoT-driven livestock monitor-
ing device was the TTGO T-Beam microcontroller.
This device integrates LoRa, GPS, WiFi, and an
MPU6050 sensor, making it ideal for remote areas
with limited connectivity and power supply. The
integration of GPS allows exact location tracking,
which is critical for animal safety and risk mitiga-
tion during free-range grazing (Angriawan and Anu-
graha, 2019). The WiFi feature enables seamless data
transmission to cloud systems, which allows farmers
to access real-time information remotely (Mahaputra
et al., 2019) (Putra and Romahadi, 2021). Further-
more, the MPU6050 sensor, which can measure ac-
celeration and angular velocity, gives extensive data
on animal motions and orientation, allowing the de-
tection of anomalous behavior that may signal distress
or disease (Fedorov et al., 2015). This combination of
technologies provides India’s scalable, efficient, and
cost-effective livestock management system.
LoRaWAN is chosen because of its unrivaled ben-
efits in rural and agricultural environments. Its long-
range communication capability, low power con-
sumption, and use of unlicensed frequency bands
make it perfect for large-scale applications such as
livestock tracking (Davcev et al., 2018). LoRaWAN
offers a dependable, low-cost alternative to standard
communication technologies in areas with limited in-
ternet and electricity. Using the TTGO T-Beam, this
study intends to address the unique issues that live-
stock producers in India confront by providing an in-
tegrated system to integrate real-time monitoring, lo-
cation tracking, and behavioral analysis. This tech-
nology improves farm management and enables farm-
ers to improve animal care, to cut losses, and to in-
crease economic resilience in order to face the chang-
ing agricultural problems.
2 MATERIALS AND METHODS
Our methodology involves a series of key steps: data
collection and processing, data enhancement, model
implementation, and results analysis. These stages
are designed to ensure a comprehensive approach to
the system’s development and evaluation. Fig. 1 de-
picts the proposed methodology.
IoTBDS 2025 - 10th International Conference on Internet of Things, Big Data and Security
274
2.1 Data Collection
The primary goal of this data collection is to develop
and evaluate a low-cost localization system using the
TTGO T-Beam device, equipped with a GPS sensor,
MPU6050, and connected to a LoRa Gateway. The
dataset collected consists of 1000 data points trans-
mitted over the IN865-867 frequency band, which is
specifically suited for LoRaWAN communication in
this region. The data collection site is situated on the
IIT Roorkee campus in Uttarakhand, India, with co-
ordinates 29
◦
51
′
52
′′
N, 77
◦
53
′
47
′′
E.
The IIT Roorkee campus, spanning approximately
1.48 km
2
, features a mix of academic buildings, labo-
ratories, dormitories, and extensive green areas, with
the majority of the terrain being flat. Despite the over-
all flatness, the presence of tall buildings and dense
vegetation within the campus can significantly impact
LoRa signal propagation. These physical structures
cause signal blockage, multipath fading, and interfer-
ence from other wireless communication systems op-
erating in the same frequency band. Such environ-
mental factors limit the effective transmission range
of the LoRa signals, particularly when the signals
must pass through or around buildings. These chal-
lenges highlight the importance of considering the ter-
rain and the potential obstacles when designing and
deploying a wireless communication system, as they
directly affect signal reliability and the performance
of the localization system.
By collecting data in such an environment, we aim
to simulate real-world conditions that may be encoun-
tered in urban or semi-urban settings, providing valu-
able insights into the system’s ability to overcome
these challenges and ensure reliable communication
and localization over long distances.
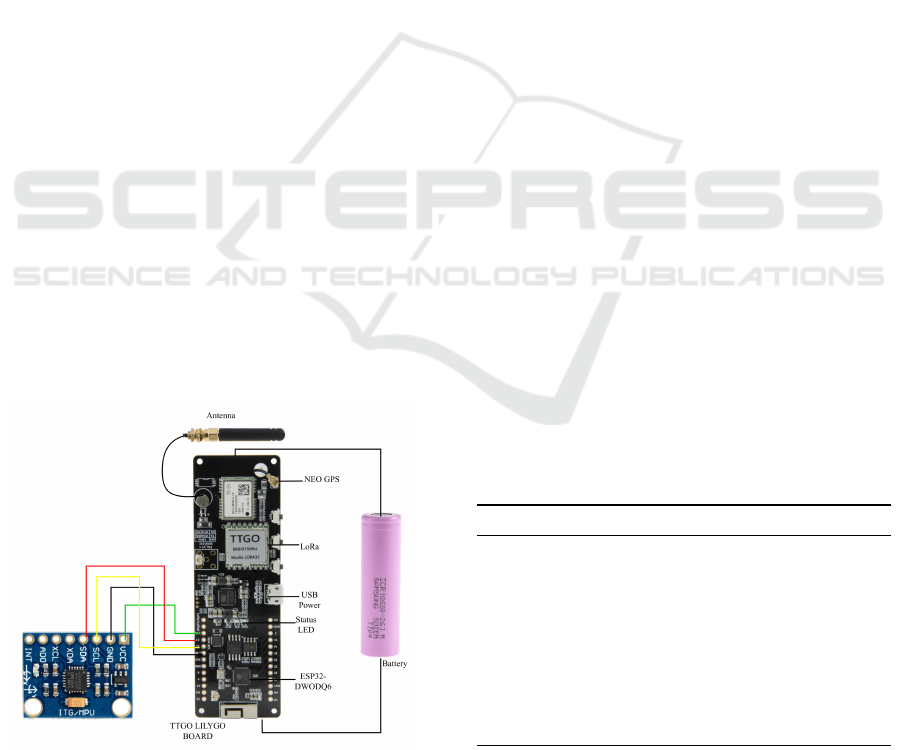
Figure 2: IoT Hardware Prototype.
2.2 Hardware Setup
The hardware setup utilizes a TTGO T-Beam powered
by a lithium battery, along with the NEO-6M GPS
module and communication options such as WiFi,
Bluetooth, and LoRa to build an IoT-based monitor-
ing system (Sugiarto et al., 2023). The TTGO T-
Beam serves as the main component for data process-
ing and networking (Sugiarto et al., 2023).
The MPU6050 sensor, connected via I2C, gathers
motion and orientation data (acceleration and angu-
lar velocity) to measure activities. The LoRa module
provides long-range, dependable data transmission in
rural locations, with WiFi serving as a backup dur-
ing LoRa disturbances to improve reliability. WiFi
is only enabled in specified situations, such as LoRa
transmission failures, firmware updates, or large data
transfers. Deep sleep mode on the TTGO T-Beam de-
tects LoRa failures and shuts idle WiFi, boosting en-
ergy economy, system stability, and cost savings.
The TTGO T-Beam processes data from the
MPU6050 and GPS modules before transmitting it
over LoRa to The Things Indoor Gateway, which
sends it to the cloud for analysis. This system pro-
motes real-time monitoring with a streamlined con-
figuration, as seen in Fig. 2, Table 1 and Table 2. The
TTGO T-Beam is equipped with a Neo-Block based
GPS module (usually based on the u-blox NEO-6M
chip or similar). Sky conditions, obstructions, and
signal interference can affect GPS accuracy. GPS ac-
curacy on the TTGO T-Beam is usually around 2.5
- 5 meters in open conditions with a good signal. At
the same time, the MPU6050 sensor resolution for the
accelerometer is 16384 LSB/g in the ±2g range, and
for the gyroscope, the resolution is 131 LSB/°/ s in
the range ±250°/s. Unlike (Islam et al., 2024), which
used advanced signal analysis, this work focuses on
practical IoT applications for real-time monitoring.
Table 1: Specifications of Node.
Model TTGO T-Beam v1.1 ESP32
ISM bands (MHz) IN865-867
Semtech SX1276
Transmit power 20 dBM
SF 7, 12
BW (kHz) 125 kHz, 250 kHz
Power consumption
Active mode (GPS & LoRa transmission):
100-150 mA
Idle mode: 10-15 mA
Deep sleep mode: 1-2 mA
Weight 52 g
IoT-Driven Livestock Monitoring: Leveraging LoRaWAN for Behavior Analysis and Enhanced Farm Management
275
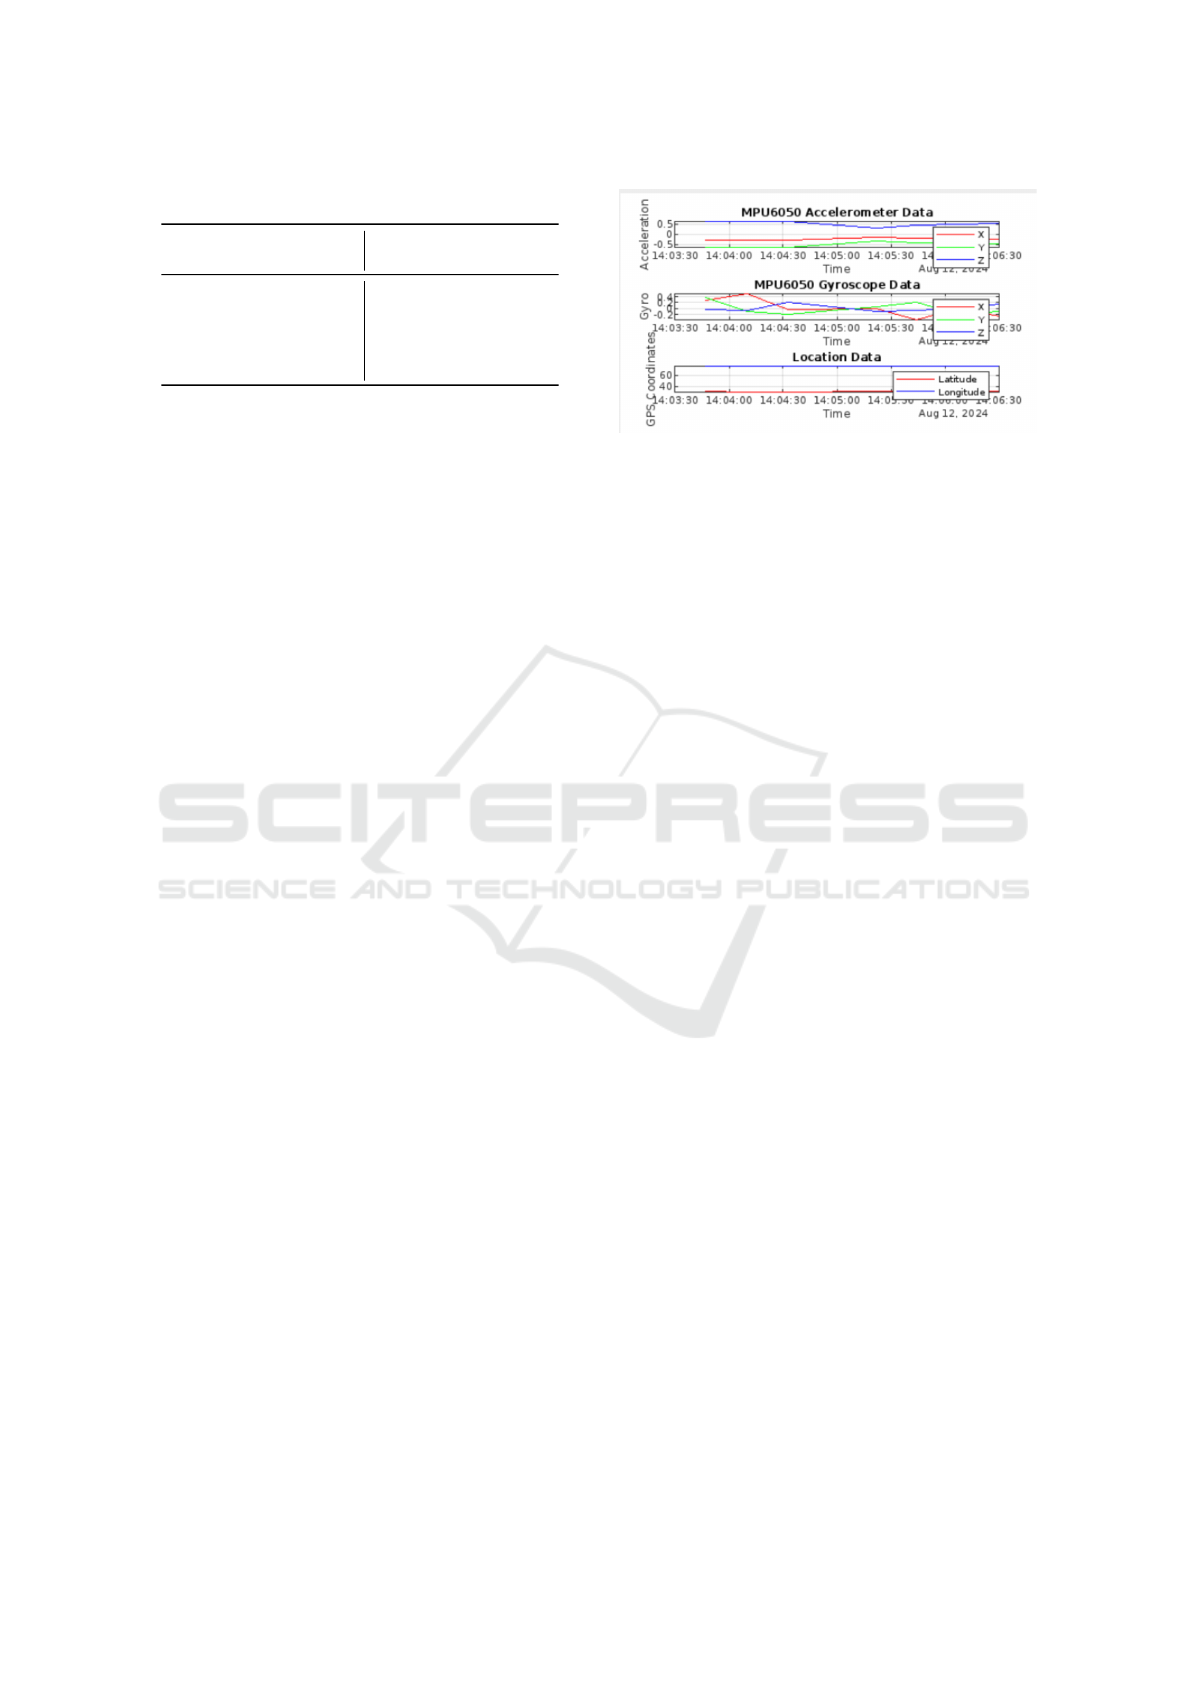
Table 2: Specifications of the Gateway.
Model The Things Indoor
Gateway
Frequency EU868
TX power 20 dBm
Chipset SX1308
Dimensions 90 × 80 × 40 mm
LoRaWAN Spec Version V.1.0.3
2.3 Connection Diagram
This work employs an MPU6050 sensor connected to
a TTGO T-Beam board via the Inter-Integrated Cir-
cuit (I2C) protocol, a widely used two-wire interface
with Serial Clock Line (SCL) and Serial Data Line
(SDA). I2C enables multiple devices to connect to
a single bus using unique addresses, making it effi-
cient for systems with many peripherals (Nguyen and
Dugenske, 2018), (Jouhari et al., 2023). Compared
to SPI, I2C uses fewer pins. It offers the flexibility
of multiple master-slave configurations, making it an
ideal choice for reliable communication between the
MPU6050 sensor and the TTGO T-Beam board (Chen
and Huang, 2023).
The TTGO T-Beam board also includes a GPS
module connecting to the ESP32 microcontroller
via the Universal Asynchronous Receiver-Transmitter
(UART) protocol. UART is a simple serial communi-
cation protocol that sends data between the GPS mod-
ule and the microcontroller via the TX (transmit) and
RX (receive) pins. The GPS module provides crit-
ical position data such as latitude, longitude, time,
and speed, which the ESP32 processes before trans-
mitting over LoRa or cloud storage. Unlike I2C and
SPI, UART does not require a clock signal and instead
transfers data at synchronized baud rates (e.g., 9600
or 115200 bps) (Chen and Huang, 2023) (Sharma
et al., 2018).
By integrating I2C for sensor connectivity and
UART for GPS data sharing, the TTGO T-Beam ef-
fectively gathers, processes, and sends data, making
it ideal for IoT-based monitoring systems.
2.4 Proposed System Model
We have developed an IoT-based system model that
monitors the location and movement of livestock by
integrating the MPU6050 sensor with the TTGO T-
Beam module. The MPU6050 sensor measures three
components of acceleration (Accel x, y, z) and three
components of angular velocity (Gyro x, y, z), as
shown in Fig. 3. These measurements allow for a de-
tailed analysis of the livestock’s movement and orien-
Figure 3: Data Collection for Monitoring and Tracking.
tation, which are critical for understanding their be-
havior. Additionally, the system collects data on lo-
cation (latitude and longitude), movement speed, and
time, which are essential for tracking the livestock’s
geographic position and activity patterns. The com-
bination of acceleration and angular velocity data,
along with GPS data for location tracking, provides
a comprehensive overview of the animal’s behavior
and movement.
As shown in Fig. 3, the GPS data is represented
by a red line for latitude and a blue line for longi-
tude, which tracks the livestock’s geographic move-
ment over time. This visualization allows for easy
tracking of the animal’s movement across various ter-
rains, and helps monitor changes in their behavior that
may indicate stress, illness, or other significant events.
The ability to collect both movement (acceleration
and angular velocity) and location data in real-time
provides valuable insights into livestock behavior and
can aid in early detection of potential issues, improv-
ing overall animal welfare and farm management.
The TTGO T-Beam, equipped with a GPS mod-
ule, serves as the central device in this monitoring
system. The data collected by the system, as shown in
Fig. 4, is crucial for real-time monitoring and perfor-
mance analysis of the livestock. The analysis of ani-
mal movement patterns, activities, and geographic lo-
cations helps farmers make better-informed decisions
regarding the care and management of their livestock.
The MPU6050 sensor provides detailed movement
and orientation data, while the GPS module tracks the
geographic location, both of which are essential for
accurate monitoring.
This system is specifically designed to operate in
rural areas, where cellular network infrastructure may
be sparse or non-existent. By utilizing the LoRa com-
munication protocol, the system ensures reliable data
transmission over long distances, even in areas with
limited connectivity. This capability is critical for
monitoring livestock in remote regions, where tra-
ditional communication networks may not be avail-
able. The ultimate objective of this system is to enable
more informed decision-making in livestock manage-
IoTBDS 2025 - 10th International Conference on Internet of Things, Big Data and Security
276
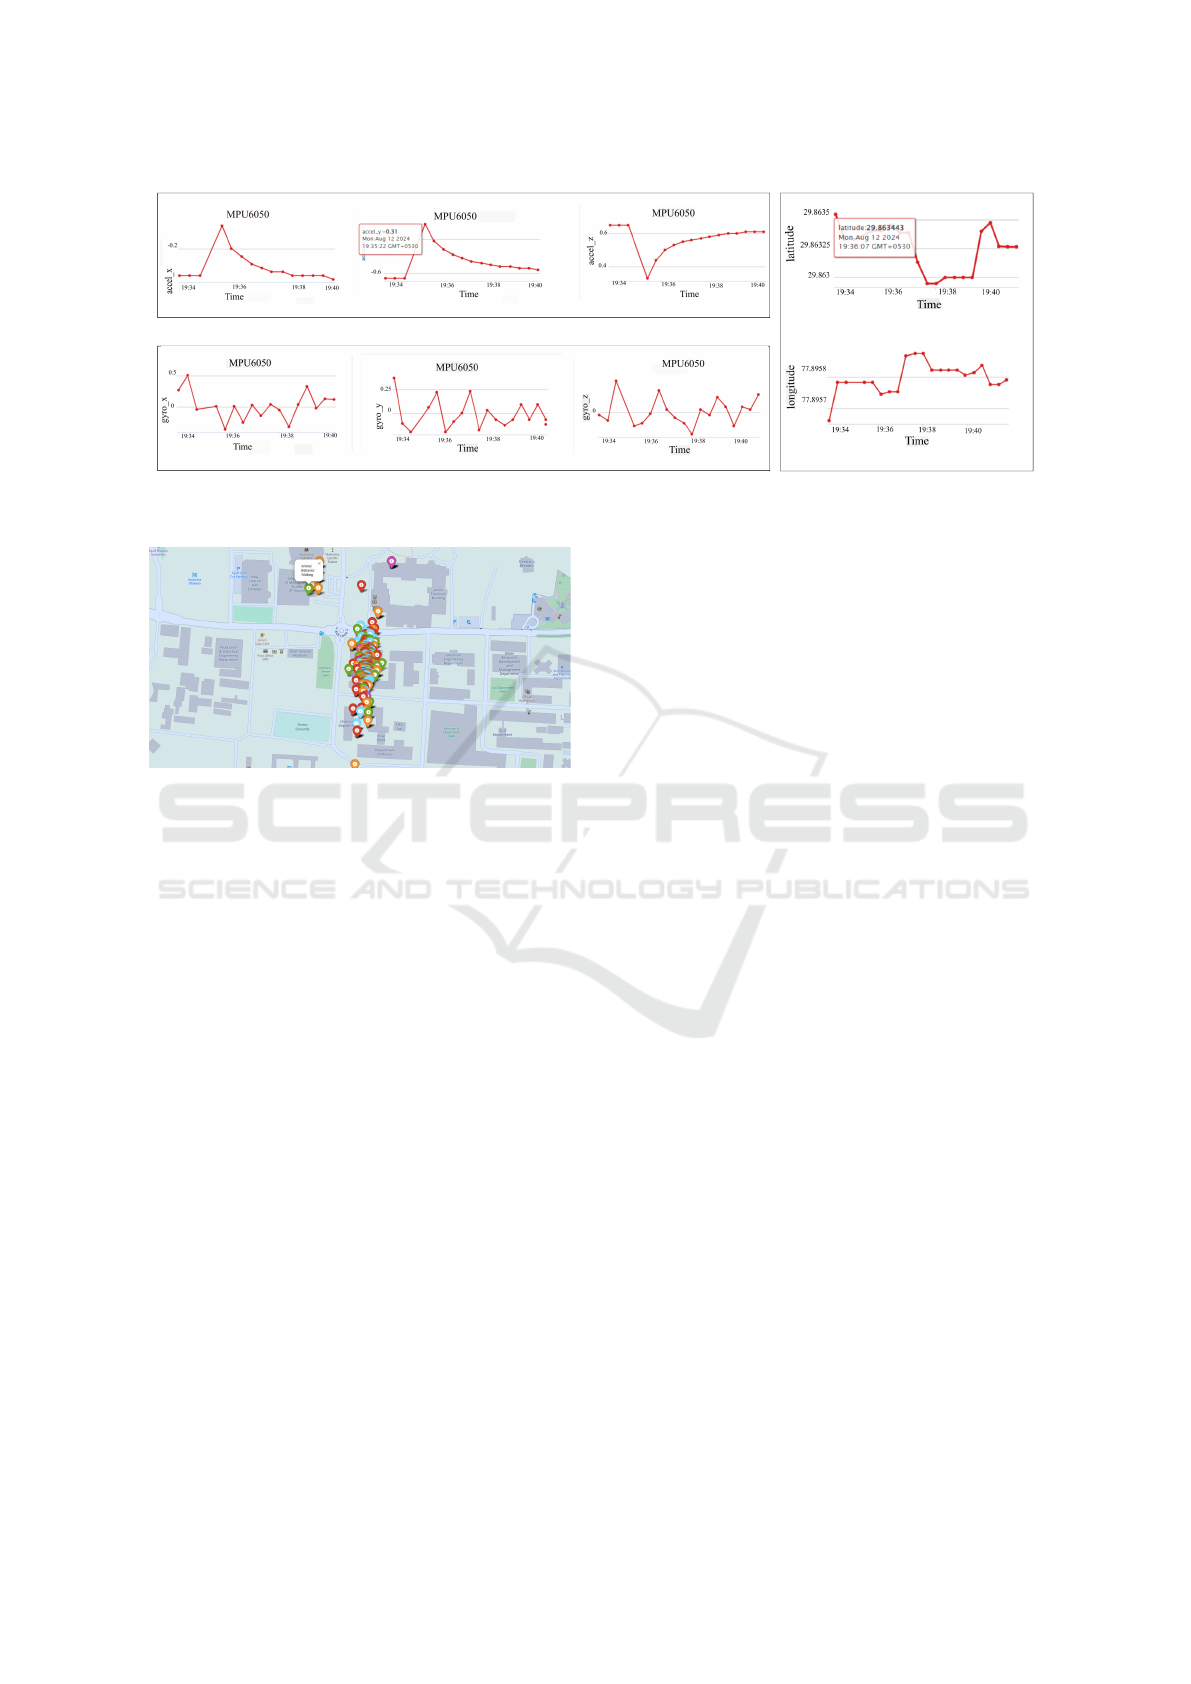
(b)
(a)
(c)
Figure 4: Data collection over time from (a) Accelerometer, (b) Gyroscope and (c) GPS.
Figure 5: Location Tracking.
ment, enhancing farm productivity, improving animal
welfare, and fostering sustainable farming practices.
Consistent and accurate monitoring of the animals’
movements and behaviors through this system helps
ensure that any changes or issues are quickly detected
and addressed. This system helps monitor the posi-
tion of livestock, whether they are moving and in the
right group or area or if their position deviates from
the range location, as shown in Fig. 5.
2.5 Networking
This system employs LoRaWAN technology for long-
range, energy-efficient data communication. TTGO
T-Beam devices collect data and transmit it via The
Things Indoor Gateway, which connects to the inter-
net through The Things Network (TTN). LoRaWAN’s
low-power, wide-area capabilities suit rural areas
where cellular networks are unreliable or unavailable.
Once data reaches the cloud, it is automatically
integrated into ThingSpeak using webhooks. ThingS-
peak is a good platform for livestock monitoring
with TTGO T-Beam and MPU6050 sensors, includ-
ing real-time visualization options like movement
graphs and GPS mapping. Its MATLAB interoper-
ability allows for sophisticated behavior prediction
and anomaly detection analytics. ThingSpeak makes
IoT data administration and visualization easier be-
cause of its low cost, user-friendly interface, and aca-
demic popularity.
ThingSpeak’s real-time dashboard allows contin-
uous livestock monitoring by providing graphical data
on movement patterns and activity levels. This user-
friendly interface makes tracking animal behavior
easier and detecting irregularities, both of which are
necessary for effective farm management. Figure 6
shows how data flows from the TTGO T-Beam to the
cloud for analysis.
The system uses a mesh network architecture as
shown in Fig. 7 to improve coverage and dependabil-
ity in remote regions. According to (Jain et al., 2021),
mesh networks provide redundancy by enabling de-
vices to interact directly and take over if a link breaks.
This decentralized structure increases data transmis-
sion reliability, making the system more durable and
resilient for monitoring cattle under difficult condi-
tions.
3 RESULT ANALYSIS
This work uses temporal data from a GPS module and
MPU6050 sensor to track location and movement.
The model pipeline classifies livestock behaviors us-
ing neural network analysis of multidimensional sen-
sor data such as accelerometer, gyroscope, GPS, and
temporal characteristics as shown in the Fig. 4. Fol-
lowing data preprocessing and feature scaling, the
neural network, which consists of two hidden lay-
ers with ReLU activation, is trained for 100 epochs
and verified on a 20% subset of training data to en-
sure performance stability. The final test accuracy
and classification report—which includes precision,
recall, and F1-scores for each class—demonstrates
the model’s ability to distinguish between distinct an-
imal behaviors. High metrics reflect the model’s ef-
IoT-Driven Livestock Monitoring: Leveraging LoRaWAN for Behavior Analysis and Enhanced Farm Management
277
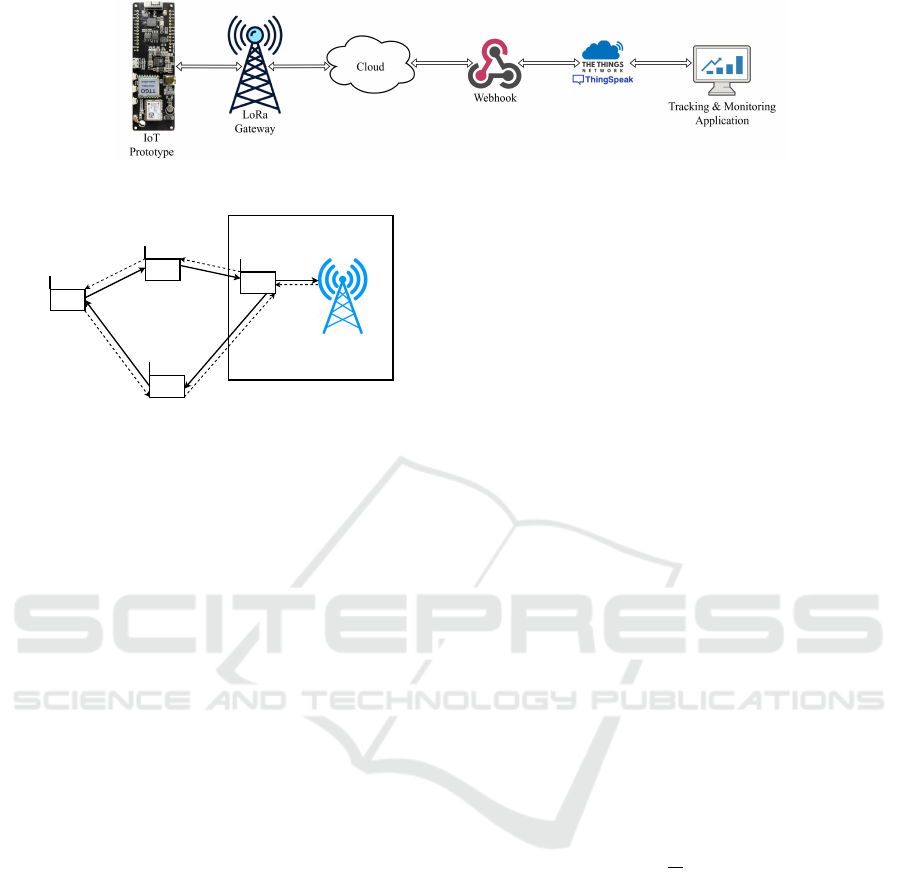
Figure 6: Network Connection for The IoT-based System for Livestock.
L2
L3
L1
L4
LoRa Coverage Area
LoRa
Gateway
Figure 7: Mesh Network.
ficacy in behavior recognition, but lower scores for
certain classes may identify locations where sensor
signal overlap or data imbalance affects classification
precision. Overall, the results support the model’s ro-
bustness for animal behavior categorization, while the
specific performance metrics provide insights for fur-
ther improvement in terms of feature representation
optimization or dataset diversity enhancement.
From Fig. 8 (a), each line or series of points repre-
sents a distinct metric (precision, recall, or F1-score),
allowing for an intuitive comparison of how well the
model performs in each class. Precision values show
the accuracy of positive predictions for each class, in-
dicating how many of the model’s positive predictions
are right. Recall, on the other hand, measures the
model’s ability to capture all true positives, indicat-
ing how well it recognizes examples of each class.
Finally, the F1-score, a balanced measure that com-
bines precision and recall, gives a complete picture of
the model’s accuracy in each class. Because all metric
values are scaled between 0 and 1, with 1 representing
the optimum score, the y-axis remains fixed within
this range. This arrangement allows us to rapidly
identify which courses are tough for the model, as
lower points or dips in the line indicate regions where
the model may be underperforming.
The training and validation loss curves as illus-
trated in Fig. 8 (b) provide essential information about
the model’s learning dynamics and generalization
ability. Initially, both training and validation losses
are dramatically reduced, indicating effective feature
learning and model adaptation to the dataset. How-
ever, at epoch 10-15, the validation loss begins to
diverge from the training loss, gradually increasing
while the training loss decreases. This divergence,
which widens the gap between training and valida-
tion losses, indicates overfitting. The model appears
to be learning specific patterns and noise from train-
ing data rather than extracting generalizable charac-
teristics relevant to unseen data, as indicated by the
fluctuations and overall increase in validation loss.
Early halting, dropout regularization, or weight pe-
nalization could all be used to reduce overfitting and
improve generalization. Furthermore, extending the
dataset or using data augmentation may enhance the
model’s ability to generalize. This analysis empha-
sizes the necessity of monitoring loss trends to detect
overfitting, which is necessary for deploying robust
models in real-world applications.
The sparse categorical cross-entropy loss func-
tion, which is used in the model’s training phase, cal-
culates the difference between the model’s projected
probability for the true class and the actual class label.
The loss for a single data point is as in the Eqn 1:
L = − log(p
y
) (1)
where p
y
represents the expected probability of the
true class y, and y represents the instance. For a
dataset with several samples and classes, the aver-
age sparse categorical cross-entropy loss over all in-
stances is given by Eqn 2:
Loss = −
1
N
N
∑
i=1
log(p
(i)
y
i
) (2)
where N is the total number of samples in the dataset,
and p
(i)
y
i
is the estimated probability of the correct
class y
i
for the i-th sample. In this case, for each data
instance, the model generates a probability distribu-
tion across all potential classes. The sparse categor-
ical cross-entropy loss function penalizes the model
according to how far the predicted probability for the
true class deviates from 1. The closer p
(i)
y
i
is to one for
the correct class, the lower the loss for that instance.
The loss function encourages the model to pro-
vide a high probability to the correct class and a
low probability to the incorrect class. During train-
ing, the model’s weights are modified to reduce the
average loss across all occurrences, enhancing the
model’s ability to predict the proper class label. The
IoTBDS 2025 - 10th International Conference on Internet of Things, Big Data and Security
278
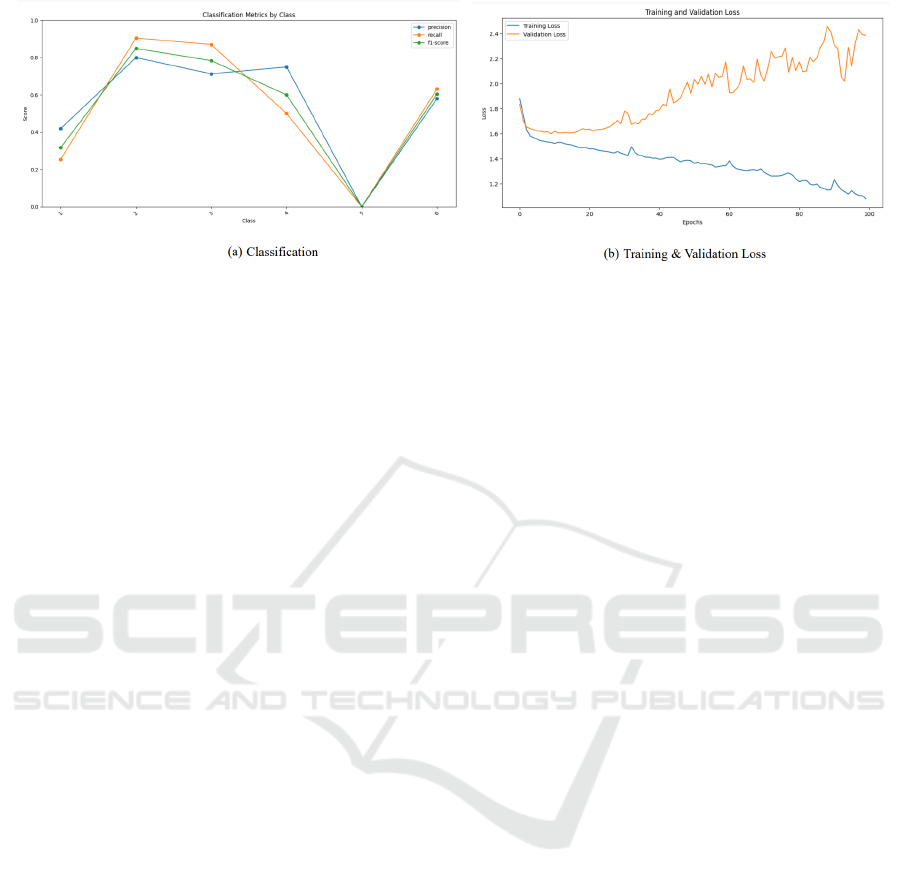
Figure 8: (a) Classification Metrics and (b) Training and Validation Loss.
training and validation loss curves in Fig. 8(a) reflect
the sparse categorical cross-entropy loss estimated at
each epoch. The training loss steadily drops as the
model optimizes to better suit the training data, how-
ever the validation loss gradually increases after a
certain point, indicating probable overfitting. By de-
creasing this loss function, the model increases clas-
sification performance until it begins to memorize the
training data as evident from the rising validation loss.
4 CONCLUSIONS
In this paper, we have designed an IoT-based sys-
tem that can effectively track and monitor livestock
animals, ensuring low power consumption and long-
distance communication capabilities. Hence, this sys-
tem is suitable for remote areas with limited cellular
network access. Such real-time monitoring systems
can prevent theft and loss of livestock animals, which
are common issues in livestock farming. This system
can help identify the specific activities based on the
behavior and movement patterns of the animals by
analyzing the GPS, accelerator, and gyroscope data.
Future enhancements of this system could involve
improving the range and quality of LoRa signals in
challenging environments like dense forests. Opti-
mizing the power consumption for better battery life
and incorporating additional sensors to monitor an-
imal health and environmental conditions could fur-
ther enhance the capabilities of the proposed system.
Applying machine learning-based techniques to ana-
lyze large datasets may provide valuable insights into
the movement of livestock animals and their health
conditions. Moreover, features like voice commands
or automated report generation will improve the user
interaction and decision-making process in the next
versions of the system in the future.
ACKNOWLEDGEMENTS
This work was partially supported by the Doctoral
Fellowship in India (DIA) program of the Ministry
of Education, Government of India.
REFERENCES
Angriawan, R. and Anugraha, N. (2019). Sistem Pelacak
Lokasi Sapi dengan Sistem Komunikasi LoRa. Inspi-
ration: Jurnal Teknologi Informasi dan Komunikasi,
9(1):33–39.
Atthari, A. (2017). Sistem Tracking Position Berdasarkan
Titik Koordinat GPS Menggunakan Smartphone. Ju-
rnal Infomedia: Teknik Informatika, Multimedia, dan
Jaringan, 2(1):2549–1180.
Chamara, N., Islam, M. D., Bai, G. F., Shi, Y., and Ge,
Y. (2022). Ag-iot for crop and environment monitor-
ing: Past, present, and future. Agricultural systems,
203:103497.
Chen, J. and Huang, S. (2023). Analysis and Comparison of
UART, SPI and I2C. In 2023 IEEE 2nd International
Conference on Electrical Engineering, Big Data and
Algorithms (EEBDA), pages 272–276.
Davcev, D., Mitreski, K., Trajkovic, S., Nikolovski, V., and
Koteli, N. (2018). Iot agriculture system based on lo-
rawan. In 2018 14th IEEE International Workshop on
Factory Communication Systems (WFCS), pages 1–4.
Farooq, M. S., Sohail, O. O., Abid, A., and Rasheed, S.
(2022). A survey on the role of iot in agriculture for
the implementation of smart livestock environment.
IEEE Access, 10:9483–9505.
Fedorov, D., Ivoilov, A. Y., Zhmud, V., and Trubin, V.
(2015). Using of measuring system mpu6050 for
the determination of the angular velocities and lin-
ear accelerations. Automatics & Software Enginery,
11(1):75–80.
Islam, K. Z., Murray, D., Diepeveen, D., Jones, M. G., and
Sohel, F. (2024). Lora localisation using single mobile
gateway. Computer Communications, 219:182–193.
IoT-Driven Livestock Monitoring: Leveraging LoRaWAN for Behavior Analysis and Enhanced Farm Management
279

Jain, B., Trivedi, K., Agarwal, S., and Thakur, R. (2021).
MeshSOS: An IoT Based Emergency Response Sys-
tem. In HICSS, pages 1–10.
Joshitha, C., Kanakaraja, P., Bhavani, M. D., Raman, Y.
N. V., and Sravani, T. (2021). LoRaWAN Based Cattle
Monitoring Smart System. In ICEES, pages 548–552.
Jouhari, M., Saeed, N., Alouini, M.-S., and Amhoud, E. M.
(2023). A survey on scalable lorawan for massive iot:
Recent advances, potentials, and challenges. IEEE
Communications Surveys & Tutorials, 25(3):1841–
1876.
Ladha, C., Hammerla, N., Hughes, E., Olivier, P., and
Ploetz, T. (2013). Dog’s life: wearable activity recog-
nition for dogs. In Proceedings of the 2013 ACM inter-
national joint conference on Pervasive and ubiquitous
computing, pages 415–418.
Lu, J., Li, W., Sun, J., Xiao, R., and Liao, B. (2024).
Secure and Real-Time Traceable Data Sharing in
Cloud-Assisted IoT. IEEE Internet of Things Journal,
11(4):6521–6536.
Mahaputra, I., Agung, I., and Jasa, L. (2019). Rancang
Bangun Sistem Keamanan Sepeda Motor dengan GPS
Tracker Berbasis Mikrokontroler dan Aplikasi An-
droid. Majalah Ilmiah Teknologi Elektro, 18(3):361–
368.
McClune, D. W., Marks, N. J., Wilson, R. P., Houghton,
J. D., Montgomery, I. W., McGowan, N. E., Gormley,
E., and Scantlebury, M. (2014). Tri-axial accelerome-
ters quantify behaviour in the eurasian badger (meles
meles): towards an automated interpretation of field
data. Animal Biotelemetry, 2:1–6.
Nguyen, V. and Dugenske, A. (2018). An I2C Based Archi-
tecture for Monitoring Legacy Manufacturing Equip-
ment. Manufacturing Letters, 15:67–70.
Putra, A. and Romahadi, D. (2021). Sistem Keamanan
Sepeda Motor Berbasis Internet Of Things (Iot) Den-
gan Smartphone Menggunakan Nodemcu. Jurnal
Teknologi Terpadu, 9(1):77–87.
Sharma, R., Pandey, B., Jha, V., Saurabh, S., and Dabas, S.
(2018). Input–output standard-based energy efficient
uart design on 90
´
anm fpga. In System and Architec-
ture: Proceedings of CSI 2015, pages 139–150.
Sugiarto, E., Suhendi, A., Abdussalam, M. Y., Husniah,
Z. A., and Lestari, A. P. (2023). Prototype design of
a fishing boat safety monitoring system using lora and
microsensor devices. JMECS (Journal of Measure-
ments, Electronics, Communications, and Systems),
10(2):77–85.
IoTBDS 2025 - 10th International Conference on Internet of Things, Big Data and Security
280
