
Mobile Data Collection for Depression Analysis: An App Framework for
Monitoring Mood and Depression Using Smartphone and Wearable Data
Eliane Schr
¨
oter
1 a
, Franziska Klein
1 b
, Patrick Elfert
1 c
, Fynn Bredehorn
1
, Julien R
¨
aker
1 d
,
Frerk M
¨
uller-von Aschwege
1 e
and Andreas Hein
1,2 f
1
R&D Division Health, OFFIS - Institute for Information Technology, Germany
2
Assistance Systems and Medical Technology, University of Oldenburg, Germany
Keywords:
Depression, Mood Tracking, Digital Health, Psychotherapy Accessibility.
Abstract:
Depression is a leading cause of disability worldwide, affecting around 5% of the global adult population. To
address this problem, researchers are exploring methods for early detection of relapses, mood swings and their
relation with health data and external influences. The aim of the present study was to evaluate the usability
and feasibility of a mobile application designed for active and passive data collection, with potential future
applications for improving mental healthcare through a virtual therapy assistant. The application allows users
to self-report their mood, complete PHQ-9 questionnaires, and track measures such as sleep, physical activity,
location, smartphone usage, and social media engagement.
A six-week pilot study was conducted with 22 healthy participants (68% male, 32% female). Participants
recorded their mood three times a day and completed weekly mental health assessments. Results showed
that the application effectively collected relevant data and was user friendly. However, limitations included
reliance on self-reported data, short study duration, and occasional technical issues with data collection. De-
spite these limitations, the study showed that it is possible to use smartphones and wearable technologies to
monitor mental health, laying the foundation for future developments in digital therapeutic interventions and
personalized healthcare through app-based virtual therapy assistants.
1 INTRODUCTION
According to the World Health Organization, depres-
sion affects approximately 5% of the global adult pop-
ulation, making it one of the most prevalent mental
health disorders worldwide (WHO, 2023).
Depression can affect anyone. Risk factors in-
clude, for instance, traumatic experiences, genetic
predisposition, age, pre-existing illness, stress or so-
cial isolation (WHO, 2023). The core symptoms in-
clude persistent depressed mood, loss of interest and
lack of motivation (Nationale Versorgungsleitlinien,
2024). Depression is typically diagnosed when symp-
toms persist for at least two weeks. The severity of the
disorder is determined by the number and intensity of
these main symptoms as well as secondary symptoms
such as fatigue and sleep disturbances (Nationale Ver-
a
https://orcid.org/0009-0001-4637-0942
b
https://orcid.org/0000-0002-9752-5203
c
https://orcid.org/0000-0002-9834-0702
d
https://orcid.org/0009-0005-5153-906X
e
https://orcid.org/0009-0001-4960-4097
f
https://orcid.org/0000-0001-8846-2282
sorgungsleitlinien, 2024). In severe or chronic cases,
depression can lead to significant health risks, includ-
ing inability to work, and, in extreme cases, suicide
(WHO, 2023).
Treatment for depression commonly includes cog-
nitive behavioral therapy (CBT) (Kazantzis et al.,
2018), which is often supplemented with medica-
tion in severe cases (WHO, 2023). Despite increas-
ing awareness, significant challenges remain, such
as limited access to treatment (Deutscher Bundestag,
2022), misdiagnosis, and reluctance to seek treat-
ment (Kessler et al., 2002). In addition, current
healthcare systems often lack the capacity to provide
continuous monitoring, although the relapse rate for
depression ranges between 40% to 60% (Nationale
Versorgungsleitlinien, 2024). Continuous monitor-
ing of mood, sleep patterns, physical activity, and so-
cial interactions could enable more personalized and
timely interventions, thus improving long-term out-
comes (Mohr et al., 2017). Integrating innovative dig-
ital tools such as mobile applications and wearable
technology offers a scalable and accessible approach
to complement current treatment methods. Thanks
to unobtrusive sensors, these devices can be used to
Schröter, E., Klein, F., Elfert, P., Bredehorn, F., Räker, J., Aschwege, F. M. and Hein, A.
Mobile Data Collection for Depression Analysis: An App Framework for Monitoring Mood and Depression Using Smartphone and Wearable Data.
DOI: 10.5220/0013298700003911
Paper published under CC license (CC BY-NC-ND 4.0)
In Proceedings of the 18th International Joint Conference on Biomedical Engineering Systems and Technologies (BIOSTEC 2025) - Volume 2: HEALTHINF, pages 781-788
ISBN: 978-989-758-731-3; ISSN: 2184-4305
Proceedings Copyright © 2025 by SCITEPRESS – Science and Technology Publications, Lda.
781

monitor mental health, detect mood swings, and sup-
port early interventions (Torous et al., 2018).
Research has linked several factors to mood
swings in depression, including demographic vari-
ables (e.g., gender, age, relationship status) (WHO,
2023; Grundstr
¨
om et al., 2021), physical activity
(Kvam et al., 2016; Stanton and Reaburn, 2014), vi-
tal signs, sleep quality (Irwin, 2015; Short and Louca,
2015; Rykov et al., 2021), weather conditions (Denis-
sen et al., 2008; Klimstra et al., 2011; Taniguchi et al.,
2022), and location (Masud et al., 2020). Moreover,
research showed that individuals with depression of-
ten have increased phone use, and excessive screen
time was shown to be associated with poorer men-
tal health outcomes (Razavi et al., 2020; Asare et al.,
2021; Javaid et al., 2022). At the same time excessive
social media use, particularly among young women,
is correlated with greater depressive symptoms as
well (Fardouly et al., 2015; Thorisdottir et al., 2019;
Bengtsson and Johansson, 2022; Cunningham et al.,
2021; Drouin and Abbasi, 2019). Moreover, Hong et
al. applied machine learning based to Global Posi-
tioning Service (GPS) and phone usage to detect de-
pressive symptoms (Hong et al., 2022), while Ghosh
et al.’s achieved 78% accuracy in emotion recognition
from typing patterns (Ghosh et al., 2019). Similarly,
Masud et al. integrated several smartphone metrics
such as physical activity and time spent at home to
predict depression severity using PHQ-9 scores (Ma-
sud et al., 2020).
Building on these findings, we developed a mobile
application (app) that collects both active data such
as mood ratings and questionnaire responses, as well
as passive data from smartphones and wearable de-
vices. This approach aimed to complement existing
mental health apps by incorporating a wider range
of behavioral and lifestyle factors. Although exist-
ing apps have been shown to be effective (Bakker
and Rickard, 2017), they often have limitations. For
instance, MindDoc (MindDoc, 2023) tracks mood
symptom management, but does not integrate social
media data. Woebot (Fitzpatrick et al., 2017) provides
AI-driven CBT and personalized mood feedback, but
does not collect passive behavioral data from wear-
able devices. In addition, many mental health apps
lack formal regulations and rely heavily on user in-
put, often overlooking individual differences.
Our goal was to embed established processes into
an app and evaluate that app, which was iteratively
adapted to meet the specific needs of the target group
while adding factors such as social media consump-
tion and smartphone usage. By linking mood data
with passively and actively recorded data, the app al-
lows for monitoring a comprehensive range of factors
influencing depression. Developed within the DAIsy
project (Developing AI ecosystems improving diag-
nosis and care of mental diseases), the DAIsy data
collector (DC) app will be integrated into a larger
ecosystem that aims to address limited mental health
resources, support continuous monitoring of condi-
tions with high relapse risk, and personalizing treat-
ment. Wearables integrated into the ecosystem cap-
ture health and behavioral data, like heart rate and
physical activity, to improve mood monitoring (Klein
et al., 2023). To assess the functionality and usability
of the DAIsy DC app, we conducted a six-week pilot
study with 22 healthy individuals, focusing on quali-
tative assessment of user experience and app perfor-
mance.
2 DAIsy DATA COLLECTOR (DC)
APP
DAIsy DC was developed for Android and collects
data both actively (user input required) and passively
(no user input required). The overall architecture of
the app is shown in Figure 1.
2.1 Passive Data Acquisition
Table 1 summarizes the passive data collected via
smartphones and wearable devices. Wearable devices
such as smartwatches can be integrated via the Google
Health Connect interface. Currently, the app focuses
on three key categories of passive wearable data: ac-
tivity, sleep, and vital signs are included, as these
metrics provide more accurate and reliable measure-
ments compared to manual user input. If wearables
are unavailable, apps like Google Fit can track phys-
ical activity. Heart rate and heart rate variability are
primarily collected through smartwatches or compati-
ble apps such as Google Fit. Similarly, sleep duration
is measured using these sources.
Weather and bio-weather data are obtained from
OpenWeather and the German Weather Service
(Deutscher Wetterdienst, 2024) and capture param-
eters such as minimum and maximum temperatures,
perceived temperature, air pressure, humidity, and the
corresponding date and time. For bio-weather, the
date is logged along with its potential impact on well-
being, pain sensitivity, headaches, sleep quality, con-
centration, irritability, and depression. The location is
also stored in the database in encrypted form.
Phone usage, including screen time and time spent
on specific apps, is passively recorded using An-
droid’s internal functionality through the Android Us-
age Stats Manager.
Using GPS technology, the user’s location is
recorded and categorized into predefined categories
such as home, work, or leisure areas. Users must
specify these locations once in the app. Any location
not specified is classified as ’location’ without further
HEALTHINF 2025 - 18th International Conference on Health Informatics
782
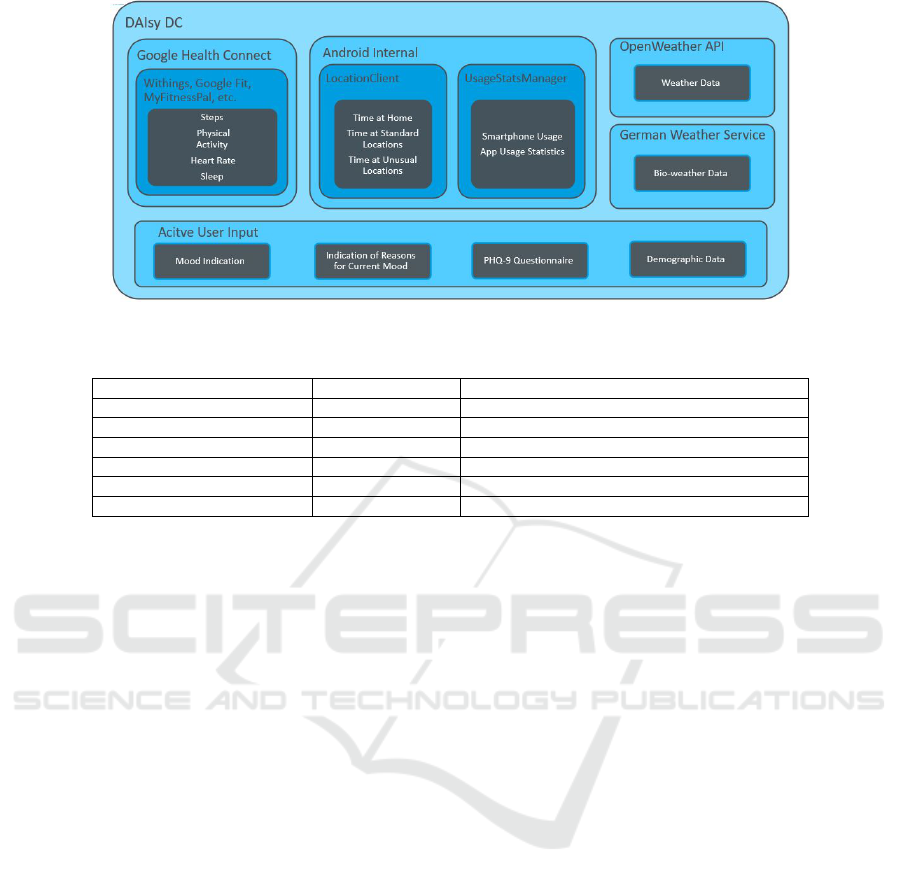
Figure 1: Illustration of the app architecture and data sources.
Table 1: Summary of passively collected data.
Data Type Sampling Rate Source
Physical Activity once per day Smartwatches, Withings App, Google Fit
Sleep once per day Withings Sleep Analyzer, Google Fit
Weather every eight hours German Weather Service, Open Weather API
Location every 15 minutes GPS
Smartphone Usage once per day Android Usage Stats Manager
Social Media Consumption once per day Android Usage Stats Manager
categorization. To protect privacy, all location data
are encrypted.
Compared to existing apps like mindDoc (Mind-
Doc, 2023), DAIsy DC differs in that it captures a
broader range of passively collected data, including
social media consumption, smartphone usage, and
bio-weather influences. These factors have previ-
ously been underrepresented in other platforms fo-
cusing on mood and well-being, making DAIsy DC
a more comprehensive mental health monitoring tool.
2.2 Active Data Acquisition
Active data acquisition includes user-initiated inter-
actions with the app, including submitting current
moods, providing reasons for that specific mood and
completing surveys.
2.2.1 Questionnaires
Demographic data is collected via a short question-
naire. The questionnaire includes six questions cov-
ering age, gender, marital status, educational back-
ground, number of children, and smoking habits. In
addition, the app integrates the PHQ-9 questionnaire,
a widely used screening tool for assessing the sever-
ity of depression (Kroenke et al., 2001). It assesses
key indicators of depression such as sleep quality,
physical condition, mood, eating behavior, and suici-
dal ideation. Results are presented graphically, along
with explanations of the scores and links to resources
for further support if needed.
2.2.2 Mood Tracking
The mood tracking feature requires active user input
as it cannot be passively captured. The app uses a
simplified version of the Circumplex Model of Af-
fect (Posner et al., 2005), which organizes emotions
along two dimensions: valence (positive vs. neg-
ative) and activation (energizing vs. deactivating).
Users choose from a range of emotions (e.g., ”happy,”
”sad,” ”angry,” and ”nervous”) using sliders to adjust
the intensity of their mood. Each emotion is visu-
ally represented by a smiley and ranges from unex-
pressed to very expressed. The values are stored in
the database with values from 0 (unexpressed) to 3
(very expressed) (cf. Figure 2a). In addition users can
adjust sliders for energy levels, lethargy, and general
discomfort. As shown in Figure 2b, mood changes
are visualized on a separate screen, allowing users to
track their emotional states.
2.2.3 Mood Reasons
After submitting their mood, users are asked to indi-
cate the factors that influence their emotional state (cf.
Figure 2c). Users can choose from a variety of prede-
fined categories such as news, weather, stress, fam-
ily, and more. For more flexibility, an open text field
is available for additional input if none of the listed
reasons apply. These reasons were selected based
on aforementioned known influences on mental well-
being, such as physical health, environmental condi-
tions, and social relationships (Umberson and Mon-
tez, 2010). This feature allows users to track both
Mobile Data Collection for Depression Analysis: An App Framework for Monitoring Mood and Depression Using Smartphone and
Wearable Data
783
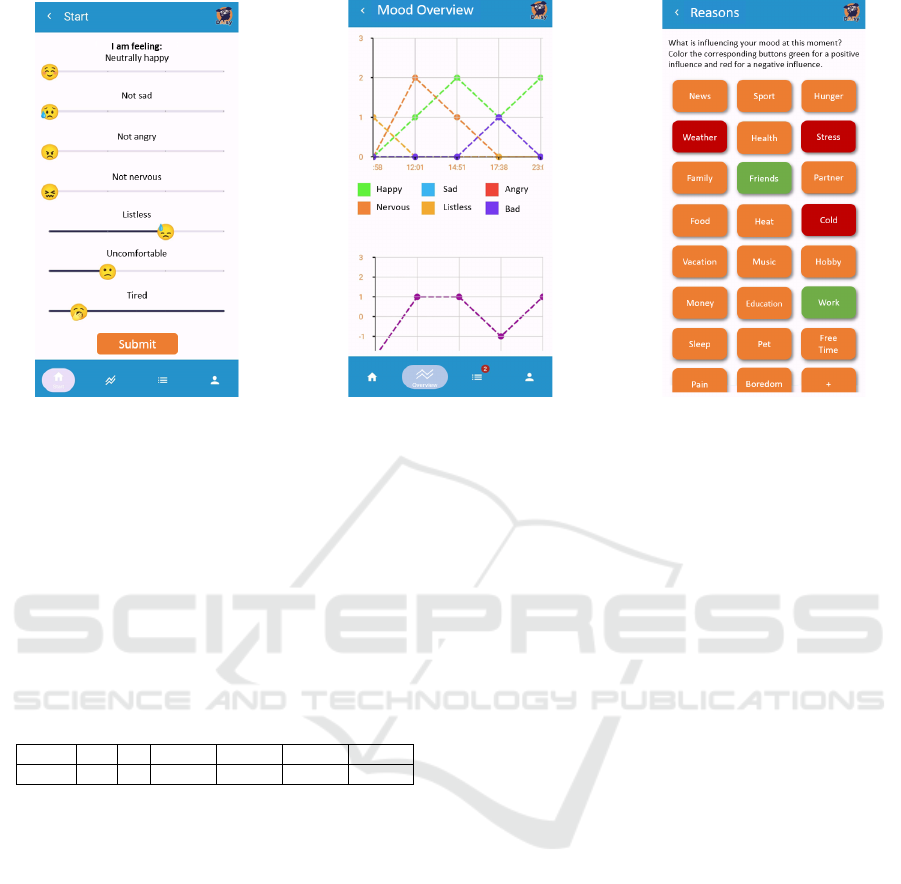
(a) (b) (c)
Figure 2: Image of the selectable moods and according sliders (a), according overview of chosen moods and energy level (b)
and the list of selectable influences on the current mood (c).
general and personal mood influences that may not be
captured through passive data collection. Users can
also indicate whether the selected reason had a posi-
tive (green highlighted) or negative impact (red high-
lighted) on their mood (cf. Figure 2c).
2.3 Exemplary Data Collection
2.3.1 Participants
Table 2: Overview of participants’ demographics.
User m f 18-23 24-30 31-40 51-60
22 15 7 4 10 2 6
A total of 22 individuals (15 male, 7 female) partici-
pated in the study to assess the functionality and us-
ability of the DAIsy DC app. Participants ranged in
age from 18 to 60 years, with a mean age of 34 ±
12 years. The demographic data of the participants
are listed in Table 2. The study was approved by the
OFFIS Ethics Board and participants gave their writ-
ten informed consent.
To participate, individuals were required to own
an Android-compatible smartphone with an operating
system version of at least Android 10. Individuals di-
agnosed with depression were excluded, as the study
focused on evaluating the app in a healthy population
to enable a comprehensive assessment of the app’s us-
ability and functionality prior to its use among users
with specific mental health needs.
During the six-week pilot study period, partic-
ipants were provided with a smartwatch (Withings
Steel HR) and/or a Withings sleep analyzer. Of the 22
participants, ten used the Withings sleep analyzer, six
received a watch and four preferred to use their own
smartwatch (Fitbit Charge 4, Fitbit Versa 4, Withings
Scan Watch). In six participants, there was an overlap
between the sleep analyzer and the smartwatch.
2.3.2 Data Collection
Active Data. At the start of the study, participants
completed a profile to collect demographic informa-
tion, including their place of residence and, if appli-
cable, other frequently visited locations.
The participants’ primary task was to record their
current mood via the app at least three times a day.
In addition, individuals were asked to provide context
or reasons that influenced their mood for each entry.
Reminders to report their mood were sent twice a day.
In cases where devices, such as a smartwatch or Sleep
Analyzer, were not available, participants manually
logged their sleep duration and activity in Google Fit.
Additionally, participants were asked to complete the
PHQ-9 questionnaire weekly.
Passive Data. Data were continuously collected,
with most data passively gathered in the background,
requiring no active input from participants (cf. Ta-
ble 1).
Questionnaires. At the end of the study, partici-
pants were asked to provide feedback on the app’s
usability and their own technological readiness. Two
questionnaires were used for this purpose: the System
Usability Scale (SUS) (Brooke, 1995) measured the
app’s usability, while the Technology Commitment
(TC) short scale (Neyer et al., 2016) assessed the par-
ticipants’ willingness to use technology.
HEALTHINF 2025 - 18th International Conference on Health Informatics
784
3 DATA EXPLORATION
3.1 Active Data
3.1.1 PHQ-9
The PHQ-9 questionnaire was completed an average
of 4.45 ± 1.68 times. The minimum number of com-
pleted questionnaires was 1, the maximum 6. The av-
erage score was 5.9 for women and 7.3 for men, both
of which were in the non-depressive ranges (healthy
to inconspicuous 0 - 9). Most participants scored
within a range indicating a generally healthy mental
state. However, three participants recorded scores in-
dicating mild or moderate depression (mild depres-
sion: 10 - 14, moderate depression: 15-19).
3.1.2 Mood Tracking and Subjective Mood
Reasons
Table 3: Submission of the moods for each participant and
across all participants per day, week and the entire study
period.
User Day Week Study Period
1 3.88±1.64 26.57±8.9 186
2 1.88±0.78 10.33±5.75 62
3 2.35±1.58 10±6.48 40
4 2.4±1.2 16.43±6.72 115
5 1.93±0.88 11.86±3.48 83
6 1.38±0.5 4.71±2.63 33
7 1.22±0.74 3.5±2 28
8 2.71±0.97 18.57±2.99 130
9 2±0.8 12.86±2.91 90
10 2.93±0.65 19.29±6.42 135
11 3.55±1.1 13.5±7.18 156
12 2.57±1.33 12±8.1 108
13 1.95±0.43 18.71±4.47 84
14 3.12±1.25 14.14±8.9 131
15 2.36±1.05 5.6±6.44 99
16 1.27±0.55 11±2.4 28
17 2±0.79 22.29±2.97 66
18 2.03±0.82 10.83±4.92 65
19 2.59±0.76 13.71±8.26 96
All 2.32±0.72 13.47±5.89 91.34±44.36
Total 34.7±7.86 216.88±91.52 1735
Table 3 displays mood data across daily, weekly
and entire study period. The total number of submis-
sions was 1735 across all participants. Participants re-
ported their mood averagely 2.32 ± 0.72 times a day.
Although six participants completed the study ear-
lier than planned, three of them provided continuous
data over a period of at least three weeks. After each
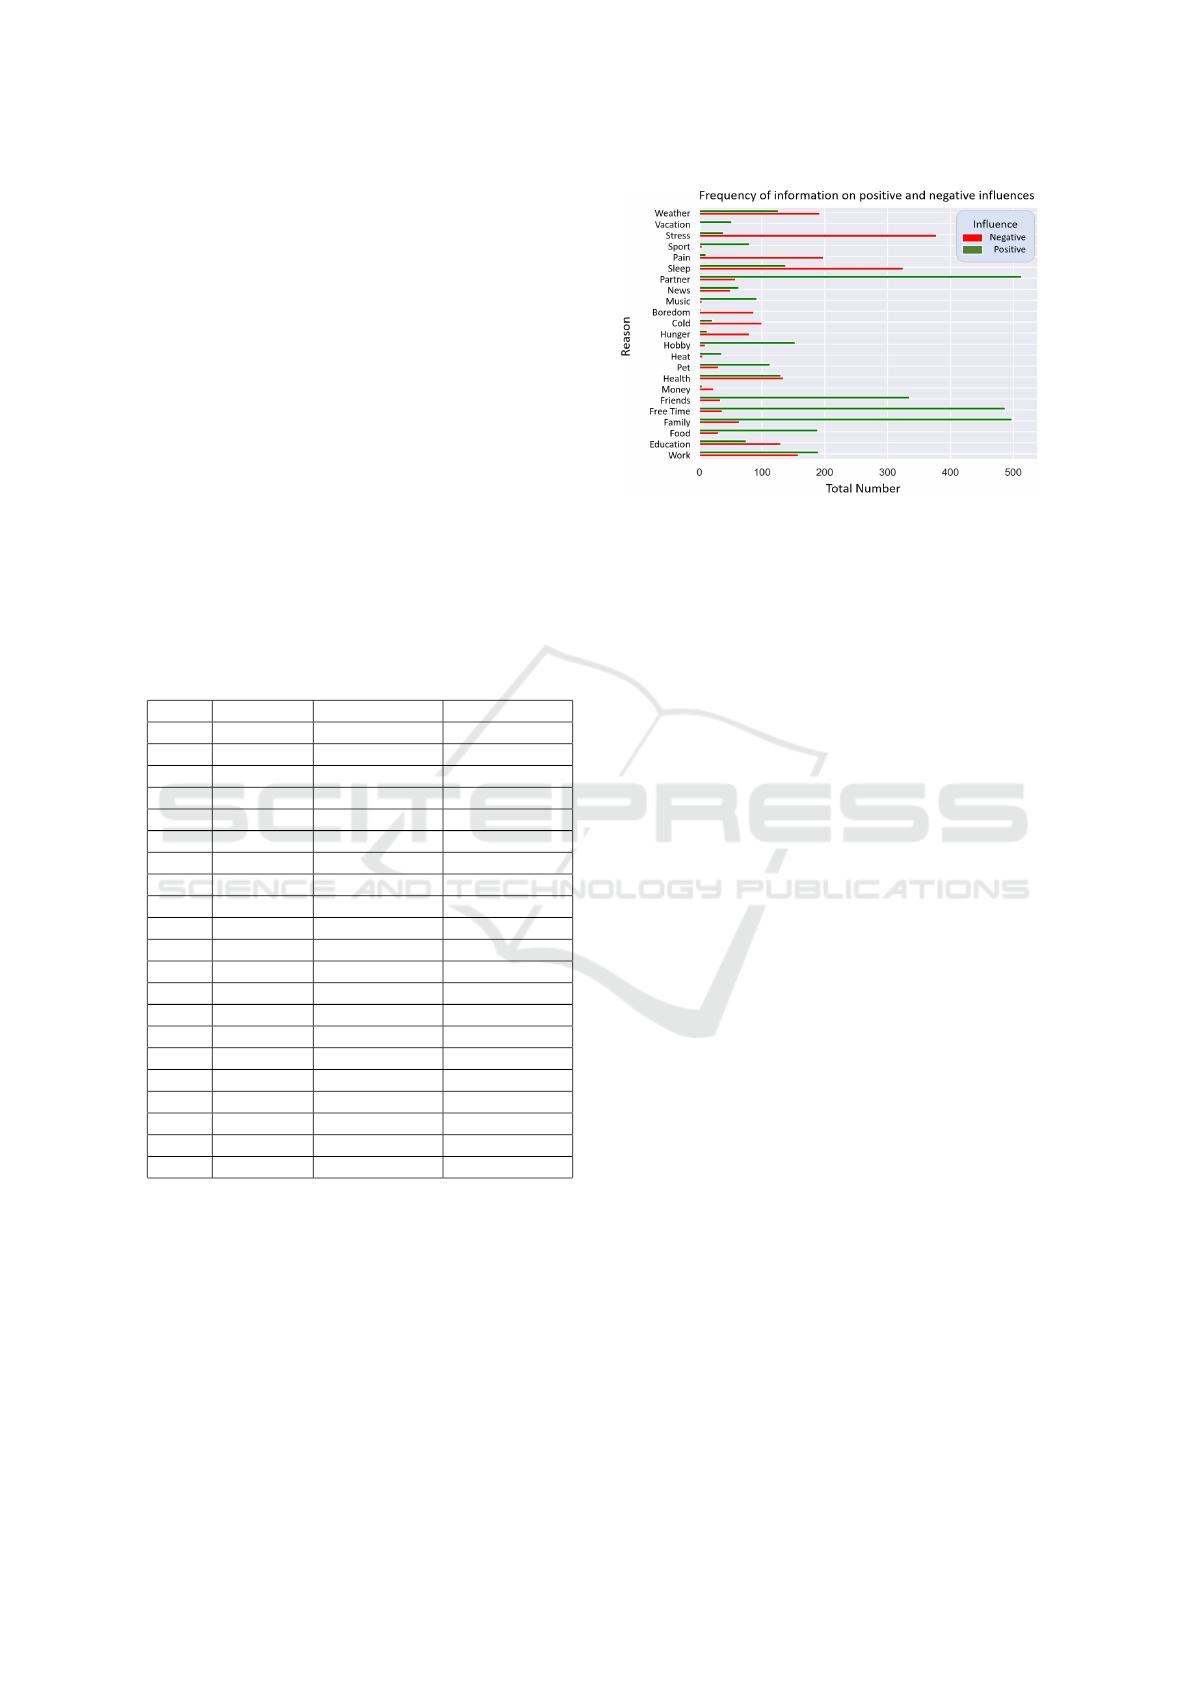
mood submission, participants were asked to indicate
factors that positively and negatively influenced their
emotional state. Figure 3 illustrates the frequency of
each factor. Although optional, participants provided
reasons for 97% of the mood entries. Stress and sleep
Figure 3: Presentation of the frequencies with which a spe-
cific reason was selected either positively or negatively.
were the most frequently cited negative influences. In
contrast, family, friends, partners, and relaxation were
the most commonly recorded positive influences.
3.2 Passive Data
The results of passive data collection can be summa-
rized as follows:
• Step Count: The participants took an average of
4,450 ± 2,504 steps per day, with individual steps
ranging from 2,009 to 11,938 daily steps. The im-
pact of physical activity on mood was individual,
with some participants reporting mood improve-
ments on days with higher step counts. No partici-
pant showed a negative association between phys-
ical activity and mood.
• Sleep Data: Average sleep duration across all
subjects was 7.6 ± 0.8 hours of sleep per day,
which meets recommended guidelines for healthy
adults (Irwin, 2015). Although sleep disturbances
were rarely reported, some technical issues, such
as loss of connection from the sleep analyzer or
sleeping in another bed, resulted in missing data.
• Number of Visited Unspecified Locations: On
average, participants spent 14.5 ± 2.9 hours at
home daily, including sleeping time. During the
study period, participants visited an averaged to
12 ± 6 different locations, apart from the time
spent at home or at work.
• Weather Conditions: The weather’s influence on
varied individually. Most experienced mood im-
provements on clear and snowy days, while rainy
or cloudy conditions tended to have negative ef-
fects. However, some participants reported better
moods on rainy days. Additionally, weather was
included in the list of selectable reasons for the
current mood. Only three participants did not cite
that weather had an impact on their mood. Due to
their variability and the short study period, the bi-
ological weather data did not provide much infor-
Mobile Data Collection for Depression Analysis: An App Framework for Monitoring Mood and Depression Using Smartphone and
Wearable Data
785

mation and needs to be reevaluated after a longer
time period.
• Screen Time and Social Media Use: Daily
smartphone use averaged approximately 3 hours,
with a range of 0.3 hours to 6.5 hours. Time spent
on social media varied from 0.25 to 1.75 hours
per day. The effects of social media use on mood
were highly individual.
3.3 Usability and Technology
Commitment Questionnaire
Following the study, participants provided feedback
on the design and usability of the DAIsy DC app.
The evaluation of the SUS resulted in an average
score of 89.4 ± 3.5 out of 100, which corresponds to a
“very good” usability rating. The average technology
commitment score was 46.4 ± 5.9 out of 60, indicat-
ing that the sample consisted of tech-savvy partici-
pants.
A common point of feedback was the desire to ex-
pand the list of selectable mood influences. Five par-
ticipants suggested adding ”Traffic” or ”Public Trans-
port” as these were common causes of frustration or
anger. Participants also requested an ”Outdoors” or
”Walking” category. Additionally, some participants
suggested adding ”Myself” to reflect self-centered
negative moods that often stem from personal dissat-
isfaction. Other desired additions included ”Procras-
tination” or ”Unproductivity”, with one participant
recommending ”Sexuality” as an option. One par-
ticipant recommended distinguishing specific work-
related influences (colleagues, bureaucracy, home of-
fice).
Participants also suggested extending the list of
predefined locations. Suggestions included adding
frequently visited locations such as family or friends’
homes, to the existing options.
3.4 Discussion
We have developed a first version of a mental health
monitoring app that could, in the future, help with
both early detection of depression and monitoring re-
lapses. We evaluated the app’s usability and function-
ality in a six-week study with N = 22 healthy par-
ticipants. The aim of the app is to collect active in-
puts such as mood and passive data that could later
be used to identify connections between mood and
external influences. The results showed that the app
is suitable for a long-term study and users generally
found it easy to navigate. However, user feedback
also highlighted areas for improvement. Specifically,
participants suggested adding more options for mood
reasons and additional location options. Key areas for
further improvement include:
• Differentiation of Time Spent at Home: The
current GPS-based tracking system does not dif-
ferentiate between work and leisure activities at
home. Introducing a calendar or user input could
be helpful, but may increase user effort.
• Addition of Opposing Moods: The mood track-
ing feature could be refined by allowing opposing
mood categories (e.g., happy - sad, nervous - re-
laxed) to provide deeper insights. In addition, a
stress level query should be incorporated.
• Gamification Methods: Taylor et al. found that
incorporating gamification significantly improved
participation in a study (Taylor et al., 2018). How-
ever, these features should be carefully tailored
to the audience to ensure they increase engage-
ment without overwhelming users or imposing ad-
ditional requirements.
• User Interface (UI) and User Experience (UX):
Further refining the UI and UX will likely im-
prove navigation and create a more cohesive and
visually appealing experience. Improving data
visualization would provide clearer insights into
mood trends over time. Additionally, all data en-
tries, including mood reasons, could be organized
and displayed in a calendar format.
• Personalized Reminders: The timing of the re-
minders to report on the current mood could be
adjusted to suit users’ individual routines (e.g.,
wake-up and sleep times) or triggered when their
smartphone is in use (Nahum-Shani et al., 2016).
• Additional Features: Future app iterations could
include additional features known to support men-
tal health such as mood and depression detection
through voice recognition (Schuller, 2018), jour-
naling (Baikie and Wilhelm, 2005) and to-do lists
to help establish routines. Personalized recom-
mendations triggered by significant mood swings
as well as AI-driven mood trend predictions could
further tailor user support and intervention timing
(Klein et al., 2023).
Limitations of the study include a relatively small
sample size (N = 22), which limits the generalizabil-
ity of the results, although it provided valuable in-
sights at the individual-level. Future research with
larger, more diverse samples, including participants
diagnosed with depression, would allow for a more
comprehensive assessment of the app’s effectiveness.
A broader dataset could also enable users segmenta-
tion based on behavioral patterns such as activity lev-
els or weather sensitivity. Reliance on self-reported
data for mood and behavior metrics may under- or
over-report their experiences. Additionally, the six-
week study duration limits the ability to observe long-
term trends and effects that may develop over longer
periods of time. It would also be useful to link the
HEALTHINF 2025 - 18th International Conference on Health Informatics
786

stated reasons for the current mood with the passively
collected data. Furthermore, technical challenges as-
sociated with data collection by wearables and smart-
phones may have affected data reliability. Addressing
these limitations in future studies will be critical to
refining and improving the functionality and general-
izability of the app.
The integration of DAIsy DC into the DAIsy
project’s virtual therapy assistant (VTA) offers the po-
tential to significantly expand its capabilities in the
future. As described in Klein et al. (Klein et al.,
2023), DAIsy’s framework will enable personalized,
AI-driven therapeutic support with real-time recom-
mendations. This integration would enhance the func-
tionality of the VTA, by providing users with tai-
lored therapeutic suggestions and feedback and en-
abling real-time interventions based on passive data
(e.g., activity levels, location) and active inputs (e.g.,
mood reporting). Additionally, DAIsy VTA includ-
ing DAIsy DC could facilitate tracking user progress,
offer CBT exercises, and provide to support mental
well-being, creating a more personalized, dynamic
and responsive tool for treating depression.
4 CONCLUSION
In this study, we developed and tested DAIsy DC, a
mental health monitoring app that collects both ac-
tive and passive data to support early detection of de-
pression in the future. Our evaluation with healthy
individuals showed that the app is suitable for long-
term use and that overall navigation is easy for users.
However, the study identified key areas for improve-
ment, such as expanding the selection of mood rea-
sons, modifying the mood submission process, and
potential for personalized reminders and gamification
features to increase engagement.
Future iterations of the app should focus on UI
and UX to improve data visualization and usability.
Additionally, expanding functionality to include per-
sonalized interventions, voice recognition, and mood
predictions could further support mental health man-
agement. Integration into the broader DAIsy project
framework offers the potential for tailored, real-time
therapeutic support, leveraging AI-driven recommen-
dations and user insights to create a responsive and
preventive mental health tool.
ACKNOWLEDGEMENTS
The project DAIsy - Developing AI ecosystems im-
proving diagnosis and care of mental diseases is
funded by the German Federal Ministry of Education
and Research (reference: 01IS22085E). Furthermore,
we would like to thank Niclas Braun, Annika Wiebe,
Benjamin Selaskowski and Matthias Guth from the
University Hospital Bonn for their valuable support,
insightful input, and guidance in navigating challeng-
ing situations throughout the study. Additionally, we
would like to express our gratitude to all participants
of this study for their time, commitment, and valuable
feedback.
REFERENCES
Asare, K. O., Terhorst, Y., Vega, J., Peltonen, E., Lager-
spetz, E., and Ferreira, D. (2021). Predicting depres-
sion from smartphone behavioral markers using ma-
chine learning methods, hyperparameter optimization,
and feature importance analysis: Exploratory study.
JMIR mhealth and uhealth, 9:e26540.
Baikie, K. and Wilhelm, K. (2005). Emotional and physical
benefits of expressive writing. Advances in Psychi-
atric Treatment, 11:338–346.
Bakker, D. and Rickard, N. (2017). Engagement in mobile
phone app for self-monitoring of emotional wellbeing
predicts changes in mental health: Moodprism. Jour-
nal of Affective Disorders, 227:65–72.
Bengtsson, S. and Johansson, S. (2022). The meanings
of social media use in everyday life: Filling empty
slots, everyday transformations, and mood manage-
ment. Social Media + Society, 8.
Brooke, J. (1995). Sus: A quick and dirty usability scale.
In Usability Evaluation in Industry, page 189.
Cunningham, S., Hudson, C. C., and Harkness, K. L.
(2021). Social media and depression symptoms: a
meta-analysis. Research on Child and Adolescent Psy-
chopathology, 49:241–253.
Denissen, J., Butalid, L., Penke, L., and Aken, M. (2008).
The effects of weather on daily mood: A multilevel
approach. Emotion (Washington, D.C.), 8:662–667.
Deutscher Bundestag (2022). Wartezeiten auf eine
psychotherapie: Studien und umfragen. Wis-
senschaftliche Dienste, 36:987–1007.
Deutscher Wetterdienst (2024). Deutscher Wetterdienst:
National Meteorological Service of Germany. https:
//www.dwd.de. Accessed: 2024-10-08.
Drouin, M. and Abbasi, I. (2019). Neuroticism and face-
book addiction: How social media can affect mood?
The American Journal of Family Therapy, 47:1–17.
Fardouly, J., Diedrichs, P. C., Vartanian, L. R., and Halli-
well, E. (2015). Social comparisons on social media:
The impact of facebook on young women’s body im-
age concerns and mood. Body Image, 13:38–45.
Fitzpatrick, K. K., Darcy, A., and Vierhile, M. (2017). De-
livering cognitive behavior therapy to young adults
with symptoms of depression and anxiety using a fully
automated conversational agent (woebot): A random-
ized controlled trial. JMIR Mental Health, 4:e19.
Ghosh, S., Sahu, S., Ganguly, N., Mitra, B., and De, P.
(2019). Emokey: An emotion-aware smartphone key-
board for mental health monitoring. In 2019 Inter-
national Conference on COMmunication Systems &
NETworkS (COMSNETS), pages 496–499.
Mobile Data Collection for Depression Analysis: An App Framework for Monitoring Mood and Depression Using Smartphone and
Wearable Data
787

Grundstr
¨
om, J., Konttinen, H., Berg, N., and Kiviruusu, O.
(2021). Associations between relationship status and
mental well-being in different life phases from young
to middle adulthood. SSM - Population Health, 14.
Hong, J., Kim, J., Kim, S., Oh, J., Lee, D., Lee, S., Uh,
J., Yoon, J., and Choi, Y. (2022). Depressive symp-
toms feature-based machine learning approach to pre-
dicting depression using smartphone. Healthcare,
10(7):1189.
Irwin, M. R. (2015). Why sleep is important for health: A
psychoneuroimmunology perspective. Annual Review
of Psychology, 66(1):143–172.
Javaid, S., Khan, M., and Daniyal, M. (2022). The re-
lationship between cellphone usage on the physical
and mental wellbeing of university students: A cross-
sectional study. International Journal of Environmen-
tal Research and Public Health, 19.
Kazantzis, N., Luong, H., Usatoff, A., Impala, T., Yew, R.,
and Hofmann, S. (2018). The processes of cognitive
behavioral therapy: A review of meta-analyses. Cog-
nitive Therapy and Research, 42.
Kessler, R., Berglund, P., Bruce, M., Koch, J., Laska, E.,
Leaf, P., Manderscheid, R., Rosenheck, R., Walters,
E., and Wang, P. (2002). The prevalence and correlates
of untreated serious mental illness. Health services
research, 36:987–1007.
Klein, F., Aschwege, F. M.-V., Elfert, P., R
¨
aker, J.,
Philipsen, A., Braun, N., Selaskowski, B., Wiebe, A.,
Guth, M., Spallek, J., Seuss, S., Storey, B., Geppert,
L. N., L
¨
uck, I., and Hein, A. (2023). Developing ad-
vanced ai ecosystems to enhance diagnosis and care
for patients with depression. Studies in Health Tech-
nology and Informatics, 309:18–22.
Klimstra, T. A., Frijns, T., Keijsers, L., Denissen, J. J. A.,
Raaijmakers, Q. A. W., van Aken, M. A. G., Koot,
H. M., van Lier, P. A. C., and Meeus, W. H. J. (2011).
Come rain or come shine: individual differences in
how weather affects mood. Emotion, 11(6):1495–
1499.
Kroenke, K., Spitzer, R. L., and Williams, J. B. (2001). The
phq-9. Journal of General Internal Medicine, 16:606–
613.
Kvam, S., Kleppe, C. L., Nordhus, I. H., and Hovland,
A. (2016). Exercise as a treatment for depression:
A meta-analysis. Journal of Affective Disorders,
202:67–86.
Masud, M., Mamun, M., Thappa, K., Lee, D., Griffiths,
M., and Yang, S.-H. (2020). Unobtrusive monitoring
of behavior and movement patterns to detect clinical
depression severity level via smartphone. Journal of
Biomedical Informatics, 103:103371.
MindDoc (2023). Mental health support and therapy online.
https://minddoc.com/de/de/. Accessed: 2024-10-08.
Mohr, D., Zhang, M., and Schueller, S. (2017). Personal
sensing: Understanding mental health using ubiqui-
tous sensors and machine learning. Annual review of
clinical psychology, 13.
Nahum-Shani, I., Smith, S., Spring, B., Collins, L.,
Witkiewitz, K., Tewari, A., and Murphy, S. (2016).
Just-in-time adaptive interventions (jitais) in mobile
health: Key components and design principles for on-
going health behavior support. Annals of Behavioral
Medicine, 52.
Nationale Versorgungsleitlinien (2024). Nationale ver-
sorgungsleitlinie unipolare depression - langfas-
sung. https://www.leitlinien.de/themen/depression/
version-3. Accessed: 2024-03-05.
Neyer, F. J., Felber, J., and Gebhardt, C. (2016). Kurzskala
technikbereitschaft (tb, technology commitment).
Zusammenstellung sozialwissenschaftlicher Items
und Skalen (ZIS). DOI: 10.6102/zis244.
Posner, J., Russell, J., and Peterson, B. (2005). The circum-
plex model of affect: An integrative approach to af-
fective neuroscience, cognitive development, and psy-
chopathology. Development and Psychopathology,
17:715–734.
Razavi, R., Gharipour, A., and Gharipour, M. (2020). De-
pression screening using mobile phone usage meta-
data: a machine learning approach. Journal of the
American Medical Informatics Association: JAMIA,
27.
Rykov, Y., Thach, T.-Q., Bojic, I., Christopoulos, G.,
and Car, J. (2021). Digital biomarkers for depres-
sion screening with wearable devices: Cross-sectional
study with machine learning modeling. JMIR mHealth
and uHealth, 9.
Schuller, B. (2018). Speech emotion recognition: Two
decades in a nutshell, benchmarks, and ongoing
trends. Communications of the ACM, 61(5):90–99.
Short, M. and Louca, M. (2015). Sleep deprivation leads to
mood deficits in healthy adolescents. Sleep Medicine,
16.
Stanton, R. and Reaburn, P. (2014). Exercise and the treat-
ment of depression: A review of the exercise program
variables. Journal of Science and Medicine in Sport,
17(2):177–182.
Taniguchi, K., Takano, M., Tobari, Y., Hayano, M., Naka-
jima, S., Mimura, M., Tsubota, K., and Noda, Y.
(2022). Influence of external natural environment in-
cluding sunshine exposure on public mental health: A
systematic review. Psychiatry International.
Taylor, S., Ferguson, C., Peng, F., Schoeneich, M., and
Picard, R. (2018). Use of in-game rewards to moti-
vate daily self-report compliance (preprint). Journal
of Medical Internet Research, 21.
Thorisdottir, I. E., Sigurvinsdottir, R., Asgeirsdottir, B. B.,
Allegrante, J. P., and Sigfusdottir, I. D. (2019). Active
and passive social media use and symptoms of anxi-
ety and depressed mood among icelandic adolescents.
Cyberpsychology, behavior and social networking.
Torous, J., Larsen, M., Depp, C., Cosco, T., Barnett, I.,
Nock, M., and Firth, J. (2018). Smartphones, sensors,
and machine learning to advance real-time prediction
and interventions for suicide prevention: a review of
current progress and next steps. Current Psychiatry
Reports, 20:51.
Umberson, D. and Montez, J. (2010). Social relationships
and health a flashpoint for health policy. Journal of
health and social behavior, 51 Suppl:S54–66.
WHO (2023). World health organization - depres-
sion. https://www.who.int/news-room/fact-sheets/
detail/depression. Accessed: 2024-09-16.
HEALTHINF 2025 - 18th International Conference on Health Informatics
788
