
Posterizing Diagrams with Top-Down Layout
Maximilian Kasperowski
a
and Reinhard von Hanxleden
b
Department of Computer Science, Kiel University, Kiel, Germany
{mka, rvh}@informatik.uni-kiel.de
Keywords:
Automatic Layout, Layered Graph Drawing, Nested Graph Drawing.
Abstract:
Diagrams serve as a communication tool and automatic graph drawing enables the creation of diagramming
tools that allow seamless graph modeling and visualization. These tools typically have the goal of optimiz-
ing the produced diagrams for computer screens, which support zooming in and out of diagrams and further
interaction techniques. In this paper, we consider what automatic graph drawing needs to provide to produce
diagrams suitable for printing instead, where we can no longer zoom and are restricted to a fixed area. We iden-
tify key differences in the requirements between printed static diagrams and interactive on-screen diagrams,
including layout speed and layout area. Our goal is to automatically draw a complex diagram to be printed
on a large poster, with maximal readability. We propose a collection of refinements to the well-established
Sugiyama algorithm and illustrate our approach with a large SCChart that implements a railway controller.
1 INTRODUCTION
Automatic graph drawing describes the automatic
creation of node-link diagrams from a graph. In prac-
tice this graph has typically been extracted from some
kind of model. Modeling tools frequently use visu-
alizations of models, and automatic graph drawing
technology allows the creation of these visualizations
on-the-fly during the modeling process (Lohstroh
et al., 2021; Glaser and Bork, 2021; Kasperowski
et al., 2024). While such tooling typically focuses
on creating diagrams that work well on a zoomable
computer screen, another use case are static diagrams.
In industry, it is not uncommon to create “diagram
walls” that spread out over multiple square meters.
These walls typically consist of numerous printouts
of system components represented by large nested
graphs. For example, calibration engineers use such
diagram walls to explore complex engine control soft-
ware. Creating such diagram walls manually is a
rather time-consuming process, which motivates the
work presented here.
We investigate the requirements printed diagrams
have of automatic graph drawing techniques and how
they differ from diagrams primarily displayed on
computer screens. We perform this analysis by exem-
plarily creating a large printable diagram using auto-
matic graph drawing techniques. We utilize existing
a
https://orcid.org/0000-0002-7509-1678
b
https://orcid.org/0000-0001-5691-1215
techniques to optimize space usage as well as apply
new techniques that are not as important or applicable
for computer screens.
The diagrams included in this paper were pro-
duced using the KIELER tooling (Kasperowski et al.,
2024), which uses the Eclipse Layout Kernel (Domr
¨
os
et al., 2023b) to perform automatic layout. The ex-
ample used throughout this paper is an excerpt of a
larger poster
1
created to demonstrate the techniques
discussed in this paper.
A common method to draw large nested graphs
is to use a divide-and-conquer approach and work
bottom-up, i. e., one first creates layouts for the
bottom-most elements of the graph hierarchy and then
combines those to determine size requirements of the
parents, which are then laid out in turn. E. g., in
Fig. 1a the layout of the subgraph in Giraffe deter-
mines the final size of the node. This is a recursive
procedure terminating at the graph root.
Such bottom-up layouts produce drawings where
low-level elements and labels are drawn at a uniform
scale, however, for large graphs this method leads to
large and hard-to-read graphs with no good overview
over any given hierarchy level. This is why we in-
stead propose to use a top-down procedure where
node sizes are restricted and fixed by higher-level
nodes (Kasperowski and von Hanxleden, 2023). Sub-
layouts are scaled down to fit within their parents. A
1
https://rtsys.informatik.uni-kiel.de/
∼
biblio/
downloads/papers/ivapp25-showpiece.pdf
930
Kasperowski, M. and von Hanxleden, R.
Posterizing Diagrams with Top-Down Layout.
DOI: 10.5220/0013299200003912
Paper published under CC license (CC BY-NC-ND 4.0)
In Proceedings of the 20th International Joint Conference on Computer Vision, Imaging and Computer Graphics Theory and Applications (VISIGRAPP 2025) - Volume 1: GRAPP, HUCAPP
and IVAPP, pages 930-937
ISBN: 978-989-758-728-3; ISSN: 2184-4321
Proceedings Copyright © 2025 by SCITEPRESS – Science and Technology Publications, Lda.

Cat
A
B
C
D
E
F
G
H
I
Elephant
A
B
C
D
E
F
G
H
Chameleon
A
B
C
D
E
F
Giraffe
Dog
(a) Bottom-up layout.
Cat
A
B
C
D
E
F
G
H
I
Elephant
A
B
C
D
E
F
G
H
Chameleon
A
B
C
D
E
F
Giraffe
Dog
(b) Top-down layout.
Figure 1: This simple example highlights the difference between bottom-up and top-down layout. In the bottom-up case, the
children define the sizes of the parents, while in the top-down case the parents restrict the space available to their children.
comparison of the bottom-up and top-down procedure
is shown in Fig. 1.
Top-down layout itself, while creating helpful
overviews and structure in the drawings, also adds
whitespace through its scaling. This can be seen in
the nodes in Fig. 1b. This additional whitespace must
be kept to a minimum for top-down layout to produce
useful results. Essentially this translates to the re-
quirement that layouts must use their provided space
effectively.
This can be rephrased as stating that we want to
create a good layout for a prescribed drawing area,
which is itself a topic that has previously been studied
extensively (R
¨
uegg, 2018). We compare the require-
ments of printed diagrams with those of diagrams
used on computer screens with respect to layout speed
and layout area. The general layout techniques we
cover in this paper are graph wrapping, layer split-
ting, and label management.
1.1 Contributions and Outline
Sec. 2 presents related work. In Sec. 3 we discuss how
we apply graph drawing techniques to the problem of
producing printable diagrams using existing methods
as well as the following new approaches:
• We introduce the concept of layer splitting as a
pendant to graph wrapping for producing layouts
closer to a desired aspect ratio.
• We extend semantic soft wrapping with fuzzi-
ness to produce aesthetically pleasing and space-
efficient labels.
• We propose adaptive font sizes to improve read-
ability in large drawings containing many small
elements.
We discuss our results and how the techniques cov-
ered in this paper help to produce a readable diagram
in Sec. 4. Finally, Sec. 5 concludes this paper.
2 RELATED WORK
At first glance the task of creating a single diagram
for a poster poses the question: Do we need automatic
graph drawing or is a manual layout potentially bet-
ter? We argue that the main advantage of a manual
layout, control, is greatly outweighed by the many ad-
vantages of automatic layout. While users often have
a very strong desire for control, manually positioning
and repositioning many graph elements becomes very
tedious (Petre, 1995). Automatic layout on the other
provides us with consistency, we can easily adjust pa-
rameters that affect the entire diagram, and rapid pro-
totyping is possible. Furthermore, using model order
to control the automatic layout actually provides us
with a large degree of control over the positioning of
elements in the diagram (Domr
¨
os et al., 2023a).
To achieve minimize whitespace we apply the
concept of prescribed drawing areas or area-adaptive
graph drawings. In our case we are interested in tech-
niques for layered graph drawings (R
¨
uegg, 2018), but
the problem has also been studied for other types of
graph drawings such as tree drawings (Misue, 2024).
When creating large diagrams that are viewed on
computer screens there are dynamic focus and context
visualization techniques that can be used to aid with
viewing large diagrams. Fisheye techniques encom-
pass methods of distorting the view or the graph to
highlight certain portions of the diagram (Sarkar and
Brown, 1992; Formella and Keller, 1996; Tominski
et al., 2006). This effect is restricted to one area of
interest that is brought into focus. We could apply
such an effect selectively to portions of our diagram
poster, but we want to create a static view of the entire
diagram to let observers explore it.
Another technique commonly used to make large
diagrams readable when zoomed out is semantic
zooming, which replaces details of the diagram with
readable abstract views (Frisch et al., 2008; De Carlo
et al., 2022). The detailed views are shown as the
Posterizing Diagrams with Top-Down Layout
931

view is zoomed in. We cannot dynamically switch
elements of a printed diagram, but we do want to en-
able observers to zoom in by standing closer to the
poster. Therefore, we also need graphic elements that
are readable from a distance and detailed elements
that only become readable upon stepping closer.
3 POSTERIZING DIAGRAMS
Diagrams as a communication medium are often
found printed on posters of varying sizes. For this pa-
per we considered the challenges of automatic graph
drawing specifically for the use case of producing an
aesthetic and readable diagram for print. For this
application we used SCCharts (von Hanxleden et al.,
2014), which is a statechart (Harel, 1987) dialect
and have an automatic visualization provided by the
KIELER tool. Because SCCharts can be hierarchical,
we can utilize top-down layout (Kasperowski and von
Hanxleden, 2023) to produce drawings that provide
good overviews, i. e., views of the diagram where
graph elements that have relations to one another are
readable and their relationships clear.
As an example for this problem we looked at a
part of a model railway controller created as a student
project. We chose to use only an excerpt of this rather
large controller to create something that is interesting
and can still be reasonably printed within a paper. The
result can be seen in Fig. 2. Fig. 3 shows the same
SCChart but laid out using a bottom-up procedure.
3.1 Requirements of Printed Diagrams
In this paper we are concerned with the problem of
creating a diagram suitable for printing on a large
poster. This use case differs from the viewing of di-
agrams on computer screens, and we therefore need
to consider what the requirements are. The following
are the core goals of large printed diagrams.
The most important elements must be clearly visi-
ble and recognizable by an observer standing in front
of the poster. Further details may be smaller such that
they can be read by stepping closer to the poster. Any-
thing smaller than that can no longer be read.
A poster provides us with a larger base area than
a computer screen. This means we can draw larger
boxes with relatively smaller labels and still have
them readable. We cannot, however, zoom in as we
could on a computer. Therefore, it is important that
we fill the space that we have available effectively and
try to reduce the amount of elements and labels that
are printed so small that they can no longer be dis-
cerned easily. With a poster we have a bit of leeway
since we can move away from the poster and move
closer to it to examine details, but the overall range of
viable scale levels is limited.
A poster is also a communication medium. The
diagram that we draw on it should be helpful and un-
derstandable. We want to clearly show “interesting”
elements and relations and filter out or reduce un-
wanted clutter or redundant information. This will
further help us in highlighting interesting features.
Note that these interesting elements are domain-
dependent and therefore vary between modeling lan-
guages and models.
3.2 Top-Down Layout Configuration
Using top-down layout requires setting a desired dia-
gram size as a constraint. In our scenario these con-
straints are provided by the poster size.
The constraint we provide for a layout of a node is
the fixed size of the node. This precisely defines how
much space is available to the children of the node,
i. e., the to-be-drawn graph, e. g., the size available
to the subgraph in the Giraffe node in Fig. 1b. If the
provided space is exceeded by the graph drawing pro-
cedure, a scaling is applied to fit the drawing into the
prescribed area. This way top-down layout provides
us with a simple mechanism to control the size ele-
ments should be drawn at.
Dynamically estimating suitable sizes is in itself
a challenging problem and remains a topic for future
work, however, we can manually adjust the size con-
trol to achieve an aesthetic result. For the example
in Fig. 2 we set the size of the main state to roughly
match the page dimensions and all other nodes were
set to a size of approximately 650 px by 400 px.
There are many ways to configure layout options
that affect the resulting aspect ratio of the drawing in
hard-to-predict ways. A key importance in using au-
tomatic graph drawing for generating interactive di-
agrams is that the algorithms must be fast. In the
printed case the speed of the layout computation is
of secondary importance. For a given diagram to be
printed it can be worthwhile to explore different lay-
out options to determine the optimal set of layout op-
tions for a given input graph. For this we determined
a small set of layout options that would have a strong
effect on the area of the drawing and generated draw-
ings for all permutations of these options.
The layout options we searched optimal settings
for were the layout direction (down or right) and the
layer splitting3 (see Sec. 3.3) strategy (no split or 2-
layer-split). These two options have a large impact
on the resulting aspect ratio of a drawing, but their
effect is difficult to predict. Finally, we use the op-
IVAPP 2025 - 16th International Conference on Information Visualization Theory and Applications
932
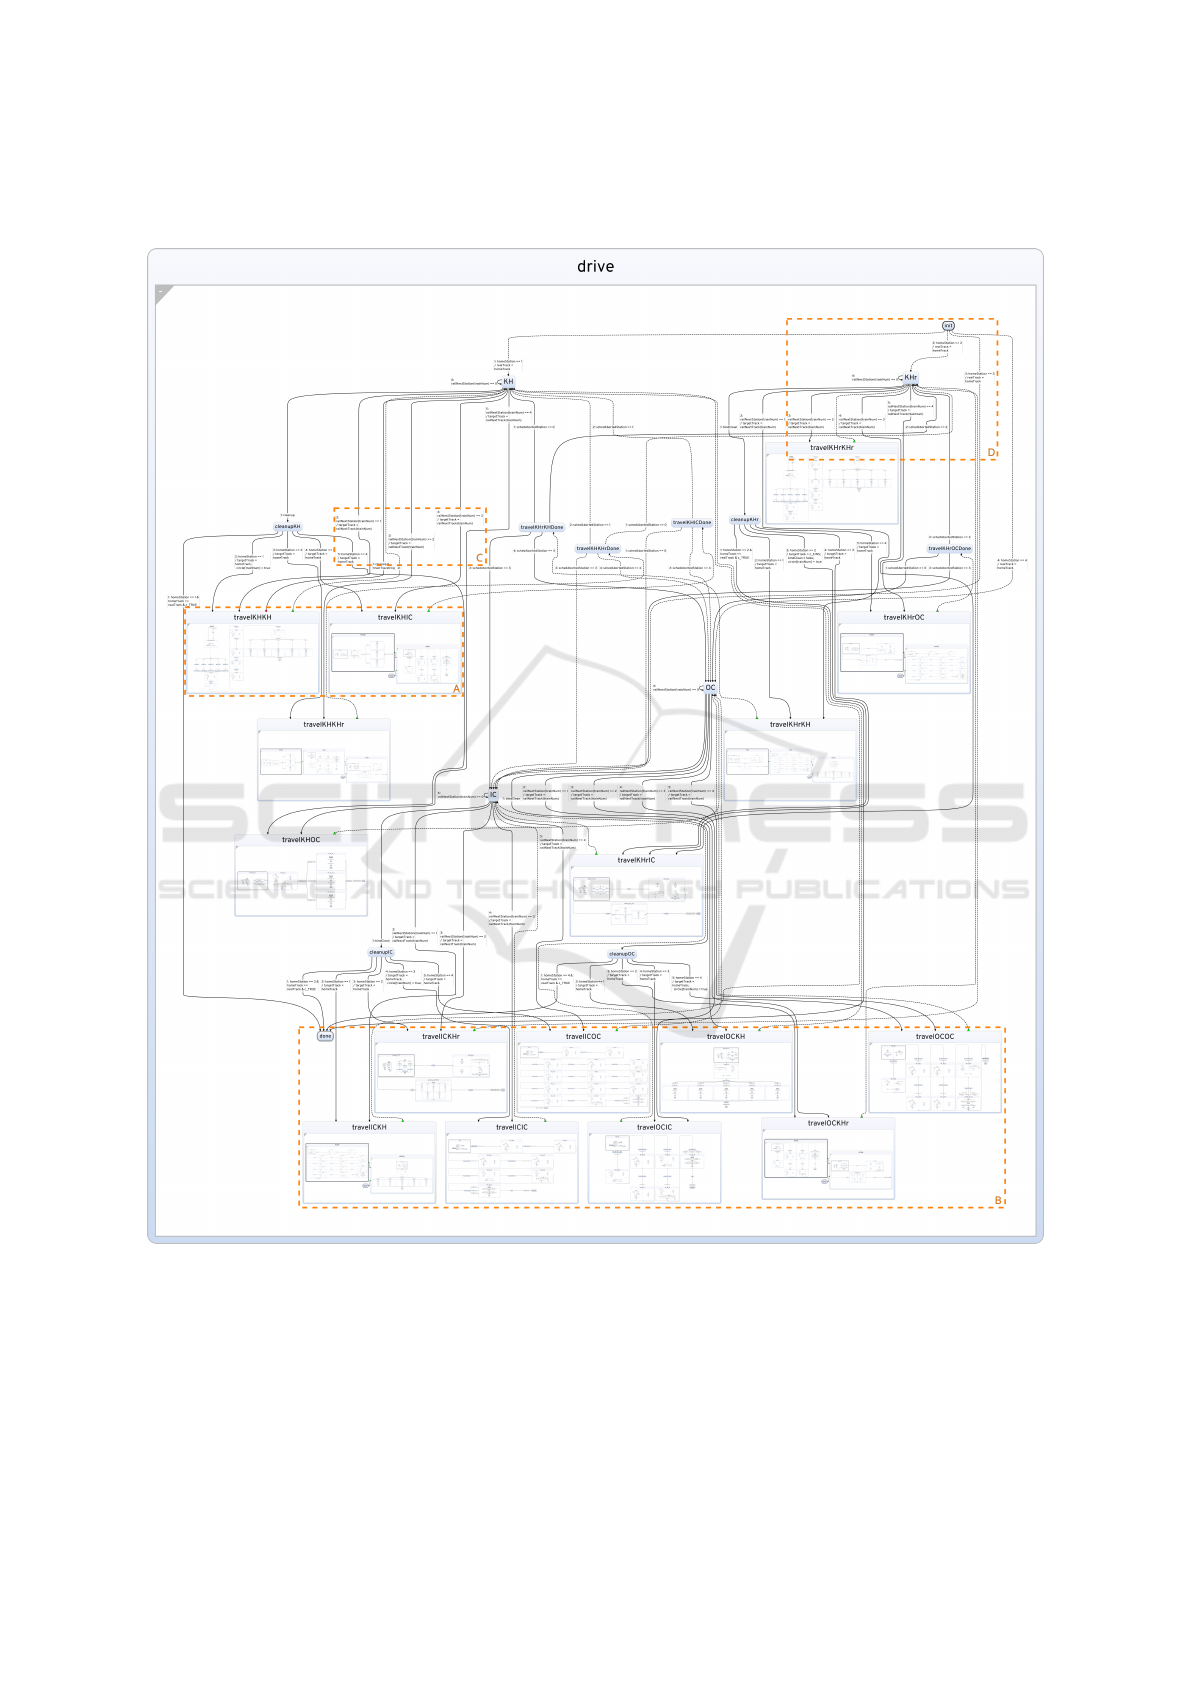
Figure 2: The drive SCChart laid out using top-down layout to neatly fit on a page or more suitably on a poster. This example
demonstrates all the layout tools that are explained in the following sections. The model itself stems from a student project and
is an excerpt from a larger model that controls a model railway. This drive state controls the behaviour of an individual train.
There are several highlighted excerpts that are shown and discussed in later sections. Excerpt A highlights graph wrapping
and is shown in Fig. 4. Excerpt B highlights layer splitting and is shown in Fig. 5. Excerpt C highlights fuzzy soft wrapping
and is shown in Fig. 6. Excerpt D highlights adaptive fonts and is shown in Fig. 7.
Posterizing Diagrams with Top-Down Layout
933
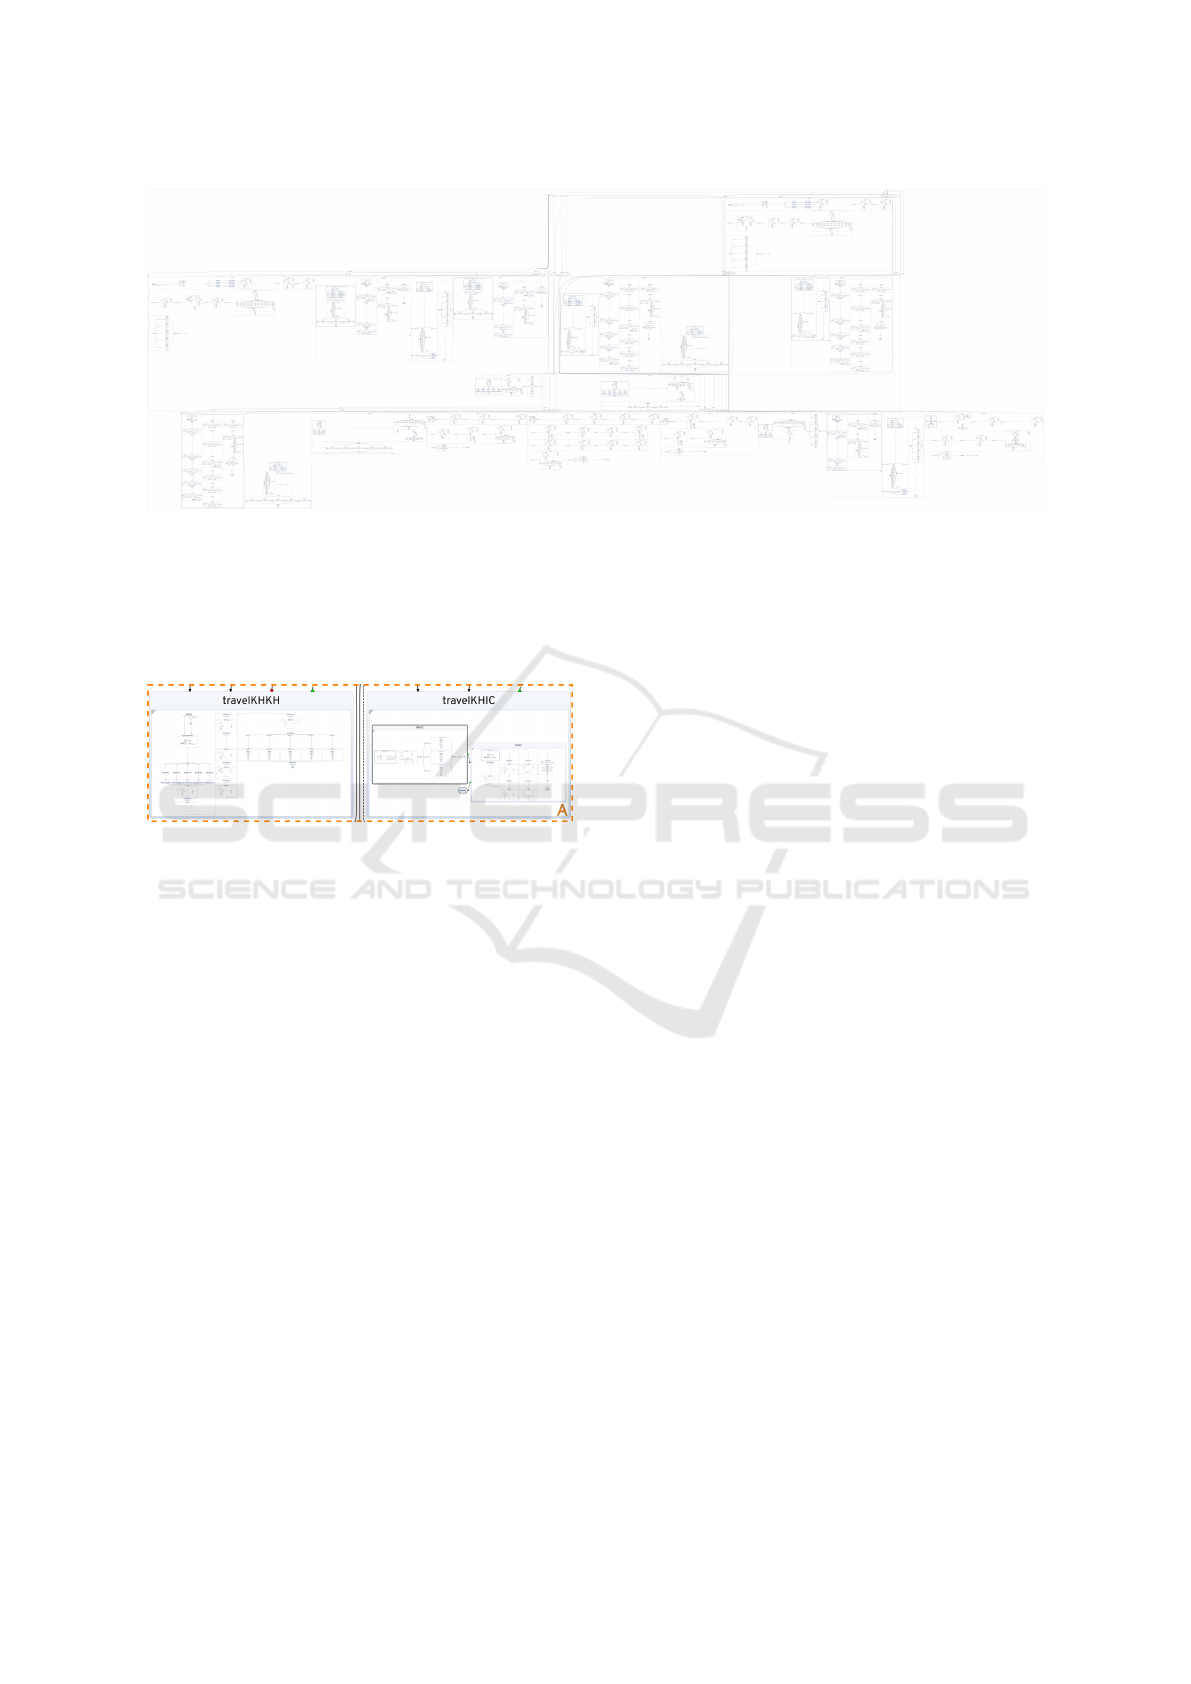
Figure 3: The drive SCChart laid out using bottom-up layout. The adaptive fonts feature is also enabled in this version. Despite
this the diagram remains wholly unreadable as it would require a space of nearly fourteen meters by five meters to print fonts
at their default size of 11 pt. At the current scale none of the labels are readable. Some used tools such as graph wrapping and
adaptive fonts do technically help a bit, but it should be clear that this is a diagram that is too large to draw in the bottom-up
manner and still produce good results. We also lose the ability to exercise direct control over the size of the root node, which
in this case leads to a wide diagram that cannot effectively use the available page area.
Figure 4: This state is an excerpt of Fig. 2 showing how
wrapping fits long graphs into restricted spaces.
tion settings that result in an aspect ratio closest to
the prescribed area’s aspect ratio as it leads to mini-
mal scaling in top-down layout. The scale measure
introduced by R
¨
uegg expresses this property (R
¨
uegg,
2018).
3.3 Whitespace Management
In this section we discuss techniques to reduce the
whitespace in a layered graph drawing. The topic of
prescribed drawing areas for layered graph drawings
has previously been studied by R
¨
uegg and in partic-
ular the concept of graph wrapping is a helpful ap-
proach to control and restrict the aspect ratio required
by graphs with many layers (R
¨
uegg and von Hanxle-
den, 2018; R
¨
uegg, 2018).
We utilize graph wrapping to effectively fill the
space provided by our fixed sizes in situations where
the drawing would normally become very long and
thin. Fig. 4 demonstrates how wrapping was used for
our example. One wrapped graph is contained in the
travelKHKH state, and one wrapped graph is contained
in the right child state of the travelKHIC state.
We propose layer splitting as a post-processor af-
ter the layer assignment step of the Sugiyama Algo-
rithm (Sugiyama et al., 1981). Layer splitting ad-
dresses a problem that is orthogonal to the graph
wrapping approach. While graph wrapping helps to
reduce the effect of long layouts, layer splitting im-
proves bad aspect ratios of high (in a left-to-right
layout direction) layouts. The rotated case (top-to-
bottom layout direction) is demonstrated in Fig. 5.
Here, the travel. . . states are partitioned into rows.
Instead of having many thin layers as in graph
wrapping, we have few layers that are very fat, i. e.,
they have many nodes next to each other. To decrease
the width of the layer we can split up the nodes of a
layer into two or more layers. In our situation with
top-down layout the nodes are all of similar sizes and
therefore simply staggering the nodes in a brick-like
layout is sufficient to achieve a compact result.
3.4 Control and Model Order
Our use case of creating a large printed poster of a
specific diagram means that we want to be able to ex-
ercise fine control over the layout of certain portions
of the diagram. The diagram is merely a visualization
of an underlying textual model (Kasperowski et al.,
2024). The textual order in this model, i. e., the order
the states are defined in, is used to infer the model or-
der and to guide decisions during the automatic layout
of the graph (Domr
¨
os et al., 2023a).
This allows us to easily adjust and control what
the diagram looks like by modifying the textual model
rather than being forced to fiddle with the layout al-
IVAPP 2025 - 16th International Conference on Information Visualization Theory and Applications
934
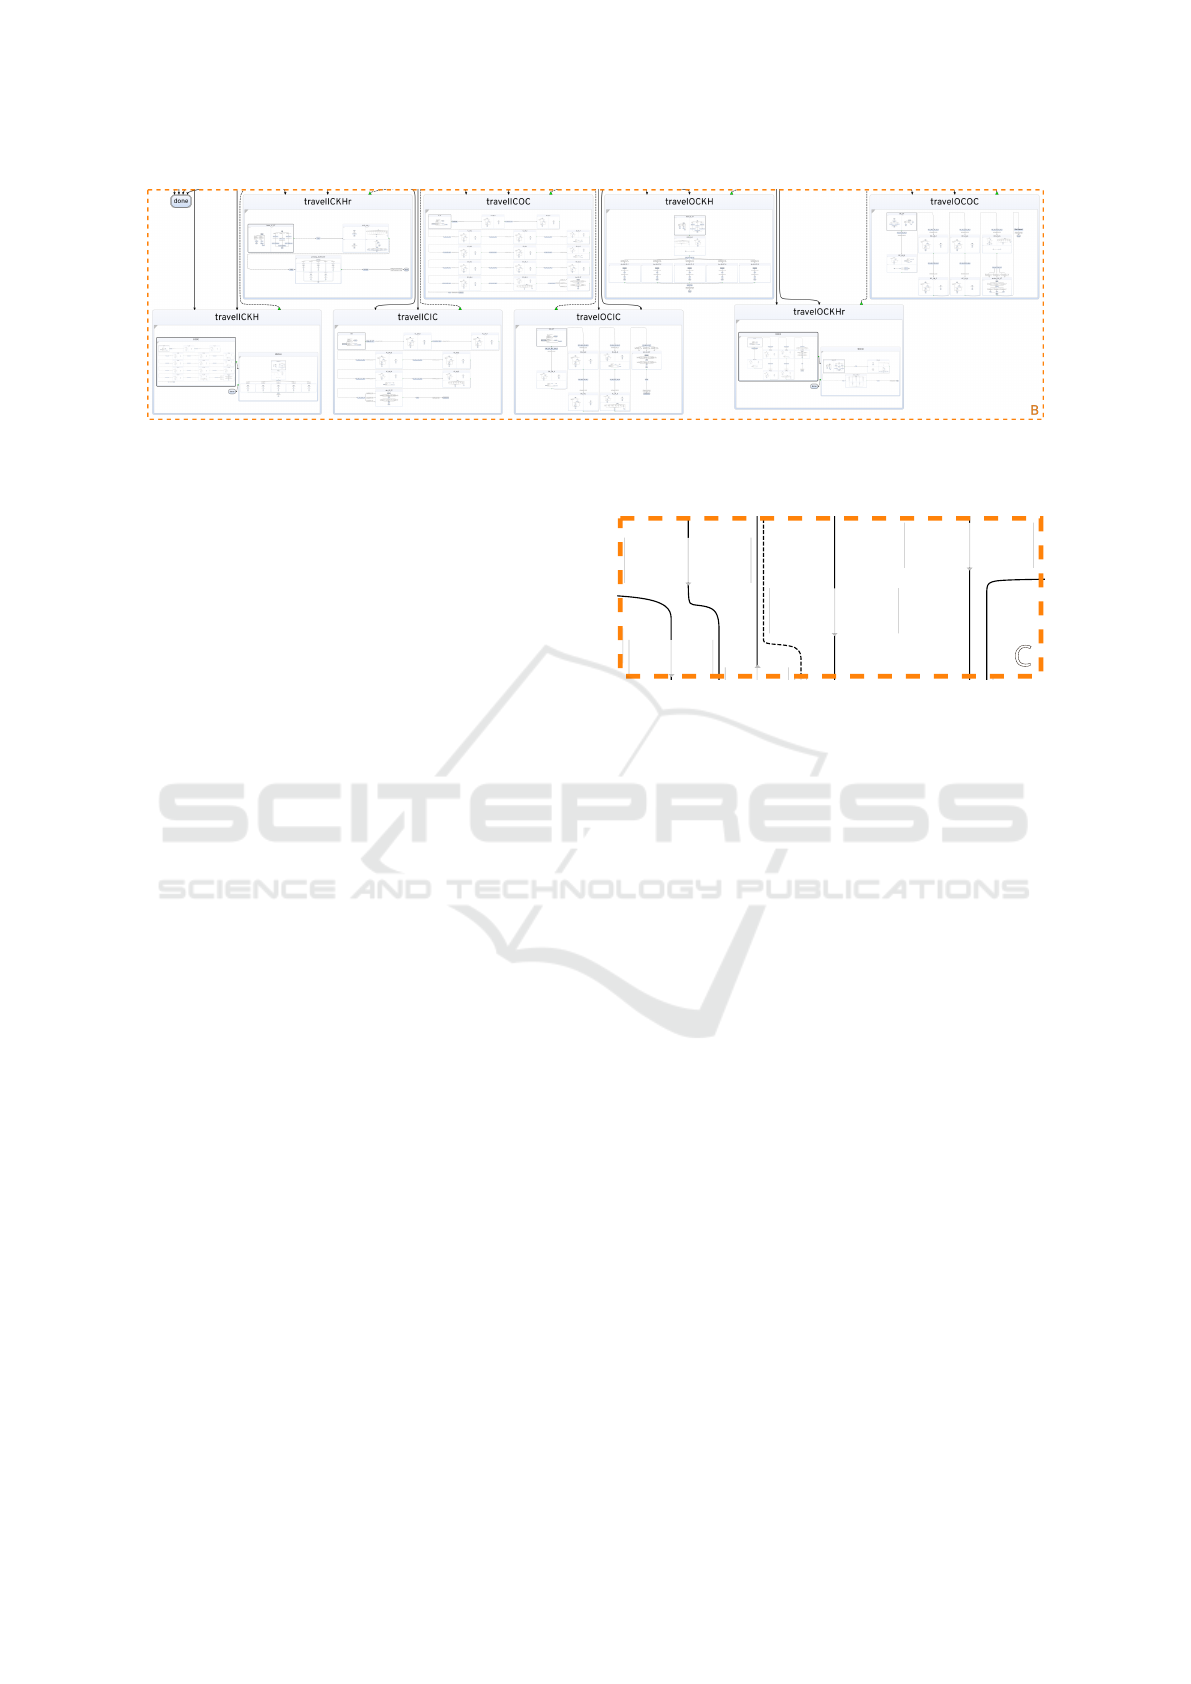
Figure 5: This state is an excerpt of Fig. 2 where layer splitting was used to decrease the width of the final layer in the main
layout. This ensures that the diagram does not become too wide for the restricted page space.
gorithms themselves. This fine-granular control over
the layout is invaluable when tweaking a diagram to
achieve the desired appearance. Moreover, model or-
der shows the underlying structure of a textual model
even though the diagram may be cluttered. It also
helps us retain stability, i. e., the general structure of
diagram does not change between versions.
3.5 Label Management
In this section we discuss label management tech-
niques that create aesthetic and space-efficient labels.
Fuzzy Label Wrapping. In realistic models there
are typically many labels that also tend to be long. La-
bels in general and edge labels in particular can have a
large effect on the overall size requirements of a graph
drawing. This effect compounds in diagrams of large
models and good label management is required to re-
duce the amount of whitespace that is introduced.
Schulze has previously studied how to perform la-
bel management for layered graph drawings (Schulze,
2019). In particular the method of semantic soft wrap-
ping is of interest to us because it allows us to re-
duce the width and use the available vertical space.
In soft wrapping long labels are split into multiple
lines based on a maximum line length. The line break
is performed on space between words if the cutoff
length has been reached. Semantic soft wrapping ex-
tends this by adding additional linebreaks at semanti-
cally suitable positions. For SCCharts these are for ex-
ample the slashes in the transition labels as they serve
as visual separator between the trigger and action of
the transition.
There are situations in which the hard linewrap
cutoff creates awkward empty spaces in parts of the
wrapped label. We improve the label wrapping by
adding a fuzzy cutoff that permits a line to exceed its
line length limit if the next line would be underfilled.
A line is underfilled if it only covers a defined percent-
2:
railNextStation(trainNum) == 1
/ targetTrack =
railNextTrack(trainNum)
3:
railNextStation(trainNum) == 2
/ targetTrack =
railNextTrack(trainNum)
4:
railNextStation(trainNum) == 3
/ targetTrack =
railNextTrack(trainNum)
3 h dAb
3
5: homeStation == 4
/ targetTrack =
homeTrack
1: cleanup &
!t i T lli
2
C
Figure 6: The edge labels in this excerpt of Fig. 2 demon-
strate the result of semantic fuzzy soft wrapping.
age of the available line space. This enhancement fur-
ther compacts labels and also produces more aesthetic
results. Long and mostly empty lines are greatly re-
duced when adding a fuzzy cutoff. In Fig. 2 a fuzzy
cutoff of 30 percent is used.
Fig. 6 shows this in action. Soft wrapping would
usually result in the segments of the form: == x, where
x is some short string or number, to be placed in a
new line. We instead keep these short label fragments
on the previous line, which reduces the overall area
occupied by the label.
Adaptive Font Sizes. When using top-down lay-
out there can be significant scale differences between
neighbouring nodes due to the contained subgraphs
differing strongly in their complexity, as shown in
Fig. 2. This makes larger layouts with more nodes and
therefore stronger downscaling harder to read. Top-
down layout is intended to maintain the overview. Sit-
uations such as this undermine the efficacy at provid-
ing readable overviews. To alleviate this problem, we
introduce adaptive font sizes for labels, as shown in
Fig. 7. The font sizes of the state labels have been in-
creased to make them more readable, while the edge
labels remain unchanged. This is a decision based on
the notion that the states themselves act as landmarks
and are important to obtain an overview, whereas the
edge labels are details that are more relevant upon
closer inspection. It is therefore a decision based on
Posterizing Diagrams with Top-Down Layout
935

init
KHr
travelKHrKHr
req_KH_in
KH_LN_7_KH_LN_5
KH_LN_5
-
Travel
-
Cleanup
KH_LN_1_KH_LN_0
KH_LN_0
Entry
-
Travel
-
Permissions
1: perm_in_L
2:
/
KH_ST_0_req[trainNum] = false;
KH_LN_8_req[trainNum] = false
railContact(KH_LN_5,1)
railContact(KH_LN_0,1)
2: homeStation == 2
/ realTrack =
homeTrack
3: homeStation == 3
/ realTrack =
homeTrack
3:
railNextStation(trainNum) == 2
/ targetTrack =
railNextTrack(trainNum)
4:
railNextStation(trainNum) == 3
/ targetTrack =
railNextTrack(trainNum)
5:
railNextStation(trainNum) == 4
/ targetTrack =
railNextTrack(trainNum)
6:
railNextStation(trainNum) == 0
2: schedAbortedStation == 2
D
Figure 7: This excerpt of Fig. 2 demonstrates adaptive fonts.
domain knowledge for SCCharts models.
Adaptive font sizes are set automatically depend-
ing on the number of nodes in a layout. The most
important elements to retain an overview over a local
subdiagram are the labels of the elements. In large
layouts (due to many nodes being present) the labels
become small and more difficult to read. We increase
the font sizes of these labels by a factor that scales
linearly in the number of nodes of the layout.
In SCCharts we differentiate between simple states
and macro states. Macro states contain inner be-
haviour and therefore these nodes often have children.
Because these nodes are larger and more important,
we scale their fonts up at twice the rate compared to
the simple states. In Fig. 7 the init state is a simple
state and its font is slightly smaller than the fonts of
the two macro states in the image.
4 DISCUSSION
We have highlighted the key goal of readability and
in summary our tools achieve this using two things.
Firstly, we purposefully use size and scale to make
graph elements more visible if they are important.
Secondly, we exercise control over the layout to min-
imize whitespace. This interacts with the scaling
as additional whitespace in a fixed space decreases
the available space for displaying interesting things.
Whitespace minimization leads to efficient utilization
of the prescribed drawing area, which in turn leads
less downscaling being necessary, and therefore in-
creasing the readability of the diagram.
We identified labels in graphs to be key elements
as they are readable features that provide context and
detailed information about the graph elements they
are attached to. Understanding a labelled graph re-
quires being able to read the labels. Labels also have
a large impact on the layout of a graph. We hence put
a lot of focus on the readability of labels and on the
control and display of labels.
It is evident that drawing large labelled graphs
readably in their entirety is a difficult undertaking.
Performing a bottom-up layout of a large graph, as
seen in Fig. 3, imposes an upper limit on the graph
size after which the diagrams inevitably become un-
readable. Dynamic visualizations and filtering out
portions of the diagrams are always viable techniques,
but they are compromises as they hide or distort in-
formation. Top-down layout on the other hand aims
to show the entire graph structure in a readable form.
Additionally, when viewing a top-down layout on
a computer screen, zooming allows the total explo-
ration of a graph in what we would argue is an eas-
ier manner than panning and zooming in a bottom-up
layout.
So far, we have only looked at node-link diagrams
that are drawn using a layered approach. Some ideas
transfer well to other types of graph drawing prob-
lems or other types of diagrams and others are more
restricted in their general applicability. Layered graph
wrapping and layer splitting are very specific strate-
gies for optimizing the area occupied by layered lay-
outs, but in general they are techniques to fill pre-
scribed areas, which reduces whitespace. Whitespace
minimization is a general goal in many graph drawing
applications. The notion of model order to control the
topology of a diagram is also more broadly applicable
as long as there is an inherent ordering in the underly-
ing model and a graph drawing algorithm that is able
to leverage that ordering. Both fuzzy label wrapping
and adaptive font sizes are label management tools
that can be applied to any type of labelled graph.
We focused on an application where the graph
comes from a model made by a developer, and we had
the goal of producing a diagram that can be printed on
a poster in a readable way. There are of course many
other types of diagrams and graphs from a wide range
of domains. In particular, graphs from the area of data
visualization may come with unique challenges and
requirements that are not captured by our example,
because they are not manually modelled. We think
the ideas presented in this paper are nonetheless help-
ful and can be partially applied to other applications.
5 CONCLUSION AND OUTLOOK
We showed how top-down layout can be used to pro-
duce diagrams of large models that are easier to read
at a high-level than corresponding diagrams drawn
using a bottom-up approach. In particular, bottom-
up layouts do not allow us to easily exercise control
IVAPP 2025 - 16th International Conference on Information Visualization Theory and Applications
936

over the total area required by a layout, and for large
diagrams we obtain large and hard-to-read drawings
where details and high-level elements blend together.
This makes it quite unsuitable for producing large
printable diagrams, whereas top-down layout can pro-
duce promising aesthetic results. We applied layered
graph wrapping and semantic soft wrapping for la-
bels for drawing graphs in prescribed areas. In ad-
dition, we introduced layer splitting, fuzzy soft wrap-
ping, and adaptive font sizes as new techniques to fur-
ther improve the results, and we leveraged the abil-
ity to sacrifice layout speed for better layout results.
Searching for optimal option settings increased our
layout times by a factor of four.
While this work introduces the main concepts of
posterizing diagrams, we plan to evaluate the effect
of the new techniques on the whitespace quantity and
readability of diagrams. We also plan to develop
better techniques for automatically determining good
size constraints to set on nodes for top-down layout
and to evaluate the usability of top-down diagrams.
Especially the question of how humans who work
with diagrams use them and whether top-down lay-
outs benefit their use cases is an open question that
requires further investigation.
REFERENCES
De Carlo, G., Langer, P., and Bork, D. (2022). Advanced vi-
sualization and interaction in GLSP-based web mod-
eling: Realizing semantic zoom and off-screen ele-
ments. In Proceedings of the 25th International Con-
ference on Model Driven Engineering Languages and
Systems, MODELS ’22, pages 221–231, New York,
NY, USA. Association for Computing Machinery.
Domr
¨
os, S., Riepe, M., and von Hanxleden, R. (2023a).
Model order in Sugiyama layouts. In Proceedings of
the 18th International Joint Conference on Computer
Vision, Imaging and Computer Graphics Theory and
Applications (VISIGRAPP 2023) - Volume 3: IVAPP,
pages 77–88. INSTICC, SciTePress.
Domr
¨
os, S., von Hanxleden, R., Sp
¨
onemann, M., R
¨
uegg,
U., and Schulze, C. D. (2023b). The Eclipse Layout
Kernel. https://doi.org/10.48550/arXiv.2311.00533.
Formella, A. and Keller, J. (1996). Generalized fish-
eye views of graphs. In Brandenburg, F. J., editor,
Graph Drawing, pages 242–253, Berlin, Heidelberg.
Springer Berlin Heidelberg.
Frisch, M., Dachselt, R., and Br
¨
uckmann, T. (2008).
Towards seamless semantic zooming techniques for
UML diagrams. In Proceedings of the 4th ACM Sym-
posium on Software Visualization, pages 207–208.
Glaser, P.-L. and Bork, D. (2021). The bigER tool - hy-
brid textual and graphical modeling of entity relation-
ships in VS Code. In 2021 IEEE 25th International
Enterprise Distributed Object Computing Workshop
(EDOCW), pages 337–340. IEEE.
Harel, D. (1987). Statecharts: A visual formalism for com-
plex systems. Science of Computer Programming,
8(3):231–274.
Kasperowski, M., Rentz, N., Domr
¨
os, S., and von Hanxle-
den, R. (2024). KIELER: A text-first framework
for automatic diagramming of complex systems. In
Proceedings of the 14th International Conference on
the Theory and Application of Diagrams, DIAGRAMS
’24, volume 14981 of LNCS, pages 402–418. Springer
Nature Switzerland”.
Kasperowski, M. and von Hanxleden, R. (2023).
Top-down drawings of compound graphs.
https://doi.org/10.48550/arXiv.2312.07319.
Lohstroh, M., Menard, C., Bateni, S., and Lee, E. A. (2021).
Toward a Lingua Franca for deterministic concurrent
systems. ACM Transactions on Embedded Computing
Systems (TECS), 20(4):Article 36.
Misue, K. (2024). Area-adaptive drawing of rooted trees.
In 2024 IEEE 17th Pacific Visualization Conference
(PacificVis), pages 152–161.
Petre, M. (1995). Why looking isn’t always seeing: Read-
ership skills and graphical programming. Communi-
cations of the ACM, 38(6):33–44.
R
¨
uegg, U. (2018). Sugiyama layouts for prescribed draw-
ing areas. Number 2018/1 in Kiel Computer Sci-
ence Series. Department of Computer Science. Disser-
tation, Faculty of Engineering, Christian-Albrechts-
Universit
¨
at zu Kiel.
R
¨
uegg, U. and von Hanxleden, R. (2018). Wrapping layered
graphs. In Proceedings of the 10th International Con-
ference on the Theory and Application of Diagrams
(DIAGRAMS ’18), pages 743–747. Springer.
Sarkar, M. and Brown, M. H. (1992). Graphical fish-
eye views of graphs. In Proceedings of the SIGCHI
Conference on Human Factors in Computing Systems,
pages 83–91. ACM.
Schulze, C. D. (2019). Text in Diagrams: Challenges to and
Opportunities of Automatic Layout. Number 2019/4 in
Kiel Computer Science Series. Department of Com-
puter Science, CAU Kiel. Dissertation, Faculty of En-
gineering, Kiel University.
Sugiyama, K., Tagawa, S., and Toda, M. (1981). Methods
for visual understanding of hierarchical system struc-
tures. IEEE Transactions on Systems, Man and Cy-
bernetics, 11(2):109–125.
Tominski, C., Abello, J., van Ham, F., and Schumann, H.
(2006). Fisheye tree views and lenses for graph visu-
alization. In Tenth International Conference on Infor-
mation Visualisation (IV’06), pages 17–24.
von Hanxleden, R., Duderstadt, B., Motika, C., Smyth, S.,
Mendler, M., Aguado, J., Mercer, S., and O’Brien,
O. (2014). SCCharts: Sequentially Constructive
Statecharts for safety-critical applications. In Proc.
ACM SIGPLAN Conference on Programming Lan-
guage Design and Implementation (PLDI ’14), pages
372–383, Edinburgh, UK. ACM.
Posterizing Diagrams with Top-Down Layout
937
