
Enhancing Usability in Large Map Interactions: A Novel Magnifying
Lenses Technique for Tabletops
Fernando Pedrazzi Pozzer
1 a
, Gustavo Machado de Freitas
1 b
, Gabriel Fronza Schuster
2 c
,
Felipe Marques de Carvalho de Oliveira
3 d
, Cesar Tadeu Pozzer
3 e
and Lisandra Manzoni Fontoura
4 f
1
Curso de Ci
ˆ
encia da Computac¸
˜
ao, Federal University of Santa Maria, Santa Maria, Brazil
2
Curso de Engenharia da Computac¸
˜
ao, Federal University of Santa Maria, Santa Maria, Brazil
3
Departamento de Computac¸
˜
ao Aplicada, Federal University of Santa Maria, Santa Maria, Brazil
4
Programa de P
´
os-Graduac¸
˜
ao em Ci
ˆ
encia da Computac¸
˜
ao, Federal University of Santa Maria, Santa Maria, Brazil
Keywords:
Usability, Tabletops, Focus+Context, Overview+Detail, Large Maps, NASA-TLX.
Abstract:
Tabletops are large interactive displays that enable users to interact for collaborative analysis and planning on
datasets. These devices allow communication using pointing and gestures and interactive zooming, searching,
and modifying data. However, when interacting with large maps, the user must analyze details that can only
be viewed by enlarging the map region. Furthermore, it is interesting to visualize the context (zoom out)
and the details of a specific area (zoom in). Magnifying lenses are often used for this purpose, but these
lenses have the disadvantage of losing context. In this paper, we present a new technique for interaction using
magnifying lenses for tabletops to improve interaction usability in large maps. We analyzed several techniques
discussed in the literature for magnifying lenses. We performed experimental implementations in the context
of the SIS-ASTROS GMF Project. We validated the work through objective and subjective analyses, and the
results demonstrated significant improvements in objective metrics, such as time and accuracy, as well as in
subjective metrics, including frustration, effort, and mental demand. The NASA-TLX Questionnaire was used
to evaluate the subjective metrics.
1 INTRODUCTION
The use of interactive surfaces, such as tabletops,
has been shown to enhance performance across vari-
ous tasks (Fitzmaurice and Buxton, 1997) and to be
a promising tool in collaboration (Mateescu et al.,
2021) and planning scenarios involving large data
sets, especially in contexts that require analysis and
manipulation of large-scale maps (D
¨
oweling et al.,
2016). Interactive tabletops facilitate this collabora-
tion by allowing multiple users to interact simultane-
ously with digital maps, promoting a common under-
a
https://orcid.org/0009-0009-2860-1135
b
https://orcid.org/0009-0001-1326-4238
c
https://orcid.org/0009-0006-9771-4860
d
https://orcid.org/0009-0004-5734-5904
e
https://orcid.org/0000-0002-3321-4828
f
https://orcid.org/0000-0002-4669-1383
standing of the situation and the improvement of im-
plemented measures (Westendorf et al., 2017).
Tabletops have been used in contexts such as
education (Bortolaso et al., 2014), health (Yang
et al., 2014; Madni et al., 2016), crisis management
(D
¨
oweling et al., 2016), traffic simulation (Kubicki
et al., 2013), among others. Their use presents sat-
isfactory results with map-related systems due to the
panoramic view. In health, the number of elements
that can be displayed on the screen allows more de-
tails about the medical image to be seen. It sup-
ports better analysis (Yang et al., 2014; Madni et al.,
2016). D
¨
oweling et al. (2016) described the use of
tabletops in contexts such as crisis management, in
which collaboration between different organizations
is essential for situational analysis and action plan-
ning. Furthermore, these devices offer an intuitive
interface that improves the efficiency and quality of
teamwork, overcoming the limitations of traditional
448
Pozzer, F. P., Machado de Freitas, G., Schuster, G. F., Marques de Oliveira, F. C., Pozzer, C. T. and Fontoura, L. M.
Enhancing Usability in Large Map Interactions: A Novel Magnifying Lenses Technique for Tabletops.
DOI: 10.5220/0013300100003929
In Proceedings of the 27th International Conference on Enterprise Information Systems (ICEIS 2025) - Volume 2, pages 448-459
ISBN: 978-989-758-749-8; ISSN: 2184-4992
Copyright © 2025 by Paper published under CC license (CC BY-NC-ND 4.0)

workstation-based solutions (D
¨
oweling et al., 2016;
Salvador-Herranz et al., 2016).
Despite the advantages, implementing interactive
tabletops presents several challenges. One of the main
ones is the need for visualization techniques that al-
low users to switch between high-level and planned
views of the map without compromising collabora-
tion (Bortolaso et al., 2014; Liu et al., 2023; For-
lines and Shen, 2005). In large datasets, highlight-
ing a part of the information is a widespread oper-
ation. However, contextual data (the area surround-
ing the interest area) is usually lost when this opera-
tion involves zooming. This loss can compromise the
user’s analysis and, according to Forlines and Shen
(2005), making zoom-in and zoom-out operations is
time-consuming. There are a few attempts to solve
this problem using magnification lenses, as seen in
the survey by Tominski et al. (2017).
FingerGlass (K
¨
aser et al., 2011), DTLens (For-
lines and Shen, 2005), and OrMiS (Bortolaso et al.,
2013) are multi-touch interfaces that explore human-
computer interaction, focusing on zooming tech-
niques and visual content manipulation. FingerGlass
(K
¨
aser et al., 2011) offers a virtual lens for magnify-
ing specific regions on smaller screens, DTLens (For-
lines and Shen, 2005) allows multiple users to explore
different parts of a map or diagram simultaneously,
and OrMiS (Bortolaso et al., 2013) uses a virtual lens
to focus on specific objects within a simulation for
detailed exploration. However, no proposed approach
was considered suitable for an environment that con-
sists of analyzing and interacting with large maps with
minimized context loss. Hence, the necessity of cre-
ating a new technique emerges.
The approach proposed in this paper, although ap-
plicable to any application with large-scale maps, is
intended to be used in an integrated simulation envi-
ronment for the Artillery of a national Army. This
environment presents a tactical virtual simulator for
training mid-rank officers in rocket launching activi-
ties using a saturation rocket system. It is necessary
to note that the exercises are intended for one trainee
at a time. This fact impacts the design of the solution,
which, unlike other augmenting lens techniques such
as those presented by Bortolaso et al. (2013) and For-
lines and Shen (2005), does not have the intention to
promote better simultaneous collaboration.
Our approach consists of a magnifying lens di-
vided into two circles. The smaller one called the
indicator is positioned by the user over the area of in-
terest and has a small inner circle that indicates the
amount of zoom applied. The larger circle called
the viewport is adjacent to the indicator - just like
an overview+detail display (K
¨
aser et al., 2011) - and
covers only a small part of the context regardless of
the amount of zoom, taking into account the concept
of focus+context (Bortolaso et al., 2013).
We aim to introduce a magnifying glass that en-
hances the usability of interaction on large maps, par-
ticularly when highlighting and interacting in specific
areas of interest. These features are designed to re-
duce the loss of context and enhance interaction effi-
ciency, ultimately benefiting the user experience.
The remainder of this paper is structured as fol-
lows: Section 2 presents some fundamental con-
cepts regarding magnifying glasses in tabletop envi-
ronments. Section 3 describes related work and some
specifications of the environment in which this tech-
nique must be implemented. Section 4 presents the
method used in this paper as well as the proposed ap-
proach. Section 5 describes the validation methods
used to validate the work. Finally, in Section 6, the
results are presented and discussed. In Section 7, fi-
nal considerations and suggestions for future work are
described.
2 BACKGROUND
Tabletops have been widely adopted in various do-
mains due to their capacity to facilitate collaboration
and improve data analysis through interactive inter-
faces. They have been particularly effective in con-
texts such as education (Bortolaso et al., 2014), where
students engage in collaborative learning activities
and benefit from direct manipulation of educational
content in a shared environment. In the healthcare
sector, tabletops have been utilized to enhance med-
ical diagnostics and treatment planning. The abil-
ity to display large volumes of data and interact with
medical images in real time allows healthcare profes-
sionals to analyze complex datasets more comprehen-
sively. For instance, the large surface area of tabletops
makes it possible to display high-resolution medical
images, which improves the precision of diagnostics
and supports more detailed decision-making (Yang
et al., 2014; Madni et al., 2016).
Additionally, in crisis management, tabletops
have proven invaluable for situational awareness and
decision-making during emergencies. D
¨
oweling et al.
(2016) described their use in collaborative environ-
ments where multiple organizations, such as fire de-
partments, police, and rescue teams, must coordinate
their efforts. The tabletop’s interactive interface al-
lows participants to manipulate maps, annotate essen-
tial areas, and visualize real-time data, fostering an
integrated approach to crisis resolution. This capabil-
ity significantly enhances the ability to share critical
Enhancing Usability in Large Map Interactions: A Novel Magnifying Lenses Technique for Tabletops
449

information, develop action plans, and track resources
in dynamic, high-stress environments.
Moreover, tabletops offer an intuitive and natu-
ral interface that leverages multi-touch capabilities,
allowing multiple users to interact simultaneously.
It fosters greater participation and engagement in
group settings, especially when compared to tradi-
tional workstation-based solutions, which often limit
the number of active participants. The panoramic
view provided by tabletops not only enhances map-
related tasks but also supports the visualization of
large datasets across various domains. In health, for
example, the number of elements that can be dis-
played on the screen allows more details about med-
ical images to be seen, thus supporting better analy-
sis and collaborative interpretation (Yang et al., 2014;
Madni et al., 2016). In addition, as noted by Salvador-
Herranz et al. (2016), tabletops also contribute to im-
proving the efficiency and quality of teamwork, over-
coming limitations related to screen size and interac-
tion constraints found in more traditional computing
setups.
It is essential to clarify some key terms used
throughout this work to ensure a consistent under-
standing of the concepts central to our discussion:
• Interest Area: This refers to the specific area of
the display that is being magnified. In the context
of the proposed technique, the interest area is rep-
resented by the smaller circle within the magnifier
(as illustrated in Figure 6). This area is of particu-
lar importance as it contains the detailed informa-
tion that the user wants to analyze more closely,
and the magnification is applied exclusively to this
portion of the map or dataset.
• Magnified Area: Also known as the ”augmented
area” or ”magnified view,” this term describes the
enlarged version of the interest area. In the pro-
posed model, the magnified area is rendered adja-
cent to, and tangent with, the interest area. This
design ensures that users can easily correlate the
zoomed-in details with the corresponding location
in the broader context without losing sight of the
surrounding elements. By maintaining this prox-
imity between the magnified and interest areas,
users can navigate between different levels of de-
tail more fluidly, improving overall usability.
• Context: This term refers to the region surround-
ing the interest area, which remains visible but un-
altered by the magnification. In systems where
magnification techniques are employed, preserv-
ing the context is critical to maintaining spatial
orientation and understanding how the zoomed-
in details relate to the larger dataset. Without the
context, users may struggle to interpret the mag-
nified information in relation to the whole, poten-
tially leading to confusion or errors in data inter-
pretation.
Currently, as outlined by Cockburn et al. (2009),
there are four primary magnification techniques com-
monly employed to facilitate information visualiza-
tion on display devices:
• Zooming: This is the technique currently imple-
mented in the simulator, where users adjust the
magnification by zooming in and out of the dis-
play. However, a limitation of this approach is
that it introduces a temporal separation between
viewing the overall context and the magnified de-
tails. Users must repeatedly zoom in to examine
finer details and then zoom out to regain a sense
of the larger context, creating a disjointed and less
efficient workflow.
• Overview+Detail: In this technique, the context
and the magnified region are spatially separated
on the screen. Typically, the user sees a smaller,
zoomed-in window (detail) alongside a broader
view (overview) of the entire dataset or map.
While this method provides simultaneous access
to both the magnified details and the general con-
text, it requires users to mentally correlate the two
different views, which can sometimes introduce
cognitive load, particularly when switching focus
between them.
• Focus+Context: This technique aims to provide a
more integrated view by magnifying the interest
area while distorting, but not entirely obscuring,
the surrounding context. For example, a fisheye
lens can enlarge the central area of interest while
maintaining a recognizable but compressed ver-
sion of the nearby context. This approach mini-
mizes the need to switch between zoomed-in and
zoomed-out views, allowing users to maintain sit-
uational awareness of the entire dataset.
• Cue: In this approach, not only the layout of el-
ements within the display but also the way they
are rendered is altered. For instance, particular
objects may be highlighted, dimmed, or filtered
out entirely based on the user’s specific focus or
query. This technique allows for more dynamic
interaction with the dataset by emphasizing rele-
vant details while de-emphasizing or hiding less
critical information, thus guiding the user’s atten-
tion efficiently.
ICEIS 2025 - 27th International Conference on Enterprise Information Systems
450

3 RELATED WORKS
In the survey presented by Tominski et al. (2017), sev-
eral types of interactive lenses were addressed. It is
essential to notice that, according to the authors, an
interactive lens is a tool to visualize part of a dataset
and not only to magnify it. To categorize the tech-
niques, the authors adapted the taxonomy presented
by Shneiderman (2003). One type of interactive lens
the authors approach is the one designed for multi-
variate data, i.e., for data organized in dimensions.
This type of lens can be seen in Decal-Lenses by
Rocha et al. (2018), which adapts itself to follow arbi-
trary surfaces. Another addressed lens type is the one
to analyze geospatial data. Ma et al. (2020) introduce
GTMapLens, a technique to visualize texts associated
with geographical locations.
There are works that, despite not presenting inter-
active lens techniques, help to outline problems re-
lated to the traditional zoom technique and present
their solutions, like Bettio et al. (2021) that pre-
sented a novel approach to assist the user in exploring
datasets by guiding the navigation, and Dumont et al.
(2023) that uses cartographic techniques to add visual
cues to maps while the user is zooming, to reduce user
disorientation. There is also research regarding the
applicability of visualization techniques in different
conditions, e.g., multi-device environments, as pre-
sented by Liu et al. (2023).
In this paper, we are interested in magnifying
lenses and how to minimize context loss. There are
various approaches to this problem. K
¨
aser et al.
(2011) use a bi-manual approach, where one hand
positions the magnifying lens and the other interacts
with the augmented area. Thus, context is only oc-
casionally lost when the magnifying lens is needed.
There are lenses intended for data analysis, such as
Forlines and Shen (2005), lenses that avoid the loss of
context using distortion techniques (Carpendale et al.,
2004), and even through transparency (Pietriga and
Appert, 2008). Finally, the specific problem of mag-
nification for military use on maps has been addressed
in the work of Bortolaso et al. (2013), one of the main
bases for our work.
We detail three works that were fundamental to
the development of the proposed approach, aiming to
facilitate the explanation of the design rationale.
3.1 DtLens
Aiming to allow groups to explore simultaneously
high-resolution spatial data, DtLens was created to
enable multiple augmenting lenses, which, besides
detailing data, provide tools for the user to interact
with it on the tabletop (Forlines and Shen, 2005). The
tool uses distortion to avoid context loss and to bestow
a pliable rubber surface aspect to the dataset. The tool
provides a slider to adjust the magnification (Figure
1). This feature allows the user to easily change the
magnification, even if it requires only one hand.
Figure 1: DTLens, from Forlines and Shen (2005).
3.2 FingerGlass
FingerGlass is a bimanual technique that allows the
user to define an interest area with one hand and to
interact with it using the other in a magnified view
(K
¨
aser et al., 2011). The authors state that the user
should use the non-dominant hand (referred to by
them as ”coarse hand”) to determine this viewport and
to make the interaction using the other one referred to
by them as ”fine hand”). Figure 2 exemplifies a right-
handed user.
This technique aims to decrease the loss of contex-
tual data by setting the position of the magnified view
tangent to the interest area instead of overlapping it.
This way, the immediately adjacent area is preserved.
This tool vanishes when the user releases the coarse
hand to provide a faster interaction.
To adjust the magnification, the user can change
the distance between the coarse hand fingers, which
determine the viewport or the radius of the magnified
view, by dragging the borders of it with the fine hand.
3.3 OrMiS
OrMiS (Orchestrating Military Simulations) is a
tabletop application designed to train military officers
on combat and strategic maneuvers with map-based
tasks (Bortolaso et al., 2013). This tool provides
Enhancing Usability in Large Map Interactions: A Novel Magnifying Lenses Technique for Tabletops
451
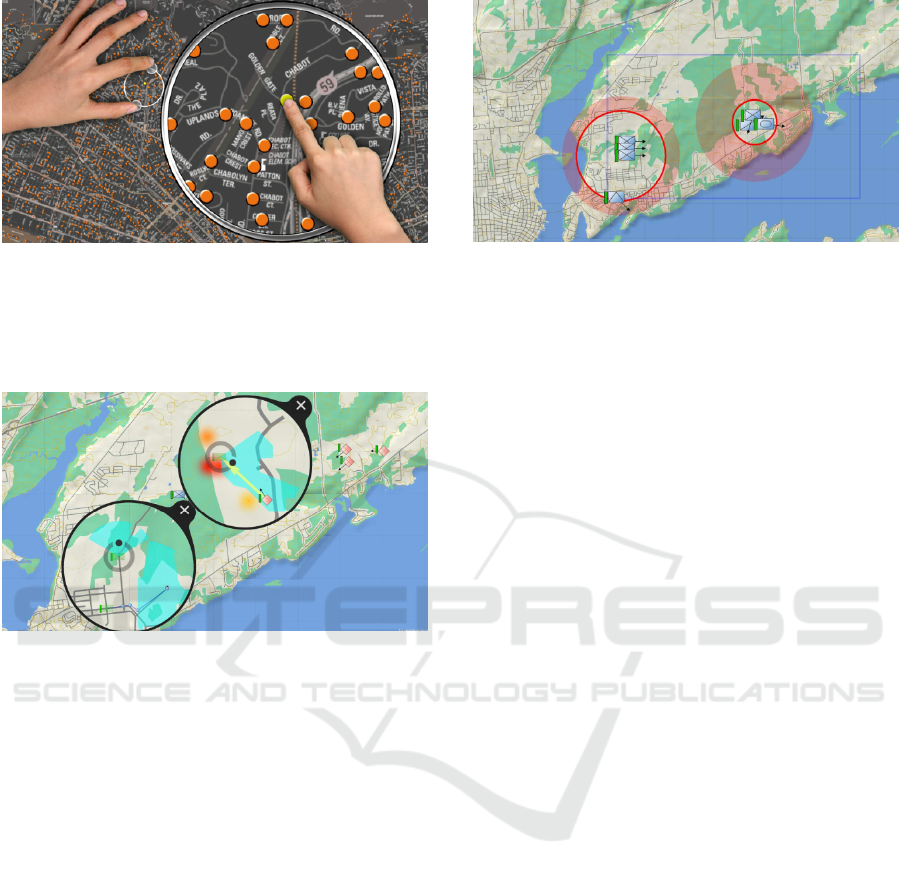
Figure 2: FingerGlass, from K
¨
aser et al. (2011).
lenses that enable users to work at different zoom lev-
els, allowing interaction with specific parts of the map
without disrupting the rest. This enhances simultane-
ous collaboration among trainees. (Figure 3).
Figure 3: Lenses of OrMiS, from Bortolaso et al. (2013).
It is essential to point out that, unlike FingerGlass,
the lens does not require the user’s interaction to be
shown. This feature enables the user to work on dif-
ferent parts of the map without closing it, which is
vital in slow-paced interactions.
The user can adjust the zoom by making a pinch
gesture and move the lens by swiping both move-
ments inside the magnified area. These move-
ments are intuitive and well-established in the human-
computer interface community. However, they may
be slow to use when applied in large datasets, requir-
ing several repetitions of the pinch gesture to achieve
the maximum or the minimum zoom available and the
swipe action to move the lens expressive distances.
It is interesting to show that the authors found a
way to deal with the context loss. Using an auxil-
iary screen, they combined the focus+context tech-
nique used in the lens with the overview+detail tech-
nique. The screen shows the entire map and high-
lights the part displayed with the current global zoom
and the areas the lenses occupy. These areas are di-
vided into two parts: the interest area and the loss
context (highlighted with red) (Figure 4). Therefore,
the users can see all the information hidden by their
lenses and glimpse the magnification ratio they use.
Figure 4: Map overview screen, from Bortolaso et al.
(2013).
3.4 Conclusion
FingerGlass, DTLens, and OrMiS explore human-
computer interaction in multi-touch interfaces, with
a particular focus on zooming techniques and visual
content manipulation. While they share the goal of fa-
cilitating interaction with data on touchscreens, each
has specific features and applications. FingerGlass
proposes a virtual lens to allow the user to magnify a
specific region of the screen on a smaller screen tan-
gent to the interest area, which is ideal for mobile de-
vices such as smartphones and tablets. The multiple
virtual lenses in DTLens allow multiple users to ex-
plore different parts of a map or diagram at the same
time, facilitating collaboration on design and engi-
neering projects. The virtual lens in OrMiS is used to
focus on specific objects within a simulation, allow-
ing users to explore the details of a system or process
in a training environment.
Considering that each of the above techniques was
designed for a specific environment (all different from
the SIS-ASTROS Simulator), neither of them is suit-
able for the required type of interaction. Thus, the
adopted solution combines parts of their approaches.
4 RESEARCH METHOD
The research method consists of four phases, as
shown in Figure 5):
• Identify Tactical Simulator Requirements. In
this step, we identified the critical usability re-
quirements for a virtual tactical simulator that op-
erates on tabletops and uses large-scale maps. The
goal was to determine the essential features and
interactions needed to enhance user experience
using magnifying lenses in this specific context
(see Section 4.1).
• Propose New Approach. Based on an in-depth
analysis of related works and existing literature,
ICEIS 2025 - 27th International Conference on Enterprise Information Systems
452
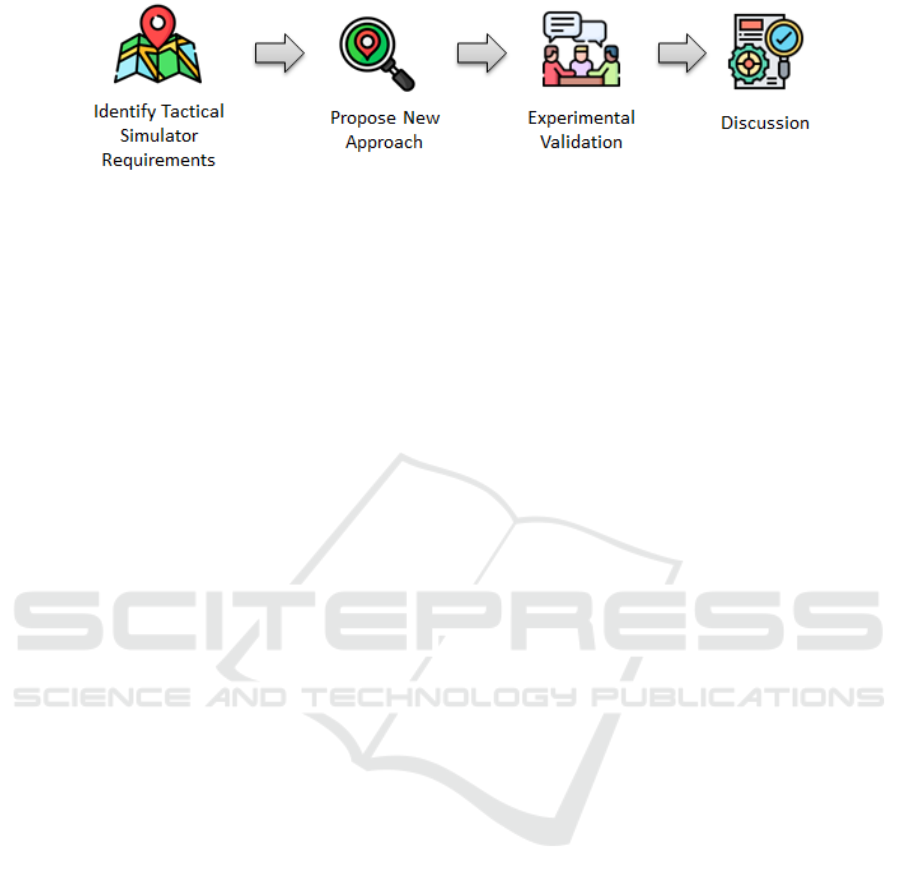
Figure 5: Research method.
we proposed new functionalities for the magnify-
ing lens technique that were tailored to address
the usability challenges identified in tactical sim-
ulation scenarios (see Section 4.2).
• Experimental Validation. We conducted a series
of experiments to validate our approach, gather-
ing both objective and subjective data as described
in Section 5. The objective analysis measured
performance improvements, while the subjective
analysis captured user perceptions through well-
established evaluation methods.
• Discussion. The results obtained were analyzed
and discussed in Section 6, aiming to consolidate
the findings and provide insights for further re-
search and practical applications in tactical sim-
ulation systems.
4.1 Identify Tactical Simulator
Requirements
The SIS-ASTROS Simulator for which we are devel-
oping this magnifier was designed to present two user-
interface perspectives: two-dimensional (2D) and
three-dimensional (3D). From a 2D perspective, the
users interact with a map via a tabletop display. This
touch-screen simulation tabletop, where we intend to
implement the proposed magnifier, allows users to in-
teract with the simulation, performing all the tasks
described in the military doctrine for launching rock-
ets. In technological terms, the digital tabletop is a
capacitive touch-screen interface with 84” 4k resolu-
tion that allows multiple touches simultaneously. The
3D perspective presents the visualization of the simu-
lated terrain, including bridge conditions and vegeta-
tion density, on a Wall-TV panel. A third component,
the instructor’s control station, allows the instructor
to configure simulation exercises through a 2D visu-
alization interface, creating an entire operational situ-
ation that the trainees must examine. All these three
elements are interconnected and synchronized.
The tasks performed in the simulator require pre-
cise control over zooming and panning while simul-
taneously maintaining awareness of the broader oper-
ational landscape. At this stage, several requirements
were defined:
• Quick switching between overview and detail:
Users must be able to transition seamlessly be-
tween a complete overview of the map and de-
tailed views of specific regions. Traditional zoom-
ing methods often require repetitive zooming in
and out, which disrupts the flow of analysis and
can lead to cognitive overload.
• Focus on areas of interest while preserving con-
text: It is essential to allow users to concentrate
on specific areas of interest without losing sight
of the surrounding context. Maintaining the spa-
tial relationship between the magnified area and
the broader map ensures that users do not become
disoriented.
• Intuitive gesture-based controls: Users should be
able to quickly adjust the size and position of the
magnifying lens through intuitive gestures, ensur-
ing that the lens does not obscure critical informa-
tion outside the magnified area. It ensures that in-
teractions are smooth and non-intrusive, enhanc-
ing usability.
This approach is designed to minimize user
fatigue, streamline interactions, and ultimately
support more efficient decision-making in high-
stakes tactical scenarios.
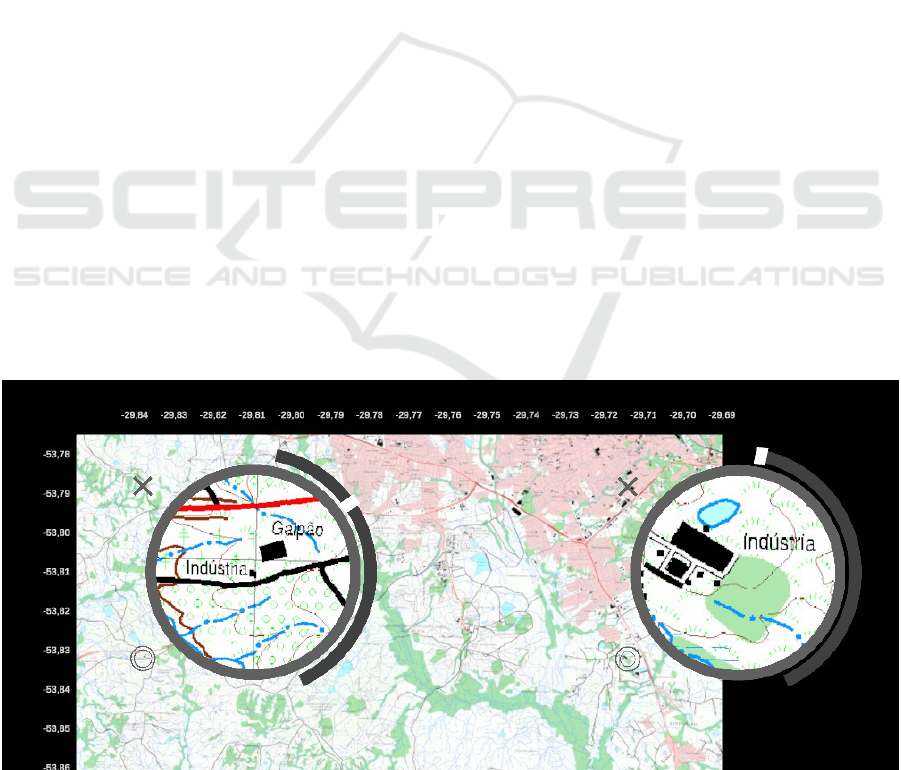
4.2 The New Proposed Approach
The new proposed approach was designed follow-
ing Nielsen’s heuristics (Nielsen and Molich, 1990).
Other heuristic works that were also relevant to the
development - which are specific for tabletops - are
de Franceschi et al. (2020) and de Franceschi et al.
(2021), which discuss the importance of adapting us-
ability heuristics and propose new heuristics for table-
tops, respectively.
To meet the defined requirements for the virtual
tactical simulator, we employed the following tech-
niques: non-vanishing technique, minimizing the loss
of context, and magnification adjustment, each de-
scribed below. The implemented magnifying lenses
can be seen in Figure 6.
Enhancing Usability in Large Map Interactions: A Novel Magnifying Lenses Technique for Tabletops
453
4.2.1 A Non-Vanishing Technique
The technique presented in this paper is meant to be
implemented in a simulator where the interactions are
slow-paced and may lead to menu opening, which re-
quires the user to use both hands. Hence, the feature
of vanishing the lens when the user interrupts his con-
tact with it presented in FingerGlass may not be ad-
equate. It was decided that the best approach in this
scenario was the one present in OrMiS and DtLens,
which allows the user to interact with other parts of
the environment without vanishing.
4.2.2 Minimizing the Loss of Context
In addressing the issue of avoiding context loss in the
area of interest, we rejected the distortion approach
due to its potential interference with usability, aligned
with Bortolaso et al. (2013), as it would impair the
visualization of symbols in the area. To minimize the
loss of context, we opted for a strategy aligned with
FingerGlass, where the enlarged area does not overlap
the area of interest but finds itself tangent to it. This
way, some contextual data will be lost, but only a tiny
part of it will be lost once the augmented area covers
only a part of the area adjacent to the interest area.
4.2.3 Magnification Adjustment
Regarding the magnification adjustment, we decided
to use the slider presented in DtLens because it en-
ables the user to change it with one hand (Figure 6).
Also, due to the use of large maps in the simula-
tor, the user needs to be able to adjust high levels of
magnification without too much effort. The features
presented by OrMiS and FingerGlass would not be
suitable because they would require, respectively, too
many pinch gestures and a considerable offset of the
hands to drag the borders of the lens.
Besides the circular slider, in line with the
overview+detail technique presented in OrMiS, a sub-
indicator that surrounds the interest area is shown in-
side the indicator (Figure 6). The sub-indicator’s ra-
dius varies according to the magnification rate, con-
tributing to the minimized loss of contextual data be-
cause there will not be any element covering the area
between the indicator - which has a constant radius -
and the sub-indicator. Moreover, it provides the user
with additional feedback on the current magnification
rate, which contributes to a more intuitive interaction.
4.2.4 Lens Movement
The lens is moved by dragging the indicator instead of
making a swipe movement inside the magnified view.
This approach was chosen to avoid excessive work-
load in moving the lens throughout the tabletop once
it consists of an 84-inch screen. Independently of the
magnification and, thus, the radius of the interest area,
the indicator keeps a constant size. If it had the same
size as the interest area, with high magnification lev-
els, it would be hard for the user to move the lens
once the human finger is not as precise as a mouse
input (Albinsson and Zhai, 2003).
Figure 6: Two instances of our proposed magnifier. Each one has an indicator (The smaller circle) showing the amount
and where the zoom is applied, and a viewport showing the augmented area. The slider allows the user to change the zoom
amount.
ICEIS 2025 - 27th International Conference on Enterprise Information Systems
454
5 VALIDATION
We opted for an ad-hoc implementation using C# and
the Unity engine to evaluate the concepts applied in
our magnifier. This approach provided a more ag-
ile and efficient way to test, focusing on validating
the usability of the magnifiers without the immediate
need to integrate such features into large-scale soft-
ware.
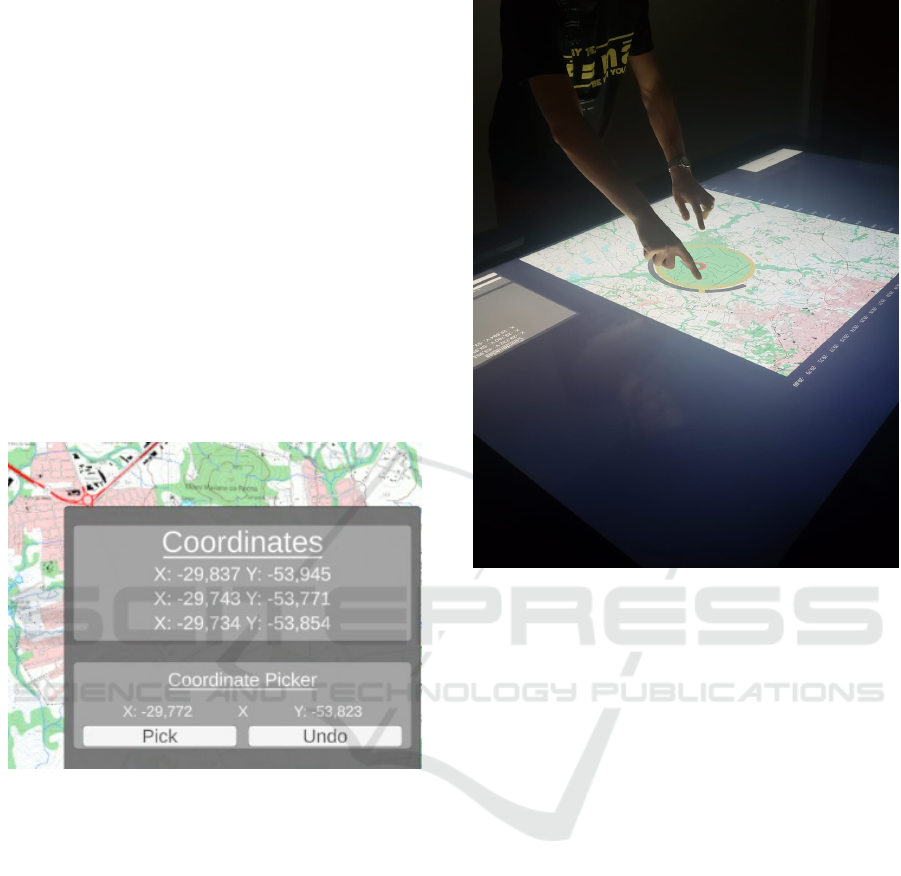
The application consists of a section of a map rep-
resenting a region. At the beginning of the test, the
user is presented with a panel containing three ran-
dom coordinates and a coordinate picker (Figure 7).
The goal for the user is to select the requested coor-
dinates on the map. Each participant performed the
task twice, once using the traditional pan+zoom tech-
nique and once using our magnifiers. The order of
the techniques was alternated for each participant to
avoid training bias in the results.
Figure 7: Coordinates panel.
The map has visual coordinate guides along its
edges to help users position the marker (Figure 6).
This information is lost when the participant zooms
in to achieve greater precision. Conversely, if the user
relies solely on the guides, they fail to select the coor-
dinate accurately. The magnifier addresses this chal-
lenge by offering both precision and context preser-
vation.
The experiment involved 20 students of Engineer-
ing and Computer Science (14 men and 6 women) be-
tween 20 and 25 years old (Figure 8), all of whom
did not have experience with tabletop environments.
They received a brief demonstration on how to use
the touch table before starting the tests. The valida-
tion of our technique was divided into two parts. The
first is an objective analysis, evaluating user accuracy
and task completion time. The second is a subjective
analysis using the NASA-TLX questionnaire after the
test session.
Figure 8: User testing the magnifying lens on a large-scale
map.
5.1 Objective Analysis
To assess the impact of magnifiers on task execution,
we recorded the time (T) it takes for the user to com-
plete the task with and without the use of the tool, as
well as the precision of the coordinates picked, simi-
lar to what is done in Albinsson and Zhai (2003).
5.2 Subjective Analysis
For the subjective analysis, this paper uses the NASA-
TLX questionnaire. This questionnaire evaluates
the workload of a determined task by calculating a
weighted average between the ratings (varying from
5 to 100) given by the subject to assess the impact of
six factors (Hart and Staveland, 1988). The six factors
are Mental Demand (MD), Physical Demand (PD),
Temporal Demand (TD), Performance (P), Effort (E),
and Frustration (F). The performance is assessed in-
versely: lower ratings indicate a greater significance.
Table 1 shows the data collected during the experi-
ment. The ratings will be multiplied by 5, once the
range for the subject to pick is between 1 and 20.
In this study, the weights typically assigned by
each participant to balance the relative importance of
these factors were not collected, as the primary focus
Enhancing Usability in Large Map Interactions: A Novel Magnifying Lenses Technique for Tabletops
455
Table 1: Data collected during the experiment.
User Mode Time MD PD TD P E F Score
0 Pan+Zoom 221.75 17 7 16 5 10 13 0.9745
0 Magnifier 192.39 10 5 10 3 7 6 0.9639
1 Magnifier 104.96 10 10 15 8 10 5 0.9569
1 Pan+Zoom 97.90 5 10 5 5 5 5 0.9808
2 Pan+Zoom 246.41 15 10 10 12 15 10 0.9768
2 Magnifier 192.64 10 8 8 6 8 6 0.9942
3 Pan+Zoom 284.44 12 5 10 8 9 16 0.9946
3 Magnifier 186.22 10 8 10 12 8 13 0.9898
4 Magnifier 256.53 6 1 6 10 1 5 0.9946
4 Pan+Zoom 202.65 10 4 3 9 2 1 0.9811
5 Magnifier 185.60 8 4 5 6 5 3 0.9866
5 Pan+Zoom 103.98 15 8 8 4 10 12 0.9579
6 Pan+Zoom 207.93 5 7 11 11 2 6 0.9732
6 Magnifier 164.77 1 4 7 3 1 3 0.9981
7 Pan+Zoom 93.85 1 1 5 5 3 5 0.9896
7 Magnifier 98.53 5 2 5 5 3 2 0.9914
8 Pan+Zoom 204.15 6 7 11 6 7 6 0.7948
8 Magnifier 257.88 5 7 10 5 7 5 0.9007
9 Magnifier 253.08 15 5 18 10 10 5 0.9779
9 Pan+Zoom 259.06 16 5 12 10 10 4 0.9504
10 Pan+Zoom 276.13 14 17 13 12 11 11 0.9632
10 Magnifier 142.61 10 7 8 17 7 3 0.9743
11 Pan+Zoom 313.06 10 5 13 5 15 11 0.9686
11 Magnifier 272.33 12 7 15 18 10 8 0.9309
12 Magnifier 312.79 11 8 12 3 10 12 0.9741
12 Pan+Zoom 229.28 6 7 6 3 5 3 0.9577
13 Pan+Zoom 259.88 16 6 10 10 4 16 0.9310
13 Magnifier 219.62 12 6 12 14 7 6 0.9610
14 Pan+Zoom 204.47 5 10 5 10 15 10 0.9842
14 Magnifier 202.25 10 5 5 5 10 7 0.9723
15 Pan+Zoom 138.31 10 10 10 5 1 1 0.9791
15 Magnifier 150.41 5 10 5 5 1 1 0.9807
16 Magnifier 182.15 16 10 16 15 11 8 0.9849
16 Pan+Zoom 113.33 13 12 15 17 10 6 0.9901
17 Pan+Zoom 198.02 10 10 15 10 10 10 0.9739
17 Magnifier 139.33 5 5 5 5 5 5 0.9782
18 Pan+Zoom 152.19 7 14 15 5 13 3 0.9392
18 Magnifier 199.08 5 4 9 3 8 2 0.9809
19 Magnifier 96.66 5 8 2 18 5 5 0.9873
19 Pan+Zoom 147.17 10 5 8 15 8 2 0.9245
was on analyzing the individual scores for each cate-
gory rather than the overall weighted score.
6 RESULTS AND DISCUSSION
As previously mentioned, to avoid training bias, some
of the participants (13) began the test round using
the pan-zoom technique, while the others (7) started
with the proposed approach. Hence, the data is di-
vided into two groups for the analysis. The first one
presents data of both the zoom and the lens of the first
round only (Figure 11), while the latter, the second
round (Figure 12). After these individual analyses,
we present the overall results (Figure 13).
For the first round (Figure 11), it can be seen
that the Mental Demand (MD) of the lens is slightly
higher, which is expected once it presents unfamiliar
features for the users, who are in touch with the tech-
niques around zooming, such as pinching and sliding
on a daily basis. The lens presented a significantly
lower Physical Demand (PD) and Effort (E) because
ICEIS 2025 - 27th International Conference on Enterprise Information Systems
456
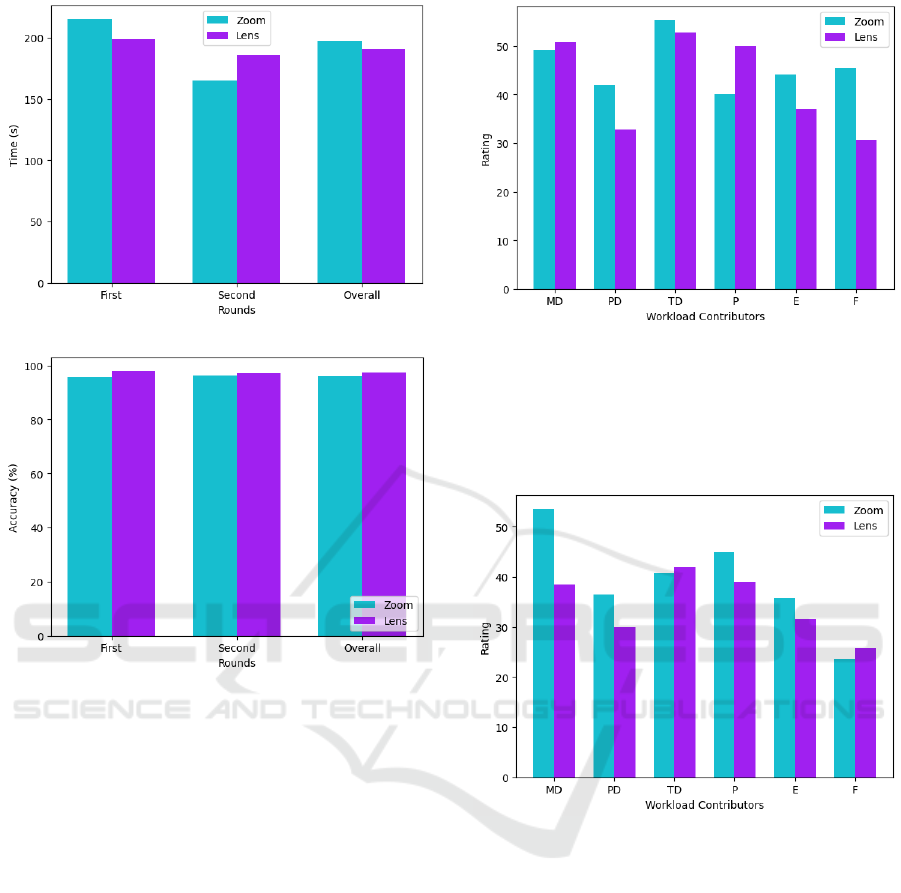
Figure 9: Average Time to Complete the Task.
Figure 10: Average Accuracy of the Task.
it involved fewer movements to perform the task. Re-
garding the Frustration (F), it can be said that the lens
outperformed the zooming technique as well, which
indicates that, overall, the users found the lens to be
more pleasant to use. Interestingly, the subjects felt
considerable time pressure (TD) and felt that their
performance using the lens wasn’t as good as their
performance using the zooming. However, as Figures
9 and 10 show, the average time to complete the tasks
using the lens was lower and the accuracy higher, in-
dicating that the users had high expectations of their
performance using the lens.
For the second round (Figure 12), in general, the
workload contributors’ ratings decreased, which indi-
cates that there is a learning curve regarding the use
of the test environment. Another indication of this is
the fact that the Mental Demand for the lens dropped
while the zoom didn’t change much, meaning that
even a more complex tool can be easily used once the
user has little contact with the environment. The sub-
jects felt a higher frustration but still considered the
effort to be lower. They felt a more significant time
pressure using the lens. It can be seen in Figure 9 as
Figure 11: First Round Workload Ratings.
well, which shows that the user took a more signif-
icant time to complete the tasks. Nevertheless, they
considered their performance with the lens to be bet-
ter and had higher accuracy using it.
Figure 12: Second Round Workload Ratings.
Overall (Figure 13), the lens outperformed the
zoom in every aspect but the performance, which, as
mentioned before, is probably due to high expecta-
tions of the subjects, once the average accuracy and
time to complete the tasks were better using it.
7 CONCLUSION
In the present work, we develop a new approach to
improve users’ interaction with large datasets in table-
top environments. We describe the design of a digital
magnifying lens as a tool to highlight specific areas of
interest on a map, aiming to minimize loss of context
and improve interaction efficiency.
The results of the usability validation analysis re-
vealed that the proposed magnifying lens helped the
Enhancing Usability in Large Map Interactions: A Novel Magnifying Lenses Technique for Tabletops
457
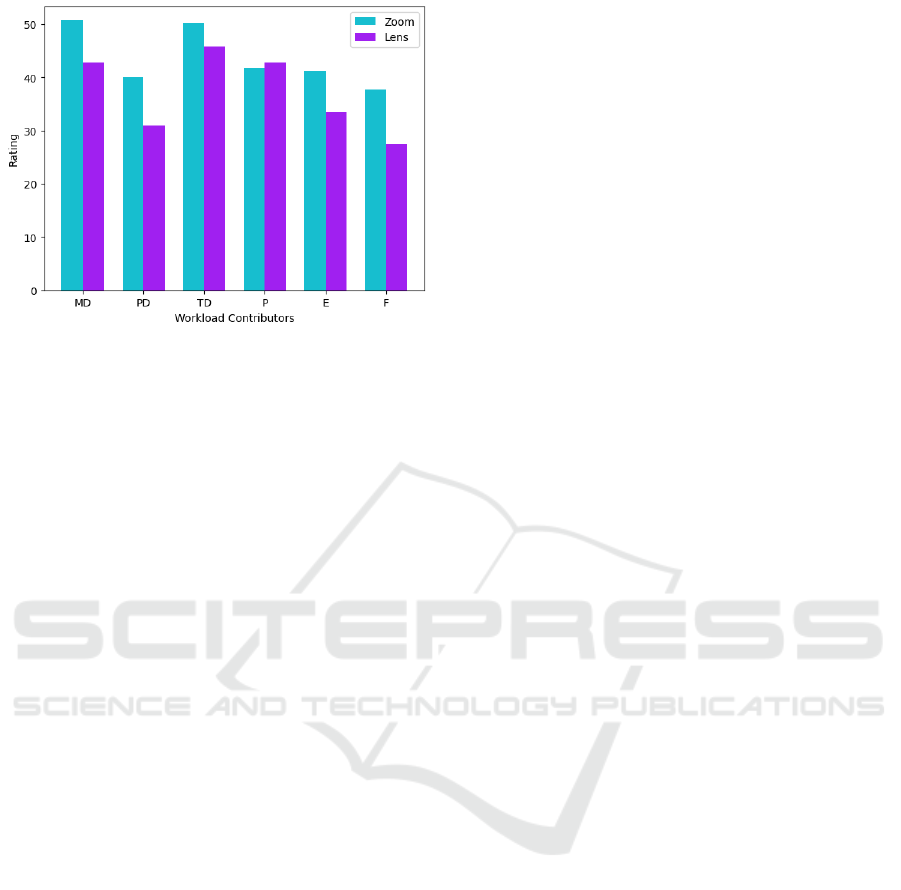
Figure 13: Overall Workload Ratings.
users to perform tasks involving high-precision coor-
dinate picking on a large map. Both the time needed
to finish the activity and the accuracy were better
than the traditional pan-zooming. Moreover, the users
felt more comfortable using the lens according to the
NASA-TLX questionnaire results, in which the lens
outperforms the zooming in all aspects except perfor-
mance. As mentioned, this fact is probably due to the
high expectations the subjects had with the lens once
their performance using it was better in terms of the
average accuracy and time to complete the tasks.
Given the positive result, implementing our tech-
nique over the traditional pan-zooming technique is
worth it. Although the tests were conducted on a large
tabletop for a military simulation project, it is worth
noting that this technique can be used on other plat-
forms, improving interactions in various types of ap-
plications, simulation environments, or serious games
involving data analysis, interaction with maps, secu-
rity, and surveillance, among others.
For future work, it is recommended that the mag-
nifying lens be implemented in practical environ-
ments to evaluate its effectiveness in real contexts of
use.
ACKNOWLEDGEMENTS
We thank the Brazilian Army and its Army Strategic
Program ASTROS for the financial support through
the SIS-ASTROS GMF project (898347/2020).
REFERENCES
Albinsson, P.-A. and Zhai, S. (2003). High precision touch
screen interaction. In Proceedings of the SIGCHI
Conference on Human Factors in Computing Systems,
CHI ’03, page 105–112, New York, NY, USA. Asso-
ciation for Computing Machinery.
Bettio, F., Ahsan, M., Marton, F., and Gobbetti, E. (2021).
A novel approach for exploring annotated data with
interactive lenses. In Computer Graphics Forum, vol-
ume 40, pages 387–398. Wiley Online Library.
Bortolaso, C., Oskamp, M., Graham, T. N., and Brown, D.
(2013). Ormis: a tabletop interface for simulation-
based training. In Proceedings of the 2013 ACM Inter-
national Conference on Interactive Tabletops and Sur-
faces, ITS ’13, page 145–154, New York, NY, USA.
Association for Computing Machinery.
Bortolaso, C., Oskamp, M., Phillips, G., Gutwin, C., and
Graham, T. N. (2014). The effect of view techniques
on collaboration and awareness in tabletop map-based
tasks. In Proceedings of the Ninth ACM Interna-
tional Conference on Interactive Tabletops and Sur-
faces, pages 79–88.
Carpendale, S., Light, J., and Pattison, E. (2004). Achiev-
ing higher magnification in context. In Proceedings
of the 17th Annual ACM Symposium on User Inter-
face Software and Technology, UIST ’04, page 71–80,
New York, NY, USA. Association for Computing Ma-
chinery.
Cockburn, A., Karlson, A., and Bederson, B. B. (2009).
A review of overview+ detail, zooming, and focus+
context interfaces. ACM Computing Surveys (CSUR),
41(1):1–31.
de Franceschi, V. D., Fontoura, L. M., and Silva, M. A. R.
(2020). Usability heuristics for tabletop systems de-
sign. In ICEIS (2), pages 555–562.
de Franceschi, V. D., Fontoura, L. M., and Silva, M. A. R.
(2021). Tabletop interface design: Developing and
using usability heuristics. In Filipe, J.,
´
Smiałek, M.,
Brodsky, A., and Hammoudi, S., editors, Enterprise
Information Systems, pages 708–729, Cham. Springer
International Publishing.
D
¨
oweling, S., Tahiri, T., Riemann, J., and M
¨
uhlh
¨
auser,
M. (2016). Collaborative interaction with geospatial
data—a comparison of paper maps, desktop gis and
interactive tabletops. Collaboration Meets Interactive
Spaces, pages 319–348.
Dumont, M., Touya, G., and Duch
ˆ
ene, C. (2023). More is
less–adding zoom levels in multi-scale maps to reduce
the need for zooming interactions. Journal of Spatial
Information Science, (27):93–124.
Fitzmaurice, G. W. and Buxton, W. (1997). An empirical
evaluation of graspable user interfaces: towards spe-
cialized, space-multiplexed input. In Proceedings of
the ACM SIGCHI Conference on Human factors in
computing systems, pages 43–50.
Forlines, C. and Shen, C. (2005). Dtlens: multi-user table-
top spatial data exploration. In Proceedings of the 18th
Annual ACM Symposium on User Interface Software
and Technology, UIST ’05, page 119–122, New York,
NY, USA. Association for Computing Machinery.
Hart, S. G. and Staveland, L. E. (1988). Development of
nasa-tlx (task load index): Results of empirical and
theoretical research. In Hancock, P. A. and Meshkati,
ICEIS 2025 - 27th International Conference on Enterprise Information Systems
458

N., editors, Human Mental Workload, volume 52
of Advances in Psychology, pages 139–183. North-
Holland.
K
¨
aser, D. P., Agrawala, M., and Pauly, M. (2011). Finger-
glass: efficient multiscale interaction on multitouch
screens. In Proceedings of the SIGCHI Conference
on Human Factors in Computing Systems, CHI ’11,
page 1601–1610, New York, NY, USA. Association
for Computing Machinery.
Kubicki, S., Lebrun, Y., Lepreux, S., Adam, E., Kolski, C.,
and Mandiau, R. (2013). Simulation in contexts in-
volving an interactive table and tangible objects. Sim-
ulation Modelling Practice and Theory, 31:116–131.
Liu, Y., Zhang, Z., Pan, Y., Li, Y., Liang, H.-N., Craig, P.,
and Yu, L. (2023). A study of zooming, interactive
lenses and overview+ detail techniques in collabora-
tive map-based tasks. In 2023 IEEE 16th Pacific Visu-
alization Symposium (PacificVis), pages 11–20. IEEE.
Ma, C., Zhao, Y., AL-Dohuki, S., Yang, J., Ye, X., Kamw,
F., and Amiruzzaman, M. (2020). Gtmaplens: In-
teractive lens for geo-text data browsing on map. In
Computer Graphics Forum, volume 39, pages 469–
481. Wiley Online Library.
Madni, T. M., Nayan, Y. B., Sulaiman, S., Abro, A., and
Tahir, M. (2016). Usability evaluation of orientation
techniques for medical image analysis using table-
top system. In 2016 3rd International Conference
on Computer and Information Sciences (ICCOINS),
pages 477–482.
Mateescu, M., Pimmer, C., Zahn, C., Klinkhammer, D., and
Reiterer, H. (2021). Collaboration on large interactive
displays: a systematic review. Human–Computer In-
teraction, 36(3):243–277.
Nielsen, J. and Molich, R. (1990). Heuristic evaluation of
user interfaces. In Proceedings of the SIGCHI Confer-
ence on Human Factors in Computing Systems, CHI
’90, page 249–256, New York, NY, USA. Association
for Computing Machinery.
Pietriga, E. and Appert, C. (2008). Sigma lenses: focus-
context transitions combining space, time and translu-
cence. In Proceedings of the SIGCHI Conference
on Human Factors in Computing Systems, CHI ’08,
page 1343–1352, New York, NY, USA. Association
for Computing Machinery.
Rocha, A., Silva, J. D., Alim, U. R., Carpendale, S.,
and Sousa, M. C. (2018). Decal-lenses: Interactive
lenses on surfaces for multivariate visualization. IEEE
transactions on visualization and computer graphics,
25(8):2568–2582.
Salvador-Herranz, G., Camba, J. D., Naya, F., and Con-
tero, M. (2016). On the integration of tangible ele-
ments with multi-touch surfaces for the collaborative
creation of concept maps. In Learning and Collabo-
ration Technologies: Third International Conference,
LCT 2016, Held as Part of HCI International 2016,
Toronto, ON, Canada, July 17-22, 2016, Proceedings
3, pages 177–186. Springer.
Shneiderman, B. (2003). The eyes have it: A task by data
type taxonomy for information visualizations. In The
craft of information visualization, pages 364–371. El-
sevier.
Tominski, C., Gladisch, S., Kister, U., Dachselt, R., and
Schumann, H. (2017). Interactive lenses for visual-
ization: An extended survey. In Computer Graphics
Forum, volume 36, pages 173–200. Wiley Online Li-
brary.
Westendorf, L., Shaer, O., Varsanyi, P., Meulen, H. V. D.,
and Kun, A. (2017). Understanding collaborative de-
cision making around a large-scale interactive table-
top. Proceedings of the ACM on Human-Computer
Interaction, 1:1 – 21.
Yang, Q., Liu, J., Qin, Y., Yu, C., Yuan, Q., and Shi, Y.
(2014). Studying accessible states of user interfaces
on tabletops. In 2014 IEEE 11th Intl Conf on Ubiqui-
tous Intelligence and Computing and 2014 IEEE 11th
Intl Conf on Autonomic and Trusted Computing and
2014 IEEE 14th Intl Conf on Scalable Computing and
Communications and Its Associated Workshops, pages
402–405.
Enhancing Usability in Large Map Interactions: A Novel Magnifying Lenses Technique for Tabletops
459
