
Automatic Drywall Analysis for Progress Tracking and Quality Control
in Construction
Mariusz Trzeciakiewicz
1 a
, Aleixo Cambeiro Barreiro
1 b
, Niklas Gard
1,2 c
,
Anna Hilsmann
1 d
and Peter Eisert
1,2 e
1
Fraunhofer HHI, Berlin, Germany
2
Humboldt University of Berlin, Berlin, Germany
{mariusz.trzeciakiewicz, aleixo.cambeiro, niklas.gard, anna.hilsmann, peter.eisert}@hhi.fraunhofer.de
Keywords:
Automated Drywall Analysis, Construction Progress Tracking, Quality Control, Building Digitalization,
Deep Learning, Data Augmentation.
Abstract:
Digitalization in the construction industry has become essential, enabling centralized, easy access to all rele-
vant information of a building. Automated systems can facilitate the timely and resource-efficient documen-
tation of changes, which is crucial for key processes such as progress tracking and quality control. This paper
presents a method for image-based automated drywall analysis enabling construction progress and quality
assessment through on-site camera systems. Our proposed solution integrates a deep learning-based instance
segmentation model to detect and classify various drywall elements with an analysis module to cluster indi-
vidual wall segments, estimate camera perspective distortions, and apply the corresponding corrections. This
system extracts valuable information from images, enabling more accurate progress tracking and quality as-
sessment on construction sites. Our main contributions include a fully automated pipeline for drywall analysis,
improving instance segmentation accuracy through architecture modifications and targeted data augmentation,
and a novel algorithm to extract important information from the segmentation results. Our modified model,
enhanced with data augmentation, achieves significantly higher accuracy compared to other architectures, of-
fering more detailed and precise information than existing approaches. Combined with the proposed drywall
analysis steps, it enables the reliable automation of construction progress and quality assessment.
1 INTRODUCTION
Digitalization has become essential on modern con-
struction sites, centralizing all the relevant build-
ing data and enabling dynamic, distributed access
to vital project information. Recent efforts have
aimed to enhance digitalization in construction, such
as model reconstruction from scanned 2D floor-
plans (Kalervo et al., 2019; Lv et al., 2021; Cam-
beiro Barreiro et al., 2023), text analysis of construc-
tion plans (Sch
¨
onfelder and K
¨
onig, 2022), and auto-
mated digitalization of fire safety information (Bayer
and Aziz, 2022).
Additionally, AI-based applications using digi-
tal models are emerging, demonstrating the grow-
a
https://orcid.org/0009-0007-6445-5759
b
https://orcid.org/0000-0002-1019-4158
c
https://orcid.org/0000-0002-0227-2857
d
https://orcid.org/0000-0002-2086-0951
e
https://orcid.org/0000-0001-8378-4805
ing demand for digitalization in modernizing the in-
dustry. Examples include leveraging digital models
for autonomous robot localization (Zhao and Cheah,
2023), increasing worksite automation, and localizing
building interior images for automating inspection re-
sults (Gard et al., 2024).
In practice, digital frameworks support key pro-
cesses throughout a construction project’s life cycle,
such as real-time progress tracking and quality as-
surance, by maintaining up-to-date status information
for building elements. This enables effective evalua-
tion and ensures compliance with planning and qual-
ity norms over time. However, keeping information
up to date is a costly task, both in terms of time and re-
sources. This makes the automation of this field very
valuable for the construction industry.
In terms of automation, image-based analysis is
particularly useful, due to its potential to extract com-
plex information from a scene without human in-
tervention (Ekanayake et al., 2021). With recent
advancements in deep learning techniques, such as
Trzeciakiewicz, M., Barreiro, A. C., Gard, N., Hilsmann, A. and Eisert, P.
Automatic Drywall Analysis for Progress Tracking and Quality Control in Construction.
DOI: 10.5220/0013302500003912
Paper published under CC license (CC BY-NC-ND 4.0)
In Proceedings of the 20th International Joint Conference on Computer Vision, Imaging and Computer Graphics Theory and Applications (VISIGRAPP 2025) - Volume 3: VISAPP, pages
707-716
ISBN: 978-989-758-728-3; ISSN: 2184-4321
Proceedings Copyright © 2025 by SCITEPRESS – Science and Technology Publications, Lda.
707

the spread of accurate instance segmentation models,
the ability to automatically analyze construction site
scenes has improved significantly.
In this paper, we focus our attention on the use
of computer vision techniques for drywall analysis,
with the goal of enabling automatic progress track-
ing and quality control. (Wei et al., 2022) classifies
walls into broad categories such as “under construc-
tion” and “finished”. However, it fails to detect in-
dividual wall material types, making it impossible to
estimate intermediate progress stages. On the other
hand, (Ekanayake et al., 2024) distinguishes between
material types but does not segment individual ele-
ments. Another method, (Pal et al., 2023), identifies
different phases of drywall construction and detects
individual elements. However, the range of detected
element types remains limited, and the accuracy for
certain classes is relatively low.
To address the limitations of existing approaches,
this paper introduces a tailored instance segmenta-
tion model for detecting and classifying individual
drywall elements. To further improve model accu-
racy and ensure a good class coverage, particularly
in scenarios with limited data, we introduce a tar-
geted data augmentation strategy. Additionally, algo-
rithms are introduced for drywall analysis, enabling
the separation of multiple drywall segments in an im-
age and their transformation into orthographic projec-
tions. These algorithms form the basis for a detailed
analysis of the construction process, facilitating pre-
cise, segment-specific progress tracking and compli-
ance checks with construction norms.Specifically, the
contributions of this paper are:
• We propose a specialized instance segmentation
model for detecting and classifying individual
drywall elements.
• We enhance the model’s accuracy through a tar-
geted data augmentation method.
• We develop a set of wall analysis algorithms,
enabling new opportunities for automation of
progress estimation and quality assurance.
2 RELATED WORK
Automated wall analysis has received some attention
in the literature (Wei et al., 2022; Ekanayake et al.,
2024; Chauhan and Sepp
¨
anen, 2023). In (Wei et al.,
2022), the authors employ a deep learning model
for classification. However, they classify walls into
general categories such as “no construction”, “un-
der construction”, and “finished”, without detecting
the types of elements used during the building pro-
cess. In contrast, (Ekanayake et al., 2024) presents
a method that classifies different types of elements.
However the authors do not distinguish between indi-
vidual objects. Instead, they detect regions in the im-
age where a certain element has been installed. While
this improves wall progress analysis, separating in-
dividual elements would provide more detailed in-
formation and enable analysis of their relationships,
such as checking whether metal frames are correctly
spaced and parallel. Both (Shamsollahi et al., 2021)
and (Ying and Lee, 2019) implement deep learning
models for detecting and classifying individual ele-
ments on construction sites. However, (Shamsollahi
et al., 2021) focuses on duct detection, while (Ying
and Lee, 2019) classifies walls, lifts, and doors.
(Pal et al., 2023) highlights that most vision-based
progress monitoring methods rely on a binary clas-
sification of progress as “finished” or “not finished”,
which overlooks the gradual and multi-stage nature of
real-world construction. For instance, in drywall con-
struction, it is possible to detect the metal skeleton’s
completion, estimate the insulation’s percentage, and
verify the alignment of metal frames.
A more detailed approach is proposed in
(Chauhan and Sepp
¨
anen, 2023), defining distinct
stages like installing metal frames, drywall panels,
and insulation. While this method improves stage-
specific progress estimation, limited data led to lower
accuracy in detecting metal frames and excluded in-
sulation from the pipeline, hindering comprehensive
performance.
Compared to (Wei et al., 2022), which focuses
on general wall classifications, we detect and classify
key drywall elements for progress and quality esti-
mation, including “drywall panels”, “metal frames”,
“wood panels”, and “insulation materials”. In con-
trast to (Ekanayake et al., 2024), our method separates
each individual drywall element, enabling a detailed
analysis of how their relationships. We also introduce
a data augmentation strategy to address dataset limi-
tations. In comparison with (Chauhan and Sepp
¨
anen,
2023), our approach effectively detects all key types
of drywall elements. Furthermore, unlike other ap-
proaches, we cluster and correct perspective distor-
tions in drywall segments, enabling detailed progress
estimation and quality assurance in drywall construc-
tion.
3 METHODOLOGY OVERVIEW
Figure 1 illustrates the proposed pipeline, which con-
sists of two main components: instance segmenta-
VISAPP 2025 - 20th International Conference on Computer Vision Theory and Applications
708
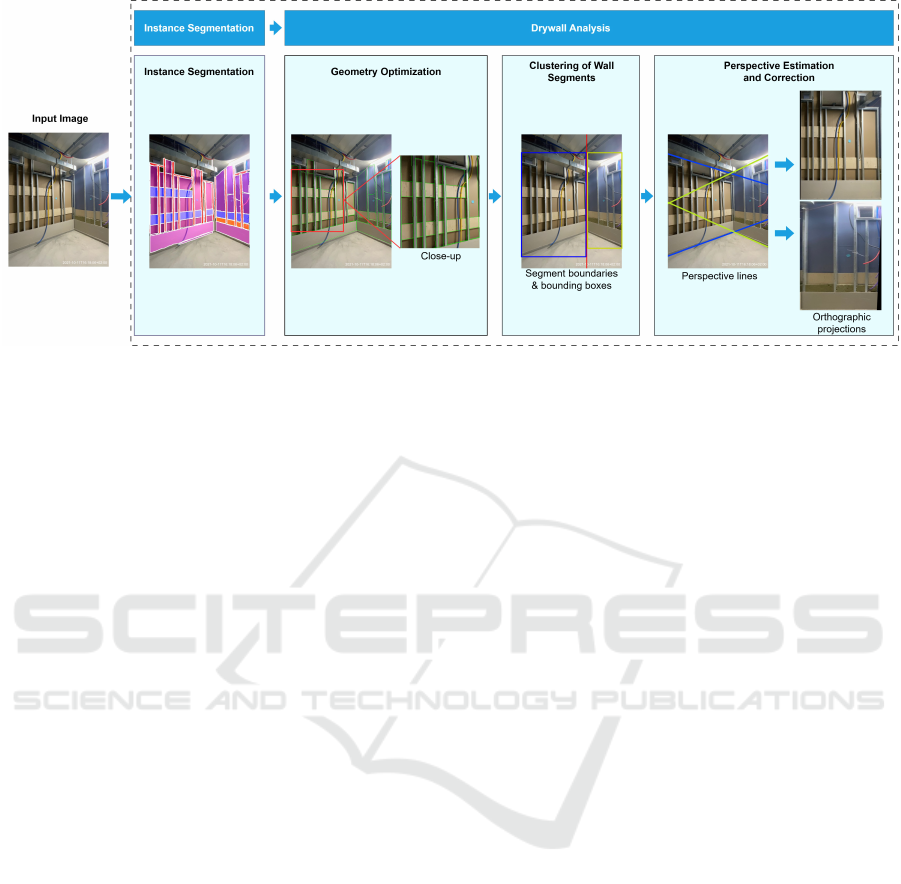
Figure 1: Instance segmentation and drywall analysis pipeline.
tion and drywall analysis. The instance segmentation
component, described in detail in Section 5, uses a
modified Mask R-CNN model (Section 5.1) to detect
individual drywall components, enhanced by task-
specific data augmentation techniques (Section 5.2).
In the drywall analysis component, detailed in Sec-
tion 6, we process the output of the instance segmen-
tation model. First, we simplify and optimize the
detected geometries based on prior knowledge (Sec-
tion 6.1). Then, using these optimized geometries
and the orientation of their edges, we separate dry-
wall segments when multiple are present in the im-
age (Section 6.2). Finally, based on the refined ge-
ometries, we estimate perspective distortions caused
by varying drywall angles relative to the camera and
correct these distortions to obtain orthographic pro-
jections (see Section 6.3).
4 DATASET
We use a dataset of 176 drywall images, divided
into two subsets: 140 images for training and 36 for
testing. Each image, with resolutions of 600×800,
800×450, or 800×600 pixels, is manually annotated
with class labels, segmentation masks, and bounding
boxes for each element of four essential classes: wood
panel, insulation, drywall panel, and metal frame.
These classes represent the main elements involved
in the construction of a drywall, and are crucial for
accurate progress and quality estimation.
These images capture drywalls at various stages of
construction, some of them containing multiple wall
segments. The majority depict walls in an intermedi-
ate phase, with interior layers exposed, often showing
elements from each class. A few images show only
the metal frame skeleton, while others display com-
pleted, plastered walls ready for painting.
The main challenges of the dataset, which moti-
vated the development of the proposed data augmen-
tation technique (Section 5.2), are its limited size and
the variability of materials within the same class.
In addition to this dataset, we obtained a sepa-
rate video recording documenting the construction of
a drywall structure for a new room within a build-
ing. Selected frames from this recording were used
to assess the generalization capabilities of our dry-
wall analysis pipeline on scenes outside the training
dataset. This approach allows us to evaluate the prac-
tical viability of our method for application in real-
world construction projects.
5 COMPONENT DETECTION
We propose a modified deep learning architecture for
detecting drywall elements in camera images, incor-
porating task-specific enhancements to improve per-
formance. Additionally, we introduce a drywall-
specific data augmentation technique that increases
dataset variability, addressing challenges posed by
limited training data and enhancing model accuracy.
Accurate drywall analysis depends on extracting
high-quality, detailed information from images, en-
abling precise results and enriching digital models
with valuable metadata for tracking and quality con-
trol. To achieve this, we focus on detecting and clas-
sifying individual drywall elements with high spatial
accuracy. Instance segmentation, chosen for its pixel-
wise masks, provides the precision needed to meet the
stringent requirements of automated drywall analysis,
surpassing simpler bounding-box detection methods.
Automatic Drywall Analysis for Progress Tracking and Quality Control in Construction
709
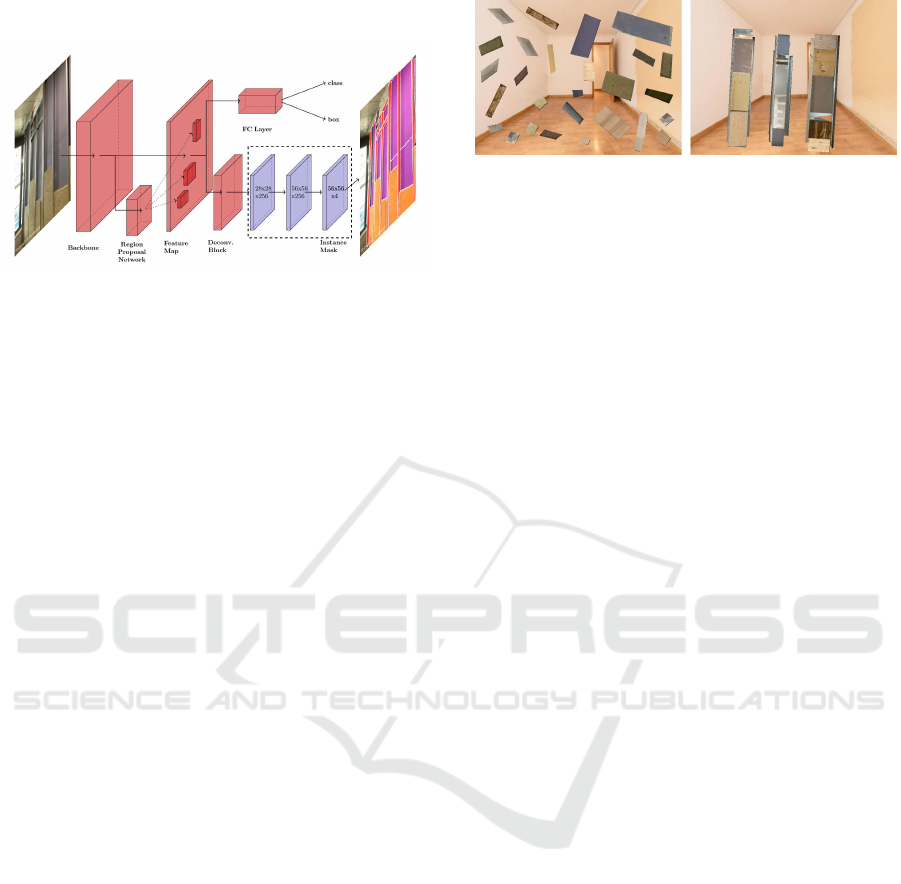
5.1 Model Architecture
Figure 2: Proposed modification of the Mask R-CNN ar-
chitecture. We replace the backbone used in the original
paper with the ConvNeXt V2 model, introduce additional
ratios for computing anchor boxes, and add a block of de-
convolutional layers at the end of the instance mask branch
to increase the output mask resolution.
For instance segmentation, we employ a modified ver-
sion of Mask R-CNN (He et al., 2017), an architec-
ture whose variants with different backbones achieve
state-of-the-art results (Dalva et al., 2023) on widely
recognized benchmark datasets such as COCO (Lin
et al., 2014). This choice was motivated by the
model’s strong performance and adaptability across
various segmentation tasks.
The modified architecture is illustrated in Fig-
ure 2. The first modification involves replacing the
original backbone model. After evaluating several op-
tions, ConvNeXt V2 (Woo et al., 2023) yielded the
best results on our dataset, leading us to select it as
the backbone for our model.
The second proposed modification accounts for
the unique characteristics of the elements in the
dataset and the way Mask R-CNN calculates region
proposals. To detect objects in images, Mask R-CNN
contains a block of convolutional layers called the Re-
gion Proposal Network (RPN) that identifies potential
object locations by generating a set of anchor boxes,
distributed over the entire image, based on a list of
predefined ratios. Each of these ratios is responsible
for detecting objects of different shapes. The RPN is
then trained to predict whether each anchor box cor-
responds to an object or background, and to adjust the
anchor box coordinates to match the object’s size.
In our dataset, most objects share similar, typi-
cally rectangular shapes, aligning well with the an-
chor box shapes in the original model. However,
metal frames are usually long and narrow, making
them less suited to the original anchor box configu-
rations and harder for the model to detect accurately.
To address this, we introduce additional ratios during
the anchor boxes generation step allowing the model
to better capture the distinctive shape of metal frames.
Figure 3: Example of synthetic images. The left im-
age shows augmentation with randomized placement of
cropped elements, while the right image demonstrates struc-
tured placement.
The final proposed modification to the model ad-
dresses the size of the predicted instance masks. The
original instance segmentation branch of Mask R-
CNN produces low-resolution binary masks with a
fixed size of 28×28 pixels. These masks are then up-
scaled to match the dimensions of the detected object
in the original image. This incurs a loss of spatial
resolution that often introduces artifacts, especially
for larger elements, causing distortions in object out-
lines. To reduce these artifacts, we add a set of de-
convolution layers at the end of the instance segmen-
tation branch, increasing the resolution of the masks
to 56×56 pixels before the upscaling step. This mod-
ification results in smoother and more accurate object
borders.
5.2 Data Augmentation
The number of images in our dataset is limited, with
176 samples to train and validate our model. For com-
parison, in (He et al., 2017), the authors trained their
Mask R-CNN model on the COCO dataset, which
contains 330,000 images. This scarcity of training
data poses a challenge in achieving a model with good
generalization capabilities.
A common approach to address training data
scarcity, particularly when acquiring additional sam-
ples is unfeasible or costly, is to employ data augmen-
tation techniques. In addition to basic methods, such
as random rotation, flipping, or scaling of training im-
ages, we here adapt a more sophisticated technique
introduced in (Cambeiro Barreiro et al., 2022). To
generate new training samples, labeled samples are
selected from the training set that constitute “good
examples”, i.e. with unambiguous labels and cover-
ing sufficient appearance variations. These selected
examples are then used to generate synthetic images.
To this end, randomized transformations such as rota-
tion, translation and scaling are applied to the exam-
ples, which are then pasted onto backgrounds consist-
ing of a collage of random COCO images, increasing
the variety of a scarce dataset.
VISAPP 2025 - 20th International Conference on Computer Vision Theory and Applications
710

Drywall elements are, however, usually arranged
in a specific, structured layout, providing additional
contextual information that can be leveraged to im-
prove training. Insulation is usually placed between
parallel, evenly spaced metal frames, with wall and
wood panels attached to them. Randomly position-
ing the objects in a synthetic image disrupts this spe-
cific structure of a drywall, reducing realism. For this
reason, we modify the aforementioned data augmen-
tation method to generate synthetic images that more
accurately reflect the organized configuration of dry-
wall construction.
Following the approach in (Cambeiro Barreiro
et al., 2022), we first select suitable elements using
the same criteria as the original method. Instead of
randomly pasting the selected objects onto new im-
ages, we insert them in a more structured way. We
start by sampling long metal frames, positioning them
vertically and parallel at random intervals. The space
between adjacent frames is divided into rectangular
slots, filled with randomly selected, scaled examples
from various classes. Occasionally, spaces are left
empty to increase dataset variety. Finally, the columns
are rotated randomly around the image center. Instead
of COCO, we use a dataset that contains images of
empty rooms, called room-interior (Research, 2023).
This allows the model to distinguish drywall elements
from common background objects found in indoor en-
vironments, such as painted walls, ceilings and floors.
An example of a synthetic image generated using this
method is shown in Figure 3.
6 DRYWALL ANALYSIS
Once the construction elements are localized in an
image, we can analyze them to extract information
relevant to the digital model, enabling tasks such as
progress evaluation or quality control based on prede-
fined standards.
Some images include multiple wall segments,
which presents a unique challenge. Ideally, the infor-
mation for each individual segment should be stored
separately to increase the level of detail in the digi-
tal model, since they may be at different construction
stages. Therefore, we must first identify the elements
belonging to each segment. Additionally, each seg-
ment is captured from a different angle, resulting in
varying perspectives. By isolating segments and cor-
recting their perspective distortions, we generate an
orthographic projection of each, enabling more com-
plex analysis. This allows us to detect structural is-
sues that would be difficult to assess in perspective-
distorted images, facilitating automated quality con-
trol by verifying, for example, that metal frames are
parallel and installed at the correct intervals.
It is trivial to differentiate wall segments that are
physically separated from one another. Walls forming
a corner can be distinguished by their perspective dis-
tortions. In an upright camera perspective view of a
wall segment, all associated horizontal lines converge
at a common vanishing point, which varies for each
segment if they are at different angles. The horizon-
tal sides of the detected elements provide an estima-
tion of the horizontal lines in the wall. Therefore, we
refine these edges and use them to separate the wall
segments.
6.1 Geometry Optimization
As mentioned, we utilize the horizontal sides of de-
tected elements to estimate vanishing points in order
to separate drywall segments. However, these de-
tected elements often exhibit irregularities along their
borders. Therefore, we have implemented an algo-
rithm that simplifies and optimizes these shapes.
The algorithm takes the polygons representing the
outlines of the detected elements and finds 4 corner
candidates for each by iteratively adding contiguous
vertices to a set until they cannot accurately be fit
by a straight line. It then uses RANSAC (Fischler
and Bolles, 1981) to fit lines through the vertices be-
tween the candidates, minimizing the impact of out-
liers. Thus, we obtain accurate 4-sided polygons rep-
resenting the detected elements.
To further increase accuracy, we leverage prior
knowledge of drywall structure. Specifically, neigh-
boring elements share sides and are often arranged in
rows or columns with edges aligned along the same
horizontal or vertical line. We group these aligned
edges and, for each group, we collect their endpoints
and apply RANSAC to fit a line through them. The
original edges are then replaced with the newly cal-
culated lines. Finally, we calculate the intersection
points of updated sides with the other sides to form
the refined polygons.
6.2 Clustering of Wall Segments
In this section, we describe our method for estimating
vanishing points for individual drywall segments us-
ing the horizontal edges of optimized polygons. By
identifying these points, we can assign each element
to its corresponding drywall segment, thereby cluster-
ing distinct drywall segments within a single image.
Depending on their angles with respect to the cam-
era position, wall segments will have different vanish-
ing points where the horizontal lines converge. Iden-
Automatic Drywall Analysis for Progress Tracking and Quality Control in Construction
711

tifying these points enables us to determine the edges
that align with them and correctly associate poly-
gons with their respective wall segments. To achieve
this, we divide the elements in the image into vertical
columns. Within each column, we collect the edges
that lie fully or partially within it and calculate their
pairwise intersections, which allows us to determine
a vanishing point for each column sequentially.
If neighboring columns share the same vanish-
ing point, they belong to the same segment. Con-
versely, if two adjacent columns have different van-
ishing points, the boundary between wall segments
lies between them. In cases where two segments con-
verge within a single column, the intersection points
of the edges within it are scattered across a larger area
instead of being concentrated in one location. There-
fore, if we detect such a case, we divide the column
into smaller parts and repeat the vanishing point cal-
culation for each.
6.3 Perspective Correction
As the last step of the proposed drywall analysis, we
obtain orthographic projections of each drywall seg-
ment, opening up new possibilities for automating
progress monitoring and quality control. To achieve
this, we first estimate the perspective of each individ-
ual wall segment, then correct it to remove perspec-
tive distortions.
Most drywall elements and the walls themselves
are rectangular and approximately axis-aligned within
the same plane. As a result, the perspective distortion
affecting the entire wall segment, as well as the trans-
formation necessary to correct it, is approximately the
same for the individual elements that are part of it.
Therefore, a simple approach to obtaining the seg-
ment’s orthographic projection is to obtain this of one
of its constituting elements, which can be done by cal-
culating the homography that maps it to a rectangular,
axis-aligned box. This method is, however, quite sen-
sitive to small inaccuracies and limits imposed by fi-
nite resolution, especially so when the chosen element
does not cover a big portion of the wall’s surface.
In order to tackle this, it is possible to combine the
transformations calculated for each of the elements
belonging to the wall segment. To this end, we find
the wall’s corners within the orthographic projection
calculated for each element and project them back to
the original image. Then, we use RANSAC to calcu-
late the average position for each corner minimizing
the effect of outliers. Finding the corners of the wall
in an orthographic projection is a straightforward pro-
cess: the minimum and maximum values along the X
and Y axis of its constituting elements correspond to
the limits of its bounding-box, which is axis-aligned.
Once the four corners of the wall are calculated for
the original image, a homography transformation can
be calculated to obtain its orthographic projection.
7 RESULTS
In this section, we present the results of our method,
structured into two subsections: one in which we dis-
cuss the performance of the instance segmentation
module, and one in which we discuss this of the wall
analysis module. In the former, the effectiveness of
the modifications made to the Mask R-CNN model
and the impact of data augmentation on its accuracy
will be reviewed. In the latter, we demonstrate the
outcomes of each post-processing step applied during
the wall analysis.
7.1 Instance Segmentation
In this subsection, a comparison of performance be-
tween different backbone choices for the Mask R-
CNN model will be briefly discussed. Based on this,
the one offering best results (ConvNeXt V2) is chosen
as a baseline, against which we evaluate the impact of
each proposed modification to the network architec-
ture, as well as the data augmentation methods. This
evaluation is conducted at both the quantitative and
qualitative levels.
7.1.1 Quantitative Evaluation
For quantitative evaluation, we use mean average pre-
cision (mAP), a common metric for instance segmen-
tation models. Specifically, we apply mAP@0.5:0.95,
which computes mAP across intersection over union
(IoU) thresholds from 0.5 to 0.95 in increments of
0.05 and then averages the results. The IoU threshold
is used to decide whether a detection is true positive
(TP) of false positive (FP). If IoU between the ground
truth and detected object is smaller than the thresh-
old, it is considered as FP, otherwise TP. We provide
mAP for both bounding boxes (bbox mAP) and in-
stance masks (mask mAP).
Table 1 provides an overview of the accuracy
of Mask R-CNN with different backbones on our
dataset. All backbones were pretrained on the COCO
dataset. Among the various backbone architectures,
ConvNeXt V2 clearly yields the best results, which is
why we chose it as a baseline for our method.
Table 2 shows how the proposed model modifi-
cations and data augmentation techniques influenced
accuracy compared to the baseline. All models were
VISAPP 2025 - 20th International Conference on Computer Vision Theory and Applications
712
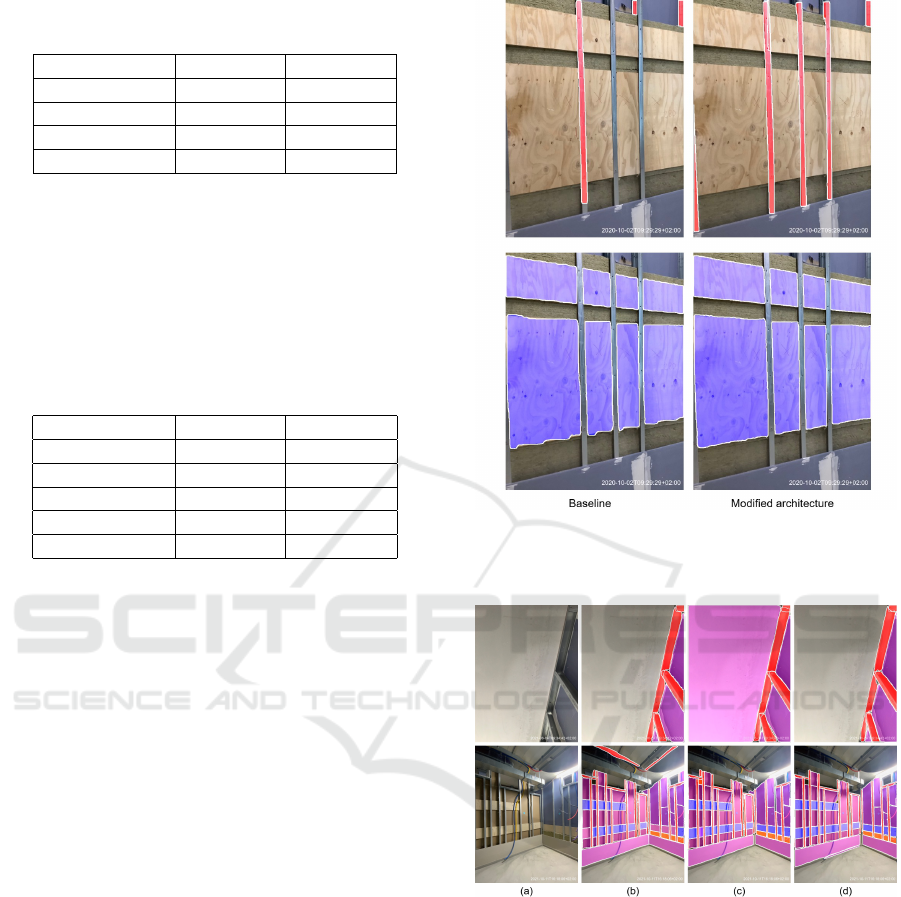
Table 1: Accuracy results for Mask R-CNN with different
backbones on our dataset.
Backbone bbox mAP mask mAP
FPN 0.47 0.45
Swin 0.40 0.39
ResNest 0.40 0.40
ConvNeXt V2 0.55 0.52
Table 2: Evaluation results of Mask R-CNN models with
various modifications and data augmentation strategies.
Here, B represents the baseline model; EB extends the base-
line by adding additional anchor ratios and increasing out-
put mask sizes through deconvolution; CB incorporates data
augmentation by blending objects onto COCO dataset back-
grounds; RB employs data augmentation with room-interior
backgrounds; RP uses data augmentation with randomized
placement, and SP data augmentation with structured place-
ment.
Model bbox mAP mask mAP
B 0.55 0.52
EB 0.57 0.54
EB + CB + RP 0.62 0.58
EB + CB + SP 0.63 0.59
EB + RB + SP 0.64 0.60
trained for 60 epochs with early stopping and Con-
vNeXt V2 backbone. The initial learning rate was set
to 0.02 and decreased by a factor of 10 at the 50th and
55th epochs. We used a weight decay of 0.001 and a
momentum of 0.9.
Adding aspect ratios for anchor boxes to improve
narrow frame detection, as well as increasing the in-
stance mask output size, led to a slight improvement
in the accuracy of both bounding box and instance
mask detections. However, the most significant im-
provement was achieved by incorporating syntheti-
cally created images to the training as data augmen-
tation. The base synthetic generation method, as de-
scribed in (Cambeiro Barreiro et al., 2022), improved
bbox mAP by approximately 5% and mask mAP by
around 4% on top of the improvements achieved by
the modified baseline with only basic augmentation
techniques. Further accuracy gains were obtained by
using synthetic backgrounds that more closely resem-
ble the scenes from the original images, and replac-
ing the random placement of cropped elements with
a structured arrangement that imitates actual drywall
patterns. These enhancements, combining realistic
synthetic backgrounds with a more natural arrange-
ment of elements, enabled the model to produce more
accurate instance masks and achieve increase recall.
Figure 4: Visual comparison of detected metal frames (first
row, in red) and wood panels (second row, in blue) by the
baseline model and the modified architecture.
Figure 5: Instance segmentation results using different data
augmentation techniques. Column (a) shows the original
image, (b) the baseline output, (c) the baseline with data
augmentation using COCO backgrounds and random place-
ment, and (d) the baseline with data augmentation using
room-interior backgrounds and structured placement. De-
tected wall panels are shown in pink, wood panels in blue,
insulation in orange, and metal frames in red.
7.1.2 Qualitative Evaluation
The impact of the proposed architecture modifications
is reflected in the quantitative results. However, this
impact is even more evident when we compare the
instance masks produced by the baseline model and
its improved version. A visual comparison is shown
Automatic Drywall Analysis for Progress Tracking and Quality Control in Construction
713
in Figure 4. The addition of extra aspect ratios to
generate anchor boxes more suitable for narrow metal
frames was essential in improving the recall for this
class. On the other hand, we can see that for the base-
line model with masks at 28×28 pixels, visible arti-
facts appear along the borders of detected elements.
Increasing the instance mask output size to 56×56
pixels through deconvolution resolved this issue, as
the detected polygons no longer exhibit the “stair-
case” effect seen in the figure. This is particularly rel-
evant for a clear element edge determination, which
is vital to the accuracy of our wall analysis algorithm.
Figure 5 illustrates the influence of data augmen-
tation on instance detection using the baseline model.
Overall, the baseline model delivers strong detection
results, accurately identifying most elements within
the drywall with only a few misclassifications. More-
over, it can even distinguish between adjacent wall
panels with minimal, barely visible borders.
The model trained with data augmentation, nev-
ertheless, detects fewer false positives and shows
fewer mismatched class labels compared to the model
trained without augmentation. However, the augmen-
tation method that creates new images by randomly
placing elements onto COCO backgrounds disrupts
the characteristic structure of drywalls. As a result,
some elements that clearly do not belong to any wall
segment (i.e. those outside the segment borders) may
be falsely identified as drywall elements. This hap-
pens because the model learns that some elements can
appear randomly distributed across the entire image.
Our modified augmentation approach addresses this
issue by teaching the model that drywall elements are
typically surrounded by other components following
a certain structure, e.g., insulation is always placed
between metal frames.
7.2 Drywall Analysis
For the evaluation of the proposed drywall analysis
process, we focus on the qualitative results that allow
us to estimate the viability of this method for practi-
cal applications, such as progress tracking and quality
control. To this end, we include visualizations of the
results of the most important steps and provide a dis-
cussion of the findings.
As shown in Figure 6, our polygon refinement
technique significantly enhances the accuracy and
consistency of the outlines of detected elements.
The horizontal edges of these polygons are precisely
aligned with each other and with the intersecting hor-
izontal lines that converge at the corresponding van-
ishing point. This alignment greatly improves the es-
timation of vanishing points in the subsequent steps.
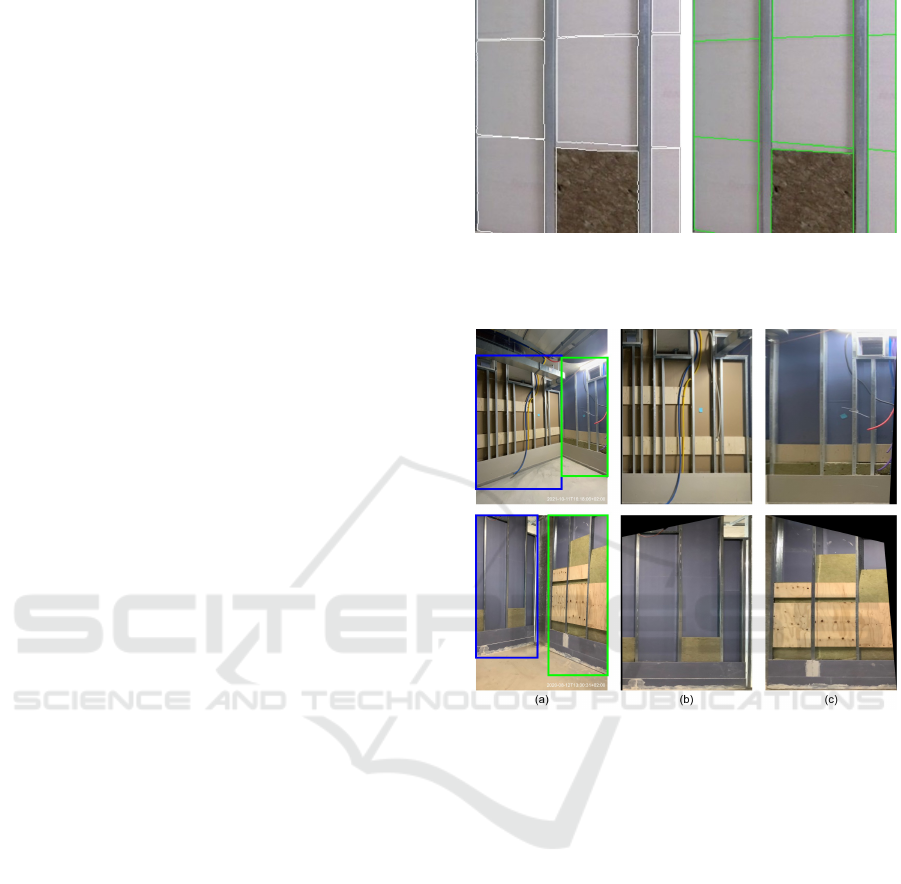
Figure 6: Results of the group refinement of simplified
polygons. Borders of the detected wall panels are shown
in white, and optimized polygons in green.
Figure 7: Visualization of our drywall segment clustering
and perspective correction results. Column (a) displays
the original images with two bounding boxes in blue and
green indicating the different wall segments. Column (b)
shows the undistorted view of left segments, while column
(c) shows this of right segments.
With accurately estimated polygons, we can suc-
cessfully apply our drywall segment clustering and
perspective correction algorithms. Figure 7 shows ex-
amples from our dataset with two visible wall seg-
ments. In both cases, we successfully identified the
borders between segments, estimated perspective dis-
tortions, and corrected them. The resulting projec-
tions show elements that are parallel to each other,
creating new opportunities for analyzing individual
drywall elements and their relationships, which is cru-
cial for progress and quality analysis.
8 DISCUSSION
Our model demonstrates robust instance segmenta-
tion performance on our dataset. Additionally, the
VISAPP 2025 - 20th International Conference on Computer Vision Theory and Applications
714
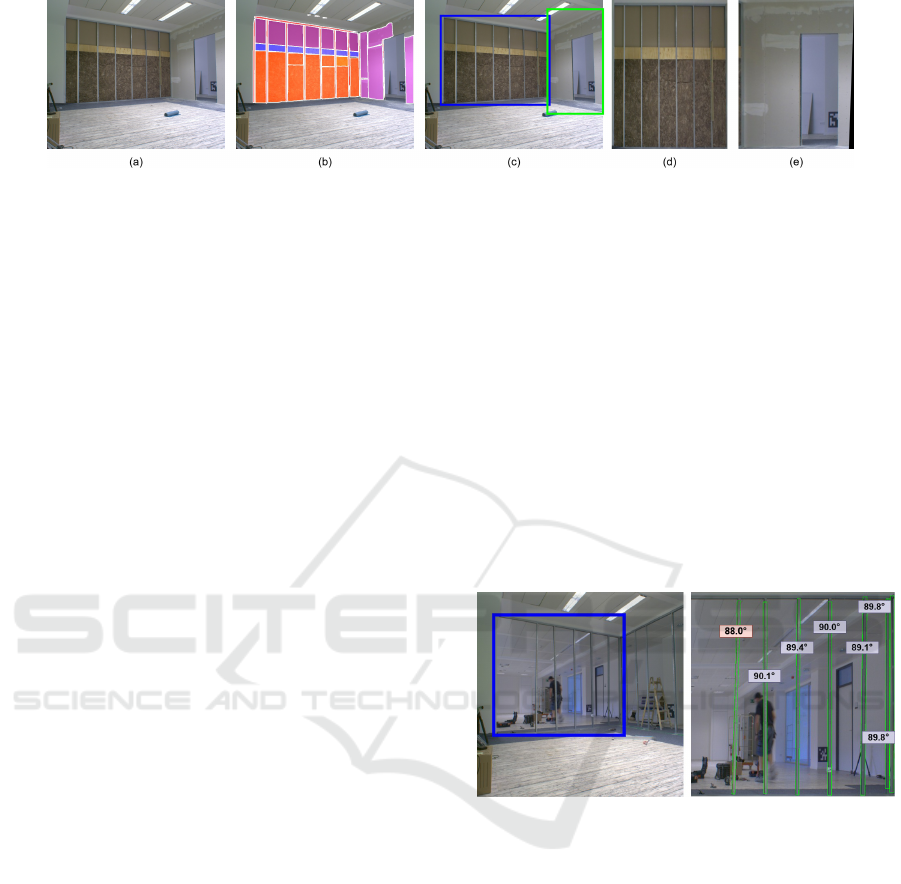
Figure 8: Visualization of the complete instance segmentation and wall analysis pipeline on new data. In this example: (a)
shows the original image, (b) displays the instance segmentation output, (c) illustrates the bounding boxes of the two wall
segments, and (d) and (e) present the segments with corrected perspective distortions.
proposed wall analysis method successfully isolates
individual drywall segments and corrects their per-
spective distortions. However, the limited number of
testing images in the dataset poses challenges in fully
assessing the system’s generalization capabilities. To
address this, we captured the construction process of
a drywall structure to create a new room by installing
on-site cameras at fixed locations. We then applied
the entire pipeline to these new images representing
different stages of construction captured from differ-
ent points of view. Figure 8 offers a visualization of
the results for one of these images.
We observe that our model not only successfully
detects and classifies most drywall elements but also
effectively uses this information to separate the two
wall segments present in the image and obtain their
orthographic projections. This demonstrates that our
proposed instance segmentation model and analysis
algorithm generalize well to data the model has never
encountered before, and it would be viable to use our
system in real construction projects to automate data
collection.
Compared to (Wei et al., 2022; Ekanayake et al.,
2024), our segmentation model not only detects more
types of drywall elements but also distinguishes indi-
vidual elements and estimates their precise location in
the image. Combined with our drywall analysis mod-
ule, it enables a more comprehensive progress esti-
mation than simply classifying walls as “finished” or
“not finished.” Compared to (Chauhan and Sepp
¨
anen,
2023), our method successfully detects metal frames
and includes insulation detection, offering more de-
tailed information on the drywall construction pro-
cess.
Figure 8 illustrates the results of our pipeline ap-
plied to a frame of our recorded drywall construc-
tion process. Utilizing a calibrated camera with
known positioning, the extracted information is di-
rectly mapped to a corresponding wall in a digital
model, automating status updates. Furthermore, the
pipeline effectively detects individual elements within
each wall segment with high accuracy. This data, such
as the surface area covered by insulation, can then be
compared against digital model plans to evaluate con-
struction progress and ensure compliance with project
specifications.
To demonstrate a practical application of our wall
analysis method for quality assessment, we analyzed
an image showing only metal frames, as seen in Fig-
ure 9. We generated an orthographic view of a spe-
cific wall segment from the image. Using this view,
we estimated the orientation of the metal frames. This
anaylsis revewaled that one of the frames exhibited a
tilt exceeding 1
◦
(highlighted in red). Based on this
information a warning can be issued, enabling correc-
tive action to be taken before further progress is made
in the wall construction process.
Figure 9: An example of a quality assurance use case em-
ploying the proposed method. The left image shows the
segment under analysis highlighted in blue. The right im-
age illustrates the detected vertical metal frames in green,
along with their angles (in degrees).
9 CONCLUSIONS
In this paper, we present an automated pipeline for
drywall analysis using on-site cameras, combining
a deep learning instance segmentation module with
an analysis module for extracting valuable informa-
tion to create rich digital models for progress track-
ing and quality control. We enhanced a standard neu-
ral network architecture and developed targeted data
augmentation to improve segmentation performance
with limited training data. Additionally, we intro-
duced a novel algorithm to extract useful information
Automatic Drywall Analysis for Progress Tracking and Quality Control in Construction
715

from the segmentation results, to support automatic
progress tracking and quality control, as shown in real
construction-site applications. Our method provides
more detailed information than existing state-of-the-
art approaches, and we demonstrate generalization to
scenes outside the training dataset, showcasing its po-
tential to boost productivity, planning accuracy, and
regulatory compliance in the construction industry.
ACKNOWLEDGEMENTS
This work has partly been funded by the German
Federal Ministry for Digital and Transport (project
EConoM under grant number 19OI22009C). We
thank HOCHTIEF ViCon GmbH for providing train-
ing images of construction sites.
REFERENCES
Bayer, H. and Aziz, A. (2022). Object detection of fire
safety equipment in images and videos using yolov5
neural network. In Proceedings of 33. Forum Bauin-
formatik.
Cambeiro Barreiro, A., Seibold, C., Hilsmann, A., and Eis-
ert, P. (2022). Automated damage inspection of power
transmission towers from uav images. In Proceed-
ings of the International Joint Conference on Com-
puter Vision, Imaging and Computer Graphics Theory
and Applications, volume 5.
Cambeiro Barreiro, A., Trzeciakiewicz, M., Hilsmann, A.,
and Eisert, P. (2023). Automatic reconstruction of se-
mantic 3d models from 2d floor plans. In 2023 18th
International Conference on Machine Vision and Ap-
plications (MVA), pages 1–5. IEEE.
Chauhan, I. and Sepp
¨
anen, O. (2023). Automatic indoor
construction progress monitoring: challenges and so-
lutions. In EC3 Conference 2023, volume 4, pages 0–
0. European Council on Computing in Construction.
Dalva, Y., Pehlivan, H., Altindis, S. F., and Dundar, A.
(2023). Benchmarking the robustness of instance seg-
mentation models. IEEE Transactions on Neural Net-
works and Learning Systems.
Ekanayake, B., Fini, A. A. F., Wong, J. K. W., and Smith,
P. (2024). A deep learning-based approach to facili-
tate the as-built state recognition of indoor construc-
tion works. Construction Innovation, 24.
Ekanayake, B., Wong, J. K.-W., Fini, A. A. F., and Smith,
P. (2021). Computer vision-based interior construc-
tion progress monitoring: A literature review and fu-
ture research directions. Automation in construction,
127:103705.
Fischler, M. A. and Bolles, R. C. (1981). Random sample
consensus: a paradigm for model fitting with appli-
cations to image analysis and automated cartography.
Communications of the ACM, 24(6):381–395.
Gard, N., Hilsmann, A., and Eisert, P. (2024). Spvloc: Se-
mantic panoramic viewport matching for 6d camera
localization in unseen environments. In Proc. Euro-
pean Conf. on Computer Vision (ECCV).
He, K., Gkioxari, G., Doll
´
ar, P., and Girshick, R. (2017).
Mask r-cnn. In 2017 IEEE International Conference
on Computer Vision (ICCV), pages 2980–2988.
Kalervo, A., Ylioinas, J., H
¨
aiki
¨
o, M., Karhu, A., and Kan-
nala, J. (2019). Cubicasa5k: A dataset and an im-
proved multi-task model for floorplan image analy-
sis. In Image Analysis: 21st Scandinavian Confer-
ence, SCIA 2019, Norrk
¨
oping, Sweden, June 11–13,
2019, Proceedings 21, pages 28–40. Springer.
Lin, T.-Y., Maire, M., Belongie, S., Hays, J., Perona, P., Ra-
manan, D., Doll
´
ar, P., and Zitnick, C. L. (2014). Mi-
crosoft COCO: Common objects in context. In Fleet,
D., Pajdla, T., Schiele, B., and Tuytelaars, T., edi-
tors, Computer Vision – ECCV 2014, pages 740–755.
Springer International Publishing.
Lv, X., Zhao, S., Yu, X., and Zhao, B. (2021). Residential
floor plan recognition and reconstruction. In Proceed-
ings of the IEEE/CVF Conference on Computer Vision
and Pattern Recognition, pages 16717–16726.
Pal, A., Lin, J. J., Hsieh, S.-H., and Golparvar-Fard,
M. (2023). Automated vision-based construction
progress monitoring in built environment through dig-
ital twin. Developments in the Built Environment,
page 100247.
Research (2023). room-interior dataset. https://universe.
roboflow.com/research-twzom/room-interior. visited
on 2024-11-06.
Sch
¨
onfelder, P. and K
¨
onig, M. (2022). Deep learning-based
text detection on architectural floor plan images. In
IOP Conference Series: Earth and Environmental Sci-
ence, volume 1101.
Shamsollahi, D., Moselhi, O., and Khorasani, K. (2021). A
timely object recognition method for construction us-
ing the mask r-cnn architecture. In Proceedings of the
International Symposium on Automation and Robotics
in Construction, volume 2021-November.
Wei, W., Lu, Y., Zhong, T., Li, P., and Liu, B. (2022). In-
tegrated vision-based automated progress monitoring
of indoor construction using mask region-based con-
volutional neural networks and bim. Automation in
Construction, 140.
Woo, S., Debnath, S., Hu, R., Chen, X., Liu, Z., Kweon,
I. S., and Xie, S. (2023). Convnext v2: Co-designing
and scaling convnets with masked autoencoders. In
Proc. IEEE Conference on Computer Vision and Pat-
tern Recognition (CVPR).
Ying, H. Q. and Lee, S. (2019). A mask r-cnn based ap-
proach to automatically construct as-is ifc bim objects
from digital images. In Proceedings of the 36th Inter-
national Symposium on Automation and Robotics in
Construction, ISARC 2019.
Zhao, X. and Cheah, C. C. (2023). Bim-based indoor mo-
bile robot initialization for construction automation
using object detection. Automation in Construction,
146:104647.
VISAPP 2025 - 20th International Conference on Computer Vision Theory and Applications
716
