
A Framework for Reproducible Parallel DNA String Matching
Ricardo Regis Cavalcante Chaves
a
and Alba Cristina Magalhaes Alves de Melo
b
Dep. of Computer Science, Campus Universitario Darcy Ribeiro, University of Brasilia, Brasilia, Brazil
Keywords:
Reproducibility, Approximate String Matching, Parallel Sequence Comparison.
Abstract:
In this paper, we propose an output reproducible framework that executes parallel sequence comparison algo-
rithms, computing the edit distance. The framework generates tables/graphics and linear regressions that can
be used to predict the execution times. We also propose parallel OpenMP versions of serial algorithms (DP
and UK) used to compute the edit distance. Our parallel DP is antidiagonal block-based, where the blocks that
belong to the same set of antidiagonals are assigned to different threads, which compute them simultaneously.
Due to data dependencies presented by UK, we opted to compute each antidiagonal in parallel. Our results
with synthetic and real sequences show that the parallel UK version presents the best execution times in most
cases. We also show that the linear regressions generated by our tool have errors below 10%, on average.
1 INTRODUCTION
Even though reproducibility is a key concept in sci-
ence, it is often neglected. According to (Gundersen,
2021), there are three different types of reproducibil-
ity: (a) outcome: the outcome of the reproducibility
experiment is the same as the output of the original
experiment; (b) analysis: the outputs are not the same
but the same analysis can be made; (c) interpretation:
neither the outputs nor the analyses are the same but
the same conclusion can be reached. Recently, a lot of
effort has been made in reproducibility, since it has a
direct impact on the results’ reliability. Besides being
able to reproduce results, other functionalities are im-
portant, such as expressiveness and prediction (Wrat-
ten et al., 2021). We claim that scientific experiments
should be at least outcome reproducible, with tools
that provide ease of use and expressiveness.
The growth of massive amounts of biological data
has created an increasing demand for tools to assist
researchers in analyzing these data. The use of these
computational tools can improve confidence in pub-
lished results, allow double-checking them by other
researchers, and facilitate redoing the entire experi-
ment. Therefore, in order to ease replication efforts,
there is a need for more openly available tools.
There are many bioinformatics frameworks avail-
able, such as Bioconductor (Huber et al., 2015),
Galaxy (Price et al., 2024), and Biopython (Cock
a
https://orcid.org/0000-0002-5910-8716
b
https://orcid.org/0000-0001-5191-5209
et al., 2009). Although these frameworks have a set
of features like maturity, extensibility and high mod-
ularity, they are not focused on parallel algorithms. In
particular, Bioconductor is a widely used framework
for the analysis of high-throughput genomic data and
it is based on the R programming language. Galaxy
is a web-based platform for managing bioinformatics
workflows with great focus on training and education.
Biopython is a set of tools for biological computation
written in Python to interact with biological databases
and integrate with other bioinformatics tools.
In order to generate results easily and make the
execution of experiments reproducible, we designed
a reproducible framework that executes a given algo-
rithm multiple times, varying the parameters required
by the execution scenarios. At the end of the exe-
cution, the framework generates several graphics and
presents them to the user. Besides that, the tool has
a module that generates linear regressions, which can
be used for execution time prediction.
As a case study, we chose the Approximate String
Matching (ASM) problem. ASM computes the simi-
larity degree between two strings, where a high sim-
ilarity degree means very few differences (Hall and
Dowling, 1980). For ASM, the most widely used met-
ric is the edit distance or Levenshtein distance (Leven-
shtein, 1966), which determines the minimum num-
ber of operations needed to transform one string into
another. Since the 1970s, the ASM problem is for-
mulated as dynamic programming (DP) (Wagner and
Fischer, 1974; Sellers, 1974) and this is the most used
Chaves, R. R. C. and Alves de Melo, A. C. M.
A Framework for Reproducible Parallel DNA String Matching.
DOI: 10.5220/0013302600003911
Paper published under CC license (CC BY-NC-ND 4.0)
In Proceedings of the 18th International Joint Conference on Biomedical Engineering Systems and Technologies (BIOSTEC 2025) - Volume 1, pages 661-668
ISBN: 978-989-758-731-3; ISSN: 2184-4305
Proceedings Copyright © 2025 by SCITEPRESS – Science and Technology Publications, Lda.
661

approach (Berger et al., 2021). In this case, a DP ma-
trix is computed with size n × m, where n and m are
the lengths of the sequences.
In this paper, we deal with unrestricted ASM al-
gorithms, which do not restrict the problem to a max-
imum error k nor do not limit the size of one of the
strings. The algorithms considered are DP (Wagner
and Fischer, 1974) and UK (Ukkonen, 1983). In par-
ticular, UK is an algorithm with pruning, i.e., it does
not compute the entire DP matrix in most cases. In
practice, string matching has many applications be-
yond text search such as: computational biology, pat-
tern recognition, computer vision, among others. In
this paper, we will focus on computational biology.
Sequence alignment algorithms, such as Smith-
Waterman and Needleman-Wunsch, are also used in
many tools (Figueiredo et al., 2021; Schmidt et al.,
2024) and they compute differently the DP matrix.
Even though there are widely used, they are outside
the scope of this paper.
We propose a reproducibility framework and par-
allel implementations for the algorithms DP and UK,
using the OpenMP programming interface. Parallel
DP is a block-based approach which always computes
the entire DP matrix. Parallel UK has pruning ca-
pabilities computing, on the average case, much less
than DP.
Our results show that, depending on the dissim-
ilarity between the sequences and their lengths, one
algorithm performs better than the other. For the syn-
thetic sequences compared, Parallel UK performed
better in most cases. For the real SARS-CoV-2 DNA
sequences case study, Parallel UK also performed bet-
ter than DP in most comparisons. This happened be-
cause the sequences have low dissimilarity and are
considerably long.
The remainder of this paper is organized as fol-
lows. Section 2 presents the ASM problem and the
DP and UK algorithms used to solve it. Section 3
presents the design of our reproducible framework
and the parallel algorithms integrated to it. Section
4, experimental results are presented for synthetic se-
quences and real SARS-CoV-2 DNA sequences. Fi-
nally, Section 5 concludes the paper.
2 APPROXIMATE STRING
MATCHING (ASM)
2.1 Overview
String matching is a classical problem involving
strings that searches for occurrences of a pattern P in
a text T (Navarro, 2001). Exact string matching finds
the exact pattern P in text T whereas Approximate
String Matching is an approach of finding strings that
match P approximately, i.e., allowing errors.
For ASM, the alphabet is defined as a finite set
of symbols (characters) and represented by Σ, where
|Σ| denotes the length of the alphabet. For compar-
ing DNA sequences, the alphabet is Σ = {A, T, G,C}
and |Σ| = 4. For computational biology ASM applica-
tions, the term sequence is used instead of string and
the character that occurs in position i of T (or P) is
denoted by T
i
(or P
i
).
The goal of ASM is to find approximate occur-
rences (matchings) of P (called P
′
) in T when a cer-
tain tolerance is allowed and a degree of similarity is
enough to satisfy the match (P ≈ P
′
).
ASM algorithms use a distance function d(T, P),
for measuring the similarity of two strings (Navarro,
2001). One of the most widely used distance func-
tions is the edit distance or Levenshtein distance (Lev-
enshtein, 1966). The metric ed(T, P) computes the
minimal number of operations that are executed in P
in order to obtain P = P
′
. The operations are: (i) in-
sertion, when P
′
i
has an extra character, i.e. P
i
= ε,
where ε corresponds to the empty string; (ii) deletion,
when P has an extra character, i.e. P
′
i
= ε; (iii) substi-
tution, when P
i
and P
′
i
have different characters.
C
T T
A
G
T
0 0
0 0 0 0 0
C
1
0
1 1 1 1 1
T
2 1
0
1 2 2 1
A
3
2 1 1 1 2 2
C
4
3
2 2 2 2
3
T
5
4
3
2
3 3
2
(a)
-2 -1
0
1 2
3
-4
9∞ 9∞ 9∞ 9∞ 9∞
3
-3
9∞ 9∞ 9∞ 9∞
2
-2
9∞ 9∞ 9∞
1
5
-1
9∞ 9∞
0 3
4
0
9∞
-1 2
3
4
1
9∞ 9∞
-1
3 5
2
9∞ 9∞ 9∞
-1
3
3
9∞ 9∞ 9∞ 9∞
-1
4
9∞ 9∞ 9∞ 9∞ 9∞
-1
e
d
(b)
Figure 1: (a) DP matrix with edit distance highlighted at
bottom-right corner and (b) UK matrix with edit distance
highlighted at row n − m.
2.2 Algorithm DP (Wagner & Fischer
1974)
The DP algorithm (Wagner and Fischer, 1974) is
based on dynamic programming (DP). It compares
two strings T and P with m and n characters, respec-
tively, by computing a DP matrix C of size (m + 1,
n + 1). To create the DP matrix, the first DP cell is set
to zero (C
0,0
= 0). Then, the cells which belong to the
BIOINFORMATICS 2025 - 16th International Conference on Bioinformatics Models, Methods and Algorithms
662

first row are initialized with column index ( j) and the
cells belonging to the first column are initialized with
(i). The remaining values are calculated with Equa-
tion 1. Time complexity of DP is O(mn). In the case
of a match (i.e., the characters T
i
and P
j
, are the same)
δ(x
i
, y
i
) = 0; and δ(x
i
, y
i
) = 1, otherwise.
C
i, j
= min
C
i−1, j−1
+ δ(x
i
, y
i
),
C
i−1, j
+ 1
C
i, j−1
+ 1
(1)
Figure 1(a) presents matrix C produced by Algo-
rithm DP when comparing strings T = CT TAGT and
P = CTACT . In this case, the edit distance is 2.
2.3 Algorithm UK (Ukkonen, 1983)
Ukkonen’s algorithm (Ukkonen, 1983) (UK) is based
on theoretical properties of the DP matrix computa-
tion when the metric used is edit distance. Ukkonen
noticed that the diagonals values of the DP matrix in-
crease monotonically from the upper-left to the lower-
right cells, i.e., the values of adjacent cells can differ
at most by one: 0 ≤ C
i, j
−C
i−1, j−1
≤ 1.
Hence, in his algorithm a new matrix L is build
based on this property since it is only necessary to
store the information about the position of the diag-
onal where the value is incremented. L(d, e) is cal-
culated, where d corresponds to the diagonal and e is
the edit distance computed so far, i. e., the maximum
row number of the DP matrix where the value e oc-
curs in a given diagonal d. In the initialization step,
L(d,|d|−1) = |d|−1 when d < 0, L(d, |d|− 1) = −1
when d ≥ 0 and L(d, e) = −∞ when e < d. The
remaining values of L are calculated after obtaining
the maximum of the three previously defined values
(upper-left diagonal, left and bottom-left diagonal el-
ements) and then increasing the value while a match
occurs between T
i
and P
j
. Time complexity of UK is
O(ed(T, P).min(m, n)), where ed is the edit distance
between T and P.
Figure 1(b) presents the L matrix for comparing
strings T = CT TAGT and P = CTACT . In this case,
the edit distance is 2, i.e., the row where the maximum
value (5) occurs in matrix C.
3 REPRODUCIBILITY
FRAMEWORK
In Section 3.1 we propose our reproducibility frame-
work to execute the parallel algorithms. Sections 3.2
and 3.3 describe the parallel versions.
seqfile
Execution
Module
Raw Output
Data
Import
Module
Data
Preprocessing
Module
Data
Visualization
Module
Linear
Regression
Module
Data
Export
Module
Figure 2: Reproducibility Framework.
3.1 Reproducibility Framework
We designed a reproducibility framework that auto-
matically executes the experiments, collects the re-
sults and runs statistical analysis. The framework
was developed using IPython Notebook (P
´
erez and
Granger, 2007), a computational workbook environ-
ment for running Python. Furthermore, it provides
features such as the ability to run code in a cell-by-cell
basis and a collection of libraries. In particular, we
make use of the Numerical Python library (NumPy)
and the Matplotlib library.
In order to start the framework execution (Figure
2), a text file containing a list of FASTA files to be
compared (seqfile) and a set of parameters should be
provided as input for the execution module.
As input parameters, the Execution Module (Al-
gorithm 1) receives (a) the names of files containing
all pairs of sequences to be compared (seqfile); (b) the
algorithm (DP, UK or both); (c) the number of threads
(may be a range); (d) the number of repetitions for
each execution; and (e) the block size, needed for
running parallel DP. Every time the execution mod-
ule runs the algorithm, the output is appended to an
output file. The details of how the algorithms are ex-
ecuted are shown in Algorithm 1 and a sample seqfile
can be seen in Table 1.
Algorithm 1: Execution module pseudocode.
1: for 1 to THREAD QUANTITY do
2: for each SEQFILE do
3: Create temporary output directory
4: for each SEQUENCE PAIR do
5: for each ALGORITHM do
6: Create the output file
7: for 1 to REPEATS do
8: Execute algorithm
9: Append the output to file
10: end for
11: end for
12: end for
13: end for
14: end for
The Data Import Module reads the output files in
A Framework for Reproducible Parallel DNA String Matching
663

Table 1: A seqfile consists of a list of pairs of FASTA files
containning the sequences to be compared.
”./data/NC 045512.2.fasta” , ”./data/OP537480.1.fasta”
”./data/NC 045512.2.fasta” , ”./data/OP809597.1.fasta”
”./data/NC 045512.2.fasta” , ”./data/OP883605.1.fasta”
”./data/NC 045512.2.fasta” , ”./data/OQ026463.1.fasta”
”./data/NC 045512.2.fasta” , ”./data/OQ050253.1.fasta”
raw format from the Execution Module and parses
them to a structured format. This module is also re-
sponsible to detect errors in the output files such as
missing values or inconsistent data due possible file
corruption, i.e., it is important to ensure the correct-
ness of the data before proceeding to the next steps.
In the Data Preprocessing Module, the framework
performs operations such as: filtering, to remove data
that is not relevant for the analysis; splitting, to sep-
arate the data in different categories; and grouping,
to organize and summarize sets of data. These opera-
tions are necessary to help the user to identify patterns
and trends in the data.
The Data Visualization Module generates compar-
ison tables and heatmaps from the processed data.
Heatmaps are useful to visualize the execution times
of the algorithms, where the color intensity is pro-
portional to the execution time. A table can be con-
structed using colors to identify and categorize data
with particular properties.
The linear regression models calculated with the
data collected in the experiments can help to predict
the execution times of future experiments. Besides
the regression equation, it also outputs other statistical
measures, such as the p-value, the standard error of
the estimate, and the R
2
coefficient of determination.
The Data Export Module saves the processed data
in human friendly formats. In addition to CVS, it is
also possible to export in LaTex and Excel formats.
These formats can be easily imported into other tools
for further analysis.
3.2 Parallel DP Design
In the DP algorithm (Section 2.2), the dependencies
for cell (i, j) are (i − 1, j − 1), (i, j − 1) and (i − 1, j)
(Equation 1). So, all elements of antidiagonal d may
be computed in parallel, as soon as antidiagonal d − 1
is computed. However, depending on the size of the
matrix, the parallelism obtained when computing the
antidiagonalis in parallel may be small. In order to
increase the parallelism, we use a block-based ap-
proach, which considers blocks of antidiagonals. In
this case, each thread computes a block sequentially,
in parallel with the other threads (Figure 3a).
The DP matrix is divided into blocks of cells and
each block is assigned to a thread. When a thread
1
2
2
3
3
3
4
4
5
(a) Parallel DP (b) Parallel UK
Figure 3: (a) Parallel DP: blocks are computed by anti-
diagonal, but each block submatrix is computed sequen-
tially. (b) Parallel UK: the cells of each column are com-
puted in parallel.
finishes to compute a blocked antidiagonal, the last
row and the last column of each block are used as
initial values to the computation of the next antidiag-
onal. Since the blocks are computed in an antidiago-
nal fashion, the first block to be computed is the one
in the upper-left corner of the matrix (antidiagonal 1)
and the last one is the one in the lower-right corner
(antidiagonal 5).
Algorithm 2: Parallel DP pseudocode.
1: do in parallel num threads
2: initialize DP matrix
3: split DP matrix in blocks
4: do in parallel num threads
5: for each tile do
6: execute dp in block
7: end for
8: return score
Algorithm 2 presents Parallel DP. In the initializa-
tion phase (lines 1-2), the OpenMP directive PARAL-
LEL FOR is used to parallelize the loops that initialize
the DP matrix. In the execution phase (lines 3-7), the
DP matrix is divided into square blocks of specified
size and then the inner loop (lines 5-6) is responsible
to compute each block among the threads using the
recurrence relation shown in Equation 1.
3.3 Parallel UK Design
In Parallel UK, we opted to compute each row in the
L matrix in parallel, since cells ranging from −e ≤
d ≤ +e can be calculated independently. This hap-
pens because, in UK, the computation of each cell de-
pends on the values of three cells from the previous
column: upper-left cell, left cell and bottom-left cell
(Figure 3b).
Algorithm 3 presents Parallel UK. Lines 1-2 ini-
tialize the UK matrix in parallel by filling the upper
and lower diagonals of the triangular shaped matrix.
Lines 3-11 show the execution loop, executed in par-
allel with num threads until the algorithm reaches a
BIOINFORMATICS 2025 - 16th International Conference on Bioinformatics Models, Methods and Algorithms
664

Algorithm 3: Parallel UK pseudocode.
1: do in parallel num threads
2: initialize UK matrix
3: do in parallel num threads
4: for each column e do
5: for each row d do
6: calculate column d, e
7: if score is found then break
8: end for
9: end for
10: return score
stop condition (line 7). Line 10 returns the calculated
score.
4 EXPERIMENTAL RESULTS
Parallel DP (Section 3.2) and Parallel UK (Sections
3.3) were implemented in C++ and OpenMP 5.3,
compiled with the GNU g++ compiler version 11.3.0
with no optmization flag. The reproducibility frame-
work was implemented in Python. Our experiments
were collected in a desktop with an Intel Core i5-8400
Coffee Lake 2.8GHz (6 cores) with 32GB of RAM
running Ubuntu Linux 22.04. In the experiments, we
used synthetic and real DNA sequences.
Table 2: Execution times (ms) for synthetic sequences (se-
rial).
SERIAL EXEC TIME (ms)
SIZE 1000 5000 10000 30000
DISS DP UK DP UK DP UK DP UK
0 16.35 0.03 401.70 0.22 1606.58 0.46 14469.48 2.44
10 18.16 0.97 443.95 23.33 1763.24 93.47 15864.51 945.74
20 19.71 2.50 482.17 61.64 1917.30 263.00 17374.97 2633.44
30 21.05 4.48 519.32 119.76 2075.56 499.06 18674.96 5081.58
40 23.08 7.00 569.53 190.72 2244.12 793.45 20205.88 8291.49
50 25.10 10.02 595.86 285.13 2394.99 1154.82 21417.63 12258.71
60 26.64 13.59 608.32 391.16 2401.68 1608.85 21651.17 17578.00
70 25.20 17.94 589.80 513.59 2358.90 2116.55 21421.84 25229.88
80 23.38 21.99 581.76 639.51 2323.62 2642.07 20930.05 33539.03
90 24.46 26.31 573.97 750.47 2296.81 3130.46 20650.92 44322.13
100 23.35 31.92 567.29 874.63 2269.18 3697.26 20419.64 56972.07
Table 3: Execution times (ms) for synthetic sequences using
6 threads.
PARALLEL EXEC TIME (ms)
SIZE 1000 5000 10000 30000
DISS DP UK DP UK DP UK DP UK
0 4.22 0.19 79.65 0.41 307.39 0.65 2732.26 1.36
10 4.59 0.59 86.80 7.59 335.41 27.34 2990.96 238.81
20 4.97 1.07 93.82 16.58 363.25 63.09 3239.56 578.72
30 5.31 1.63 100.42 27.48 388.80 106.05 3474.35 1080.48
40 5.58 2.19 106.04 39.89 411.19 157.17 3690.27 1695.99
50 5.83 3.14 110.58 62.48 429.37 252.04 3838.69 2893.79
60 5.98 3.89 113.86 76.36 441.89 312.80 3962.96 3591.24
70 6.14 4.76 115.74 98.63 448.95 418.16 4032.16 5153.66
80 6.10 5.58 116.14 117.35 451.16 508.86 4057.45 6837.91
90 6.96 6.11 116.07 129.09 450.75 562.42 4065.38 8749.73
100 6.21 7.09 115.98 148.71 449.58 643.70 4060.20 11281.79
4.1 Results with Synthetic Sequences
The synthetic sequences were generated using ‘A’
characters as the reference text and sequences with
random replacements by the character ‘.’, depending
on the chosen dissimilarity. We generated sequences
of the following lengths: 1000, 2000, 5000, 10000,
and 30000 characters, increasing the dissimilarity be-
tween them varying from 0% (identical sequences)
to 100% (totally different sequences). Each experi-
ment was executed n times, depending in the value
provided in for the script’s input parameter (Section
3.1).
The results from the experiments conducted us-
ing synthetic sequences can be seen in Tables 2 and
3, with the heatmaps generated by our reproducibility
tool. The tables present (a) the dissimilarity between
the sequences, and (b) the total time (sum of initial-
ization time and execution time) for each comparison
as a result of running serial and parallel versions, re-
spectively.
In this case, by analyzing the execution times, we
were able to split them into two zones where the col-
ors indicate the performance of one algorithm in re-
lation to the other: (a) the green zone, where UK had
better performance than DP; and (b) the yellow zone,
where DP had better performance than UK. Consid-
ering the comparison between DP and UK, the se-
rial and parallel versions present similar behavior. It
can be seen that UK outperforms DP in most of the
comparisons, achieving the best execution time for se-
quences with dissimilarity ≤ 60%.
Figure 4 presents the graphic of execution time
generated by our framework.
The speedup achieved by parallel DP and parallel
UK is shown in Table 4. The speedup is calculated as
the ratio between the execution time of the serial im-
plementation and the parallel one, with 6 threads (one
thread running on each CPU core). It can be seen that
Parallel UK has low speedup with 0% dissimilarity.
This happens because the serial execution time is very
low (e.g. 0.03ms for sequences of size 1000). On the
other cases, very good speedups are obtained for both
Parallel DP and Parallel UK.
4.2 Linear Regression Analysis
The prediction of the execution time of parallel se-
quence comparison applications is very important,
specially when a great number of comparisons need to
be made. In this context, our reproducible tool gener-
ates linear regressions that can be used for execution
time prediction.
A Framework for Reproducible Parallel DNA String Matching
665
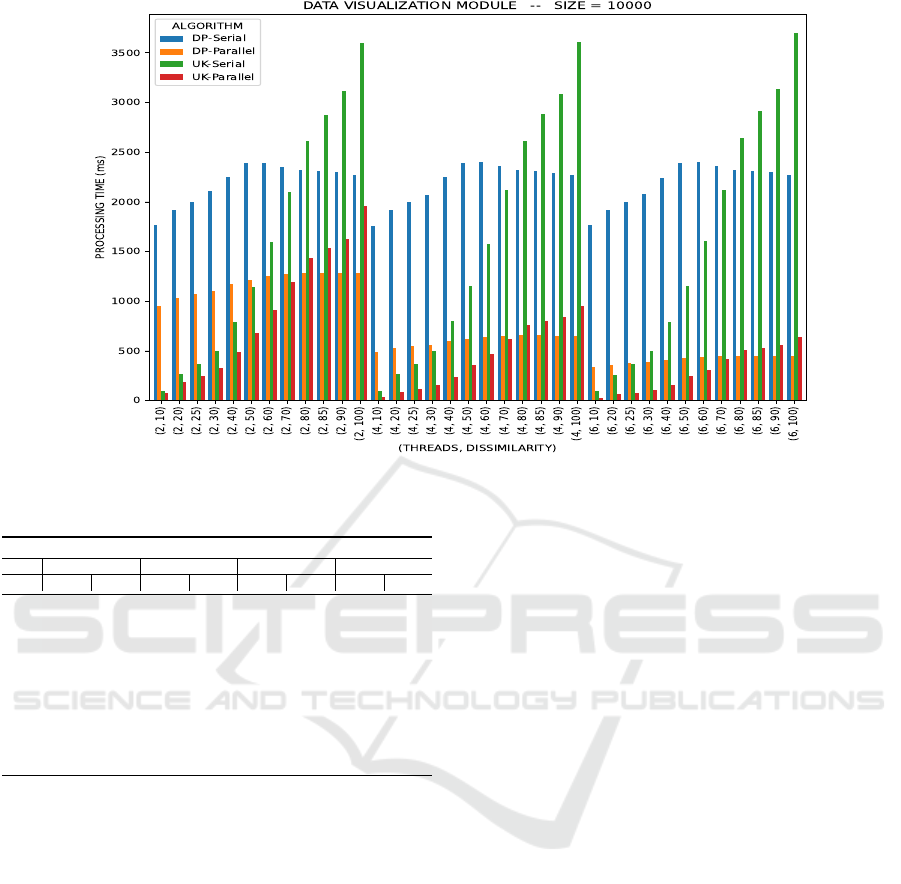
Figure 4: Execution times (ms) for comparing sequences of size 10000.
Table 4: Speedups for synthetic sequences.
SPEED-UP (SERIAL/PARALLEL)
SIZE 1000 5000 10000 30000
DISS DP UK DP UK DP UK DP UK
0 3.87× 0.16× 5.04× 0.54× 5.23× 0.71× 5.30× 1.79×
10 3.96× 1.64× 5.11× 3.07× 5.26× 3.42× 5.30× 3.96×
20 3.97× 2.34× 5.14× 3.72× 5.28× 4.17× 5.36× 4.55×
30 3.96× 2.75× 5.17× 4.36× 5.34× 4.71× 5.38× 4.70×
40 4.14× 3.20× 5.37× 4.78× 5.46× 5.05× 5.48× 4.89×
50 4.31× 3.19× 5.39× 4.56× 5.58× 4.58× 5.58× 4.24×
60 4.45× 3.49× 5.34× 5.12× 5.44× 5.14× 5.46× 4.89×
70 4.10× 3.77× 5.10× 5.21× 5.25× 5.06× 5.31× 4.90×
80 3.83× 3.94× 5.01× 5.45× 5.15× 5.19× 5.16× 4.90×
90 3.51× 4.31× 4.95× 5.81× 5.10× 5.57× 5.08× 5.07×
100 3.76× 4.50× 4.89× 5.88× 5.05× 5.74× 5.03× 5.05×
We opted to use multilinear regression models to
empirically estimate the execution time for differ-
ent input sizes, dissimilarity values and number of
threads, as shown in Equation 2.
ln(TIME) = a + b
1
× ln(SIZE)
+ b
2
× DISS
+ b
3
× THREADS
(2)
where TIME is the dependent variable that corre-
sponds to the execution time (ms), a is the y-intersect,
b
i
are the regression coefficients, and the independent
variables are the SIZE (input size), DISS (dissimilar-
ity value in percentage), and THREADS (number of
threads used in the execution).
This linear regression model was used for the se-
rial and parallel versions of DP and UK. In each case,
the training used 77% of the data and the testing was
made with the remaining 23%. For training, we have
used pre-defined lengths for input sizes (1000, 2000,
10000, 30000), dissimilarity values (10%, 20%, 30%,
40%, 50%, 60%, 70%, 80%, 90%, 100%), and num-
ber of threads (2, 4, 6). For prediction, we have used
the same values for number of threads (2, 4, 6), with
lengths 2500, 7500, 15000, 25000 for for input sizes
and values 25%, 45% and 85% for dissimilarity.
For the DP algorithm, the execution time was pre-
dicted using the following linear regression equations:
• Serial DP linear regression:
ln(y) = 2.97 + 1.99 × ln(SIZE) + 0.25 × DISS;
R
2
= 0.999
• Parallel DP linear regression:
ln(y) = 2.85 + 1.94 × ln(SIZE) + 0.32 × DISS
−0.24 × THREADS;
R
2
= 0.998
Table 5 presents the DP prediction results for 2,
4, 6 threads (TH), with sequence lengths 2500 and
15000 and dissimilarities 25%, 45% and 85%. In the
table, the lowest error is marked in bold and the high-
est error is underlined. It can be seen that our equa-
tions provide a quite accurate prediction, with all er-
rors below 15%. For the serial DP, most of the errors
are below 5% whereas most errors for parallel DP are
below 10%.
The execution time of the UK algorithm was pre-
dicted using the following linear regression equations:
• Serial UK linear regression:
ln(y) = 0.05 + 2.10 × ln(SIZE) + 3.81 × DISS;
R
2
= 0.987
• Parallel UK linear regression:
ln(y) = 0.45 + 2.02 × ln(SIZE) + 3.30 × DISS
−0.25 × THREADS;
R
2
= 0.987
BIOINFORMATICS 2025 - 16th International Conference on Bioinformatics Models, Methods and Algorithms
666

Table 5: Execution time prediction (ms) for DP.
TH. SIZE DISS
SERIAL PARALLEL
Real Predicted Error Real Predicted Error
2 2500 25% 125.08 126.92 1.47% 68.08 67.41 -0.98%
2 2500 45% 145.98 133.97 -8.23% 76.17 72.00 -5.47%
2 2500 85% 144.33 149.27 3.42% 81.26 82.13 1.07%
2 15000 25% 4485.88 4526.52 0.91% 2405.02 2241.57 -6.80%
2 15000 45% 5236.91 4778.10 -8.76% 2693.74 2394.09 -11.12%
2 15000 85% 5195.09 5323.97 2.48% 2912.31 2730.98 -6.23%
4 2500 25% 125.18 126.96 1.42% 36.25 40.88 12.77%
4 2500 45% 145.38 134.02 -7.81% 40.59 43.66 7.56%
4 2500 85% 144.28 149.33 3.50% 43.38 49.80 14.80%
4 15000 25% 4490.28 4528.18 0.84% 1222.05 1359.22 11.22%
4 15000 45% 5230.59 4779.85 -8.62% 1369.06 1451.71 6.04%
4 15000 85% 5256.54 5325.93 1.32% 1477.64 1655.99 12.07%
6 2500 25% 125.22 127.01 1.43% 26.25 24.79 -5.56%
6 2500 45% 145.48 134.07 -7.84% 29.29 26.47 -9.63%
6 2500 85% 144.43 149.38 3.43% 31.25 30.20 -3.36%
6 15000 25% 4540.56 4529.84 -0.24% 838.69 824.19 -1.73%
6 15000 45% 5231.09 4781.60 -8.59% 939.34 880.27 -6.29%
6 15000 85% 5230.48 5327.88 1.86% 1010.59 1004.14 -0.64%
Table 6: Execution time prediction (ms) for UK.
TH. SIZE DISS
SERIAL PARALLEL
Real Predicted Error Real Predicted Error
2 2500 25% 21.22 18.09 -14.75% 15.27 13.16 -13.82%
2 2500 45% 55.73 39.06 -29.91% 33.39 25.78 -22.79%
2 2500 85% 166.35 182.16 9.50% 86.49 98.97 14.43%
2 15000 25% 843.43 774.32 -8.19% 582.23 503.82 -13.47%
2 15000 45% 2203.47 1672.17 -24.11% 1339.80 987.14 -26.32%
2 15000 85% 6544.81 7798.35 19.15% 3522.62 3789.56 7.58%
4 2500 25% 20.87 18.09 -13.32% 8.17 7.95 -2.69%
4 2500 45% 53.78 39.06 -27.37% 17.45 15.57 -10.77%
4 2500 85% 168.21 182.15 8.29% 44.72 59.78 33.68%
4 15000 25% 845.73 774.28 -8.45% 276.61 304.32 10.02%
4 15000 45% 2239.91 1672.09 -25.35% 660.38 596.26 -9.71%
4 15000 85% 6513.57 7797.98 19.72% 1847.55 2288.98 23.89%
6 2500 25% 20.71 18.09 -12.65% 5.97 4.80 -19.60%
6 2500 45% 53.65 39.06 -27.19% 12.56 9.41 -25.08%
6 2500 85% 165.15 182.14 10.29% 31.94 36.11 13.06%
6 15000 25% 848.75 774.24 -8.78% 183.68 183.81 0.07%
6 15000 45% 2191.20 1672.01 -23.69% 431.14 360.15 -16.47%
6 15000 85% 6677.75 7797.61 16.77% 1264.54 1382.59 9.34%
Table 6 presents the prediction results for UK us-
ing 2, 4, 6 threads, with sequence lengths 2500 and
15000 and dissimilarities 25%, 45% and 85%. It
can be seen that, on average, the prediction errors
are higher for UK than DP, both in the serial and in
the parallel versions. This happens because UK has
pruning capability and the number of cells computed
depends on the dissimilarity between the sequences,
leading to a more complex behavior. For this rea-
son, we consider that a maximum error of 33.68% is
a good result, considering that most errors for UK are
below 20%.
4.3 Real DNA Sequences: Covid-19
Case Study
We also conducted a set of experiments using
real DNA sequences publicly available at the Na-
tional Center for Biotechnology Information (NCBI),
https://www.ncbi.nlm.nih.gov/. For the first set of
experiments, we chose sequences from variants of
SARS-CoV-2 (lengths ∼ 29900) all over the world
were compared to the reference sequence SARS-
CoV-2 isolate Wuhan-Hu-1 (length = 29903) using
parallel DP and Parallel UK. The dissimilarity is ob-
tained by dividing the edit distance by the length of
the sequence. Values in bold highlight the best execu-
tion time for each comparison (Table 7).
Table 7: Execution times (ms) for the SARS-CoV-2 case
study. The dissimilarity is the result of dividing edit dis-
tance value by the length of the sequence.
COUNTRY DISS
EDIT
DIST.
TIME(ms)
DP UK
SERIAL PARAL. SERIAL PARAL.
Japan 7.11% 2082 20490.47 3992.93 224.02 40.03
Chile 0.64% 192 20768.15 4042.56 3.99 1.90
Australia 0.52% 156 20916.51 4036.69 3.34 1.76
France 0.7% 208 20749.34 4031.12 4.23 2.01
UK 0.44% 130 20786.62 4038.58 3.11 1.67
Canada 17.44% 5184 20659.38 4056.76 1311.57 231.02
Russia 0.83% 246 20724.72 4032.93 4.81 2.20
South Africa 0.54% 161 20732.42 4057.27 3.48 1.79
Libya 0.81% 242 20747.39 4043.30 4.68 2.18
India 1.02% 305 20779.65 4073.30 6.11 2.51
USA 0.76% 226 20808.56 4039.60 4.72 2.08
The results in Table 7 show Serial DP as the
algorithm with the worst performance among all
SARS-CoV-2 comparisons while Serial UK is no-
ticeably better. The high values of some edit dis-
tances – the case of Canada (OQ305820.1) and Japan
(LC753266.1) – is due to the presence of some long
chains of ‘N’ characters in their DNA sequences indi-
cating the impossibility of a correct identification of
some parts of it. In all cases, Parallel UK performed
much better than Parallel DP.
It is possible to make a linking between the real
DNA sequences with the 30K-character-length syn-
thetic sequences from Tables 2 and 3. For the covid-
19 case study, the sequence sizes are about 30000. We
can see that all dissimilarities are below 20% and that
Serial and Parallel UK behaved much better than Se-
rial and Parallel DP. This is consistent with the result
obtained with the comparison of synthetic sequences
with length equal to 30000. Therefore, for SARS-
CoV-2 sequence comparisons, Parallel UK is the best
choice, particularly because hundreds or even thou-
sands of those sequences of SARS-Cov-2 are com-
pared in a unique biological study (Uraki, 2023; Teylo
et al., 2021; Hidalgo et al., 2022).
5 CONCLUSION
In this paper, we proposed a reproducible framework
to execute parallel sequence comparison algorithms.
Besides producing reproducible outputs, our frame-
work also generates linear regressions with the output
data, which are able to estimate the execution time of
future executions.
A Framework for Reproducible Parallel DNA String Matching
667

The use of the framework allowed us to automate
several repeatable tasks that are time consuming and
prone to errors, such as executing the algorithms with
correct parameters (Execution Module), collecting re-
sults from each execution (Data Import Module), pro-
cessing these results (Data Preprocessing Module),
generation of graphics (Data Visualization Module),
statistical analysis and linear regressions (Linear Re-
gression Module), and the data exporting to other for-
mats (Data Export Module). Furthermore, the modu-
lar design of the framework also allowed an easy in-
tegration of new algorithms.
Hence, OpenMP versions of two dynamic pro-
gramming algorithms (DP and UK) to compute the
edit distance between strings were also proposed and
evaluated. These algorithms were implemented in
C++ and executed in a multicore machine using the
proposed framework.
Our results with synthetic and real DNA se-
quences whose sizes ranged from 1000 to 30000 show
that our parallel versions are able to obtain very good
speedups (up to 5.88x, with 6 threads). Also, we show
that Parallel UK is the best choice for the majority of
the tests, producing the smallest execution time for
the synthetic and real sequences. Moreover, we show
that our framework generates automatically graphics,
simplifying the task of running experiments, and that
the linear regressions obtained with the framework
have very good statistical relevance (R
2
≥ 9.87), gen-
erating accurate execution time predictions.
As future work, we want to expand the linear re-
gression module of our framework, including addi-
tional plugins with machine learning strategies. In
addition, we want to incorporate other parallel ver-
sions of biological sequence comparison algorithms
for local and global alignment, such as MASA-
OpenCL (de Figueiredo Jr. et al., 2019), to our frame-
work. Finally, we intend to create a new module, that
will connect to the Data Export Module and use the
alignments produced by the executions in more com-
plex problems, such as Multiple Sequence Alignment.
REFERENCES
Berger, B., Waterman, M. S., and Yu, Y. W. (2021). Leven-
shtein distance, sequence comparison and biological
database search. IEEE Transactions on Information
Theory, 67(6):3287–3294.
Cock, P. J. A., Antao, T., Chang, J. T., Chapman, B. A., Cox,
C. J., Dalke, A., Friedberg, I., Hamelryck, T., Kauff,
F., Wilczynski, B., and de Hoon, M. J. L. (2009).
Biopython: freely available Python tools for compu-
tational molecular biology and bioinformatics. Bioin-
formatics, 25(11):1422–1423.
de Figueiredo Jr., M. A. C., de Oliveira Sandes, E. F., Ro-
drigues, G. N., Teodoro, G. L. M., and de Melo, A.
C. M. A. (2019). Masa-opencl: Parallel pruned com-
parison of long dna sequences with opencl. Con-
currency and Computation: Practice and Experience,
31(11):e5039. e5039 cpe.5039.
Figueiredo, M., Navarro, J. P., Sandes, E. F. O., Teodoro,
G., and Melo, A. C. M. A. (2021). Parallel fine-
grained comparison of long dna sequences in homo-
geneous and heterogeneous gpu platforms with prun-
ing. IEEE Transactions on Parallel and Distributed
Systems, 32(12):3053–3065.
Gundersen, O. (2021). The fundamental principles of repro-
ducibility. Philosophical Trans. of the Royal Society,
379:1–15.
Hall, P. A. V. and Dowling, G. R. (1980). Approx-
imate string matching. ACM Computing Surveys,
12(4):381–402.
Hidalgo, R., DeVito, A., Salah, N., S., V. A., and Mered-
ith, R. W. (2022). Inferring phylogenetic relationships
using the smith-waterman algorithm and hierarchical
clustering. In IEEE International Conference on Big
Data, pages 5910–5914. IEEE.
Huber, W., Carey, V. J., Gentleman, R., et al. (2015).
Orchestrating high-throughput genomic analysis with
bioconductor. Nature Methods, 12(2):115–121.
Levenshtein, V. I. (1966). Binary codes capable of correct-
ing deletions, insertions, and reversals. Soviet Physics
Doklady, 10:707–710.
Navarro, G. (2001). A guided tour to approximate string
matching. ACM Computing Surveys, 33(1):31–88.
Price, G., Nekrutenko, A., Gr
¨
uning, B. A., and Schatz,
M. C. (2024). The Galaxy platform for accessible,
reproducible, and collaborative data analyses: 2024
update. Nucleic Acids Research, 52(W1):W83–W94.
P
´
erez, F. and Granger, B. E. (2007). Ipython: A system for
interactive scientific computing. Computing in Sci-
ence & Engineering, 9(3):21–29.
Schmidt, B., Kallenborn, F., Chacon, A., and Hundt,
C. (2024). CUDASW++4.0: ultra-fast GPU-based
Smith-Waterman protein sequence database search.
BMC Bioinformatics, 25(1):342.
Sellers, P. (1974). On the theory and computation of evo-
lutionary distances. SIAM Journal of Applied Mathe-
matics, 26:787–793.
Teylo, L., Nunes, A. L., Melo, A. C. M. A., Boeres, C.,
Drummond, L. M. A., and Martins, N. F. (2021).
Comparing sars-cov-2 sequences using a commercial
cloud with a spot instance based dynamic scheduler.
In IEEE/ACM International Symposium on Cluster,
Cloud and Internet Computing, pages 24–256. IEEE.
Ukkonen, E. (1983). On approximate string matching. In
International Conference on Fundamentals of Com-
putation Theory, pages 487–495. Springer.
Uraki, R. e. a. (2023). Characterization of sars-cov-2 omi-
cron ba.2.75 clinical isolates. Nature Communica-
tions, 14(1):1620.
Wagner, R. A. and Fischer, M. (1974). The string-to-string
correction problem. Journal of the ACM, 1:168–173.
Wratten, L., Wilm, A., and Goke, J. (2021). Reproducible,
scalable, and shareable analysis pipelines with bioin-
formatics workflow managers. Nature Methods,
18:1161–1168.
BIOINFORMATICS 2025 - 16th International Conference on Bioinformatics Models, Methods and Algorithms
668
