
Enhanced Predictive Clustering of User Profiles: A Model for Classifying
Individuals Based on Email Interaction and Behavioral Patterns
Peter Wafik
1 a
, Alessio Botta
3 b
, Luigi Gallo
3 c
, Gennaro Esposito Mocerino
3 d
,
Cornelia Herbert
2 e
, Ivan Annicchiarico
2
, Alia El Bolock
1 f
and Slim Abdennadher
1 g
1
Department of Informatics and Computer Science, German International University, Cairo, Egypt
2
Department of Applied Emotion and Motivation Psychology, Ulm University, Ulm, Germany
3
Department of Electrical Engineering and Information Technologies, University of Napoli Federico II, Naples, Italy
fi
Keywords:
Clustering, Predictive Clustering, Deep Learning, Neural Networks, Behavioral Analysis, Personalized
Content Delivery, Social Engineering.
Abstract:
This study introduces a predictive framework to address a gap in user profiling, integrating advanced cluster-
ing, dimensionality reduction, and deep learning techniques to analyze the relationship between user profiles
and email phishing susceptibility. Using data from the Spamley platform (Gallo et al., 2024), the proposed
framework combines deep clustering and predictive models, achieving a Silhouette Score of 0.83, a Davies-
Bouldin Index of 0.42, and a Calinski-Harabasz Index of 1676.2 with k-means and Self-Organizing Maps
(SOM) for clustering user profiles. The results further highlight the effectiveness of Linear Support Vector
Machines (SVM) and neural network models in classifying cluster membership, providing valuable decision-
making insights. These findings demonstrate the efficacy of advanced non-linear methods for clustering com-
plex user profile features, as well as the overall success of the semi-supervised model in enhancing clustering
accuracy and predictive performance. The framework lays a strong foundation for future research on tailored
anti-phishing strategies and enhancing user resilience.
1 INTRODUCTION
The rise of digital communication, particularly via
email, has created an expansive pool of data that of-
fers rich opportunities to understand user behavior.
Previous research suggests that email interactions are
not only a means of communication, but also reflect
individual characteristics, preferences, and cognitive
vulnerabilities and therefore pose a major challenge
to privacy protection. This also applies to the tac-
tics used in email phishing attacks (Lawson et al.,
2020). The exploitation of email as a medium for
phishing attacks has grown alarmingly sophisticated,
underscoring the need for user-centric defenses. Ad-
a
https://orcid.org/0009-0002-6151-6775
b
https://orcid.org/0000-0002-3365-1446
c
https://orcid.org/0000-0001-8770-9773
d
https://orcid.org/0009-0009-0655-2280
e
https://orcid.org/0000-0002-9652-5586
f
https://orcid.org/0000-0002-5841-1692
g
https://orcid.org/0000-0003-1817-1855
dressing this challenge demands a deeper understand-
ing of both technical patterns and human behaviors
(Gallo et al., 2024). Traditional methods of phish-
ing detection, predominantly focus on binary out-
comes—predicting whether an individual will fall
victim to an attack—while overlooking the broader
potential of human profiling (Kim and Cho, 2024).
These approaches often fail to account for the psy-
chological and behavioral dimensions that influence
user decisions, such as impulsivity, risk perception,
and trust dynamics. Such traits are critical for un-
derstanding how users interact with digital content
and for developing tailored defenses against phish-
ing attacks (Van Der Heijden and Allodi, 2019; Allodi
et al., 2019).
This study addresses these limitations by intro-
ducing a novel predictive framework combining deep
learning with behavioral analysis. By relating email
interaction patterns to psychological traits, the frame-
work holistically analyzes user profiles to predict per-
sonalized email characteristics. This enables the cre-
ation of customized email structure elements aligned
Wafik, P., Botta, A., Gallo, L., Mocerino, G. E., Herbert, C., Annicchiarico, I., El Bolock, A. and Abdennadher, S.
Enhanced Predictive Clustering of User Profiles: A Model for Classifying Individuals Based on Email Interaction and Behavioral Patterns.
DOI: 10.5220/0013302800003899
In Proceedings of the 11th International Conference on Information Systems Security and Privacy (ICISSP 2025) - Volume 2, pages 363-374
ISBN: 978-989-758-735-1; ISSN: 2184-4356
Copyright © 2025 by Paper published under CC license (CC BY-NC-ND 4.0)
363

with user-specific traits, advancing personalized con-
tent delivery and mitigating phishing risks.
This research aims to bridge the gap between tra-
ditional binary phishing detection models and the un-
tapped potential of comprehensive human profiling.
By identifying the interplay between email traits and
user profiles, the proposed framework seeks to en-
hance phishing prevention strategies. Positioned at
the intersection of psychology, machine learning, and
cybersecurity, this study introduces a scalable and
innovative solution to modern challenges in digital
communication, paving the way for more adaptive
and user-centric defenses.
The remainder of the paper is structured as fol-
lows: Section 2 discusses the background and related
work, emphasizing the role of human factors in phish-
ing and clustering methodologies. Section 3 outlines
the proposed methodology, including dataset char-
acteristics, preprocessing, clustering, and prediction
models implemented. Section 4 presents the results,
followed by an in-depth discussion. Finally, Section 5
concludes with key findings and directions for future
research.
2 BACKGROUND AND RELATED
WORK
Phishing attacks have become increasingly sophisti-
cated over the past decade, posing significant chal-
lenges for cybersecurity. Despite the advancements in
detection technologies, phishing continues to exploit
psychological vulnerabilities, emphasizing the need
for solutions that address both technical and psycho-
logical aspects (Dhamija et al., 2006). This section
explores the evolution of phishing research, highlight-
ing the critical role of human factors and advance-
ments in technology to accommodate this which form
the foundation of this study.
2.1 Role of Human Factors in Phishing
Susceptibility
Phishing emails are crafted to exploit cognitive and
psychological vulnerabilities, making the human el-
ement a critical weakness in cybersecurity. Studies
have shown that individuals’ susceptibility to phish-
ing often depends on traits such as impulsivity, cu-
riosity, and risk perception (Van Der Heijden and
Allodi, 2019; Allodi et al., 2019). Research has
also linked personality traits, such as those from the
Big Five model, to phishing susceptibility (Parrish Jr
et al., 2009). Demographic factors like age and ed-
ucation, though less predictive, have been studied
to understand the broader landscape of vulnerabili-
ties (Dhamija et al., 2006). Tailored phishing attacks
leveraging persuasion principles, such as authority
and scarcity, further underscore the importance of
psychological factors (Cialdini and Cialdini, 2007).
This work builds on these insights by selecting
a dataset capable of capturing all of these traits and
cluster users based on their behavioral and cognitive
profiles. By correlating email traits with user re-
sponses, the study aims to predict phishing suscep-
tibility and inform tailored interventions.
2.2 Overview of Phishing Susceptibility
Based on User Profiles
Recent research on phishing susceptibility has fo-
cused on the impact of personality traits, cognitive
abilities, and online behaviors. Analyzing user pro-
files has been a key approach, though it faces chal-
lenges due to the lack of datasets specifically designed
for such studies (Wang et al., 2012). Despite this, no-
table studies have emerged to address this gap. For
instance, (Tornblad et al., 2021) identified 32 predic-
tors of phishing susceptibility, but noted that existing
models used limited predictors and lacked accuracy.
(Wang et al., 2012) proposed a high-accuracy ma-
chine learning model but relied on self-reported data
and missed dynamic phishing aspects. Similarly, (Al-
bladi and Weir, 2018) explored phishing susceptibil-
ity on social networks but insufficiently analyzed how
personality traits influence decision-making.
The mentioned studies, along with many others,
often rely on static, limited datasets and lack the inte-
gration of advanced deep profiling techniques. Future
research should seek to address these limitations by:
1. Expanding Dataset Scope: Utilizing datasets
covering diverse psychological and behavioral di-
mensions.
2. Applying Advanced Clustering Techniques:
Use deep clustering methods to identify complex
patterns in user behavior and susceptibility.
3. Conducting Comprehensive Analysis: Explore
the interplay between personality traits, cognitive
abilities, and online behaviors in greater depth.
Filling these gaps will enable the development of
more accurate and actionable models for predicting
and mitigating phishing risks, enhancing the effec-
tiveness of anti-phishing strategies.
ICISSP 2025 - 11th International Conference on Information Systems Security and Privacy
364
2.3 Clustering and Predictive
Algorithms for User Profiling
Clustering algorithms have long been used to clas-
sify individuals based on interaction patterns, cogni-
tive traits, and behavioral data. Techniques such as
k-means and hierarchical clustering have proven ef-
fective in identifying user groups, offering insights
that could be utilized for cybersecurity applications
(Chandola et al., 2009). For example, clustering
users by their susceptibility to phishing enables tar-
geted training and awareness programs. Building on
this foundation, this study employs advanced clus-
tering techniques to classify users and predict their
susceptibility to phishing attacks. By integrating be-
havioral and psychological traits, it offers a compre-
hensive perspective on user vulnerabilities, enabling
tailored interventions and strengthening cybersecurity
defenses.
2.4 Ethics Statement
This study complies with ethical standards for data
collection, processing, and analysis. The dataset,
obtained from the Spamley platform, was fully
anonymized to ensure participant privacy and confi-
dentiality. No personally identifiable information was
used, and all data handling adhered to GDPR and rele-
vant data protection laws (GDPR, 2016). The predic-
tive clustering framework developed in this research
is intended for ethical applications, such as enhanc-
ing personalized content delivery and improving cy-
bersecurity defenses. The model is specifically de-
signed to respect user privacy and avoid misuse, such
as unauthorized profiling or exploitation of sensitive
user traits. By focusing on anonymized and behav-
ioral insights, the framework provides actionable ben-
efits without compromising ethical principles. This
study emphasizes transparency and integrity in its
methodologies to ensure the responsible use of the
proposed model.
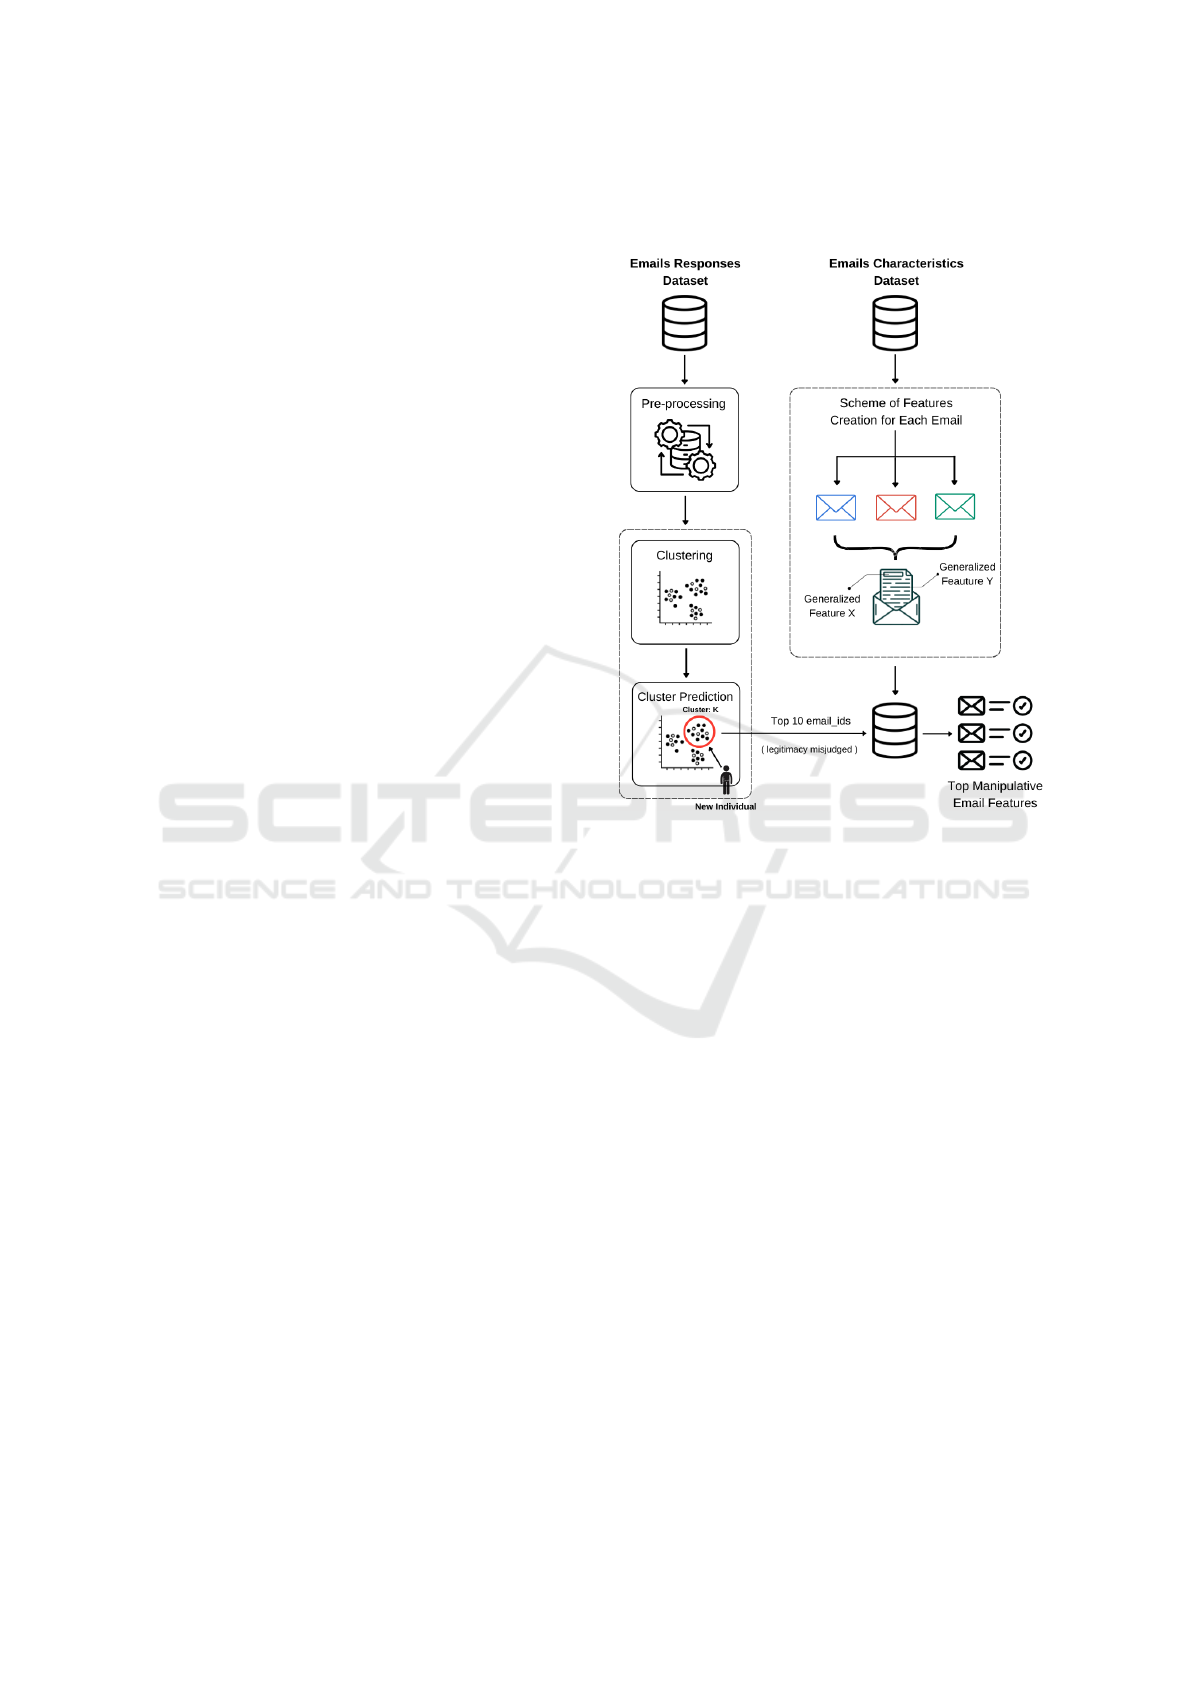
3 METHODOLOGY
The methodology employs a multi-stage process ap-
plied to the Spamley responses dataset. After pre-
processing, a clustering model classifies individuals
based on their profile, followed by a predictive model
to assign new individuals to the generated clusters.
Email traits, such as subject and body content, are
identified by analyzing top emails per cluster that in-
dividuals misjudged their legitimacy and replicating
their key features. Figure 1 outlines the Methodology
workflow.
Figure 1: Methodology Workflow.
3.1 Datasets
This study analyzes user responses to phishing emails
using datasets generated from the Spamley platform,
with a focus on behavioral patterns in assessing email
legitimacy. Two primary datasets were employed:
1. Emails Characteristics Dataset: This dataset in-
cludes 136 emails, equally split between phishing
and legitimate types, in both Italian and English,
sourced from actual inboxes. Each email is cat-
egorized by technical and psychological features,
such as subject, context, phishing links, and cog-
nitive manipulations like authority and scarcity
(Gallo et al., 2024). These features are docu-
mented in a standardized schema to allow consis-
tent reference.
2. Email Responses Dataset: A survey was com-
pleted by 1027 participants, with 731 valid re-
sponses after pre-processing. This dataset records
demographic information, internet habits, and
psychological traits, including Big Five personal-
ity traits and self-reported cognitive vulnerabili-
ties (Gallo et al., 2024). Participants subsequently
classified email legitimacy, with their responses
recorded for clustering analysis.
Enhanced Predictive Clustering of User Profiles: A Model for Classifying Individuals Based on Email Interaction and Behavioral Patterns
365

This approach enables robust analysis of the re-
lationship between user characteristics and phishing
susceptibility, offering valuable insights for design-
ing tailored cybersecurity interventions and aware-
ness programs (Gallo et al., 2024).
3.2 Data Pre-Processing
Effective data pre-processing is crucial for ensuring
the quality and consistency of datasets used in predic-
tive clustering. This stage ensures the data is clean,
structured, and ready for analysis, supporting the reli-
ability of clustering and predictive models (Kotsiantis
et al., 2006; Han et al., 2022). The following 7 pre-
processing steps were applied to the individuals’ re-
sponses dataset to prepare it for the clustering phase:
1. Addressing Missing and Irrelevant Data: Ini-
tial cleaning involved removing redundant meta-
columns (e.g., hash, first name, last name, etc..)
deemed irrelevant to the analysis. Completely
empty columns and rows with over 30% missing
values were also removed, adhering to best prac-
tices for handling incomplete data (Little and Ru-
bin, 2019).
2. Feature Engineering: A new column, result, was
created to quantify the number of emails correctly
identified as legitimate or phishing. This feature
provided additional insights into user behavior,
enhancing the dataset’s predictive power.
3. Feature Selection: To reduce dimensional-
ity, features that uniquely identify the individ-
ual’s biographic traits as well as their psycho-
logical and behavioral traits were selected, so
that the clustering would be built on diverse
meaningfully-related traits. The final retained
features include: computer science knowledge,
time on internet, educationField id as well as 27
other features all listed in Appendix A.
4. Outlier Detection and Treatment: Outliers were
identified using the interquartile range (IQR)
method (Aggarwal and Aggarwal, 2017). De-
pending on their relevance, outliers were either
corrected or removed, ensuring data consistency
and preventing skewed model performance.
5. Feature Normalization: Min-Max scaling was
applied to numerical features, standardizing them
to a uniform range. This step is critical for
distance-based clustering methods (Sammut and
Webb, 2011).
6. Encoding Categorical Variables: While most
categorical variables were already encoded in the
received dataset, label encoding was applied to
three remaining columns to prepare them for anal-
ysis (Pedregosa et al., 2011).
7. Handling Imbalanced Data: Imbalanced cate-
gorical columns were addressed by calculating
weights inversely proportional to the frequency of
each class. These weights emphasized minority
classes during model training without altering the
underlying data distribution.
These steps produced a clean and well-structured
dataset, ready to be utilized by clustering and predic-
tive clustering models and ensure robust and repro-
ducible results.
3.3 Clustering
This study adopts a quantitative methodology, em-
ploying clustering techniques to classify users based
on their email interaction characteristics. The objec-
tive is to develop a model that effectively groups in-
dividuals according to their traits and behavioral pat-
terns. Therefore, the dataset containing individuals’
responses was utilized to apply the clustering algo-
rithms on.
3.4 Clustering Evaluation Metrics
To ensure robust and reliable clustering results, this
study employed a diverse range of clustering evalua-
tion metrics. These metrics assess intra-cluster com-
pactness, inter-cluster separation, and overall topo-
logical accuracy, ensuring the validity of the clus-
tering results. The metrics include the Silhouette
Score, Davies-Bouldin Index, Calinski-Harabasz In-
dex, Quantization Error, Topographic Error, and Gap
Statistics. Each metric and its mathematical formula-
tion is described below.
Silhouette Score: evaluates the quality of cluster-
ing by comparing the average intra-cluster distance to
the mean nearest-cluster distance. It is defined as:
S(i) =
b(i) − a(i)
max(a(i),b(i))
, (1)
where a(i) is the mean distance between a data point
i and all other points in the same cluster, and b(i)
is the mean distance between i and all points in the
nearest neighboring cluster. The overall Silhouette
Score is the mean of S(i) for all data points. Higher
scores (closer to 1) indicate well-separated and com-
pact clusters (Rousseeuw, 1987).
Davies-Bouldin Index (DBI): quantifies the aver-
age similarity between each cluster and its most sim-
ilar cluster, where similarity is a ratio of intra-cluster
dispersion to inter-cluster separation. It is calculated
ICISSP 2025 - 11th International Conference on Information Systems Security and Privacy
366

as:
DBI =
1
k
k
∑
i=1
max
j̸=i
σ
i
+ σ
j
d(c
i
,c
j
)
, (2)
where σ
i
is the average distance of points in cluster
i to their centroid c
i
, and d(c
i
,c
j
) is the distance be-
tween centroids c
i
and c
j
. Lower DBI values indicate
better cluster separation (Davies and Bouldin, 1979).
Calinski-Harabasz Index: measures the ratio of
between-cluster dispersion to within-cluster disper-
sion. It is defined as:
CH =
trace(B
k
)/(k − 1)
trace(W
k
)/(n − k)
, (3)
where B
k
is the between-cluster scatter matrix, W
k
is
the within-cluster scatter matrix, k is the number of
clusters, and n is the number of data points. Higher
values indicate well-separated clusters (Calinski and
Harabasz, 1974).
Quantization Error: For Self-Organizing Maps
(SOMs), it measures the average distance between
each data point and its best matching unit (BMU) on
the Self-Organizing Map (SOM). It is calculated as:
QE =
1
N
N
∑
i=1
∥x
i
− m
BMU(i)
∥ (4)
where N is the number of data points, x
i
is a data
point, and m
BMU(i)
is the prototype vector of the BMU
for x
i
. A lower Quantization Error indicates that
the SOM effectively captures the data structure (Sun,
2000).
Topographic Error: evaluates how well the
SOM preserves the topological properties of the in-
put space. It is defined as:
T E =
1
N
N
∑
i=1
u(x
i
) (5)
where u(x
i
) = 1 if the first and second BMUs of x
i
are
not adjacent, and u(x
i
) = 0 otherwise. A lower To-
pographic Error indicates better preservation of input
space topology (Vesanto and Alhoniemi, 2000).
These metrics collectively offer a comprehensive
framework for evaluating clustering performance, en-
suring reliable and valid results.
3.4.1 Clustering Algorithms Using Principal
Component Analysis (PCA)
For a dataset derived from the Spamley platform,
fundamental clustering methods-including k-means,
Gaussian Mixture Models (GMM), and agglomera-
tive clustering—were tested, relying on dimensional-
ity reduction via PCA. These methods served as an
initial step to identify the most suitable algorithm for
clustering individuals.
After initial clustering, silhouette analysis and
Davies-Bouldin Index which are explained in the sub-
section 3.4 were employed to determine the optimal
number of clusters (Rousseeuw, 1987).
The results of all four clustering algorithms were
suboptimal. Among them, k-means performed the
best; however, its clustering quality remains inade-
quate based on the silhouette scores and other evalua-
tion metrics. This suggests that the study should shift
towards more advanced techniques, such as deep clus-
tering algorithms, to improve clustering performance.
3.5 Deep Clustering
3.5.1 Generative Adversarial Network (GAN)
for Dimensionality Reduction
K-Means Clustering Using GAN. A hybrid ap-
proach was introduced, combining GANs for di-
mensionality reduction with k-means for clustering.
GANs were chosen for their ability to transform high-
dimensional data into a latent space that captures
meaningful patterns, enhancing its suitability for clus-
tering. This section details the methodology, includ-
ing GANs architecture, training settings, and cluster-
ing evaluation, ensuring clarity and reproducibility.
Dimensionality Reduction with GANs. The
GANs architecture consisted of two primary compo-
nents:
• Generator: The generator transformed random
noise into synthetic samples that mirrored the
structure of the input data. It used a dense layer
with ReLU activation to produce outputs match-
ing the input dimensions.
• Discriminator: The discriminator evaluated the
authenticity of the generated samples using a
dense layer with sigmoid activation. Its training
was optimized using binary cross-entropy loss.
The GAN was trained iteratively, where the gener-
ator and discriminator were updated using the Adam
optimizer with a learning rate of 5×10
−5
. Each GAN
configuration was evaluated across encoding dimen-
sions ranging from 2 to 15, with the number of train-
ing epochs set to 50.
Optimal Latent Encoding Selection. Latent fea-
tures were generated by the trained generator for each
encoding dimension. These features were clustered
using k-means, and the clustering quality was as-
sessed using multiple metrics: the Silhouette Score,
Davies-Bouldin Index, and Calinski-Harabasz In-
dex, as briefly explained in subsection 3.4 The en-
Enhanced Predictive Clustering of User Profiles: A Model for Classifying Individuals Based on Email Interaction and Behavioral Patterns
367
coding dimension with the highest silhouette score
and a combined metric score (maximizing silhou-
ette and Calinski-Harabasz while minimizing Davies-
Bouldin) was selected.
Optimal Cluster Determination. K-Means clus-
tering was applied across a range of clusters (k = 2
to 15). The optimal number of clusters was de-
termined by analyzing the same metrics and select-
ing the one with maximum silhouette and Calinski-
Harabasz while having minimum Davies-Bouldin.
The results demonstrate a better balance be-
tween dimensionality reduction and clustering preci-
sion compared to PCA-based clustering. However,
despite the notable improvement in clustering scores,
this approach still lags behind the other two dimen-
sionality reduction techniques and their correspond-
ing clustering results, discussed below.
3.5.2 Self-Organizing Maps (SOMs) for
Dimensionality Reduction
K-Means Clustering Using SOM.
This approach employs Self-Organizing Maps
(SOMs) for dimensionality reduction combined
with k-means clustering to identify patterns in
high-dimensional data. SOMs provide topology-
preserving transformations, while k-means extracts
distinct clusters, resulting in interpretable and struc-
tured representations. The methodology encompasses
dimensionality reduction, clustering, evaluation us-
ing multiple metrics, and visualization to ensure
reproducibility and reliability.
Dimensionality Reduction Using SOMs.
Introduced by (Kohonen, 1982), SOMs are artificial
neural networks designed to project high-dimensional
data onto a lower-dimensional grid while preserving
topological relationships. For this study, SOMs were
configured with the following parameters:
• Sigma: 0.5
• Learning Rate: 0.5
• Training Iterations: 100
To pre-process the data, an auto-encoder was used to
compress high-dimensional data into a latent space
before applying SOM. The auto-encoder was trained
with:
• Learning Rate: 5 × 10
−5
• Batch Size: 50
• Epochs: 20
• Early Stopping Patience: 5
This combination leveraged the topology-preserving
properties of the SOM and the ability of the auto-
encoder to capture latent features.
Optimal Encoding Dimension Selection.
The optimal encoding dimension was determined
by evaluating clustering quality metrics, including
silhouette score, Davies-Bouldin index, Calinski-
Harabasz index, quantization error, and topographic
error which were explained briefly in subsection 3.4,
also a combined score of maximum silhouette and
Calinski-Harabasz while having minimum Davies-
Bouldin, guided the selection of the optimum encod-
ing dimension that best captures the structure of the
dataset.
Optimal Cluster Determination.
K-Means clustering was applied to the SOM-mapped
features across a range of cluster counts (k = 2 to
15). The optimal k was determined using the same
multi-metric score evaluation mentioned in the previ-
ous paragraph, ensuring robust and meaningful clus-
ter selection.
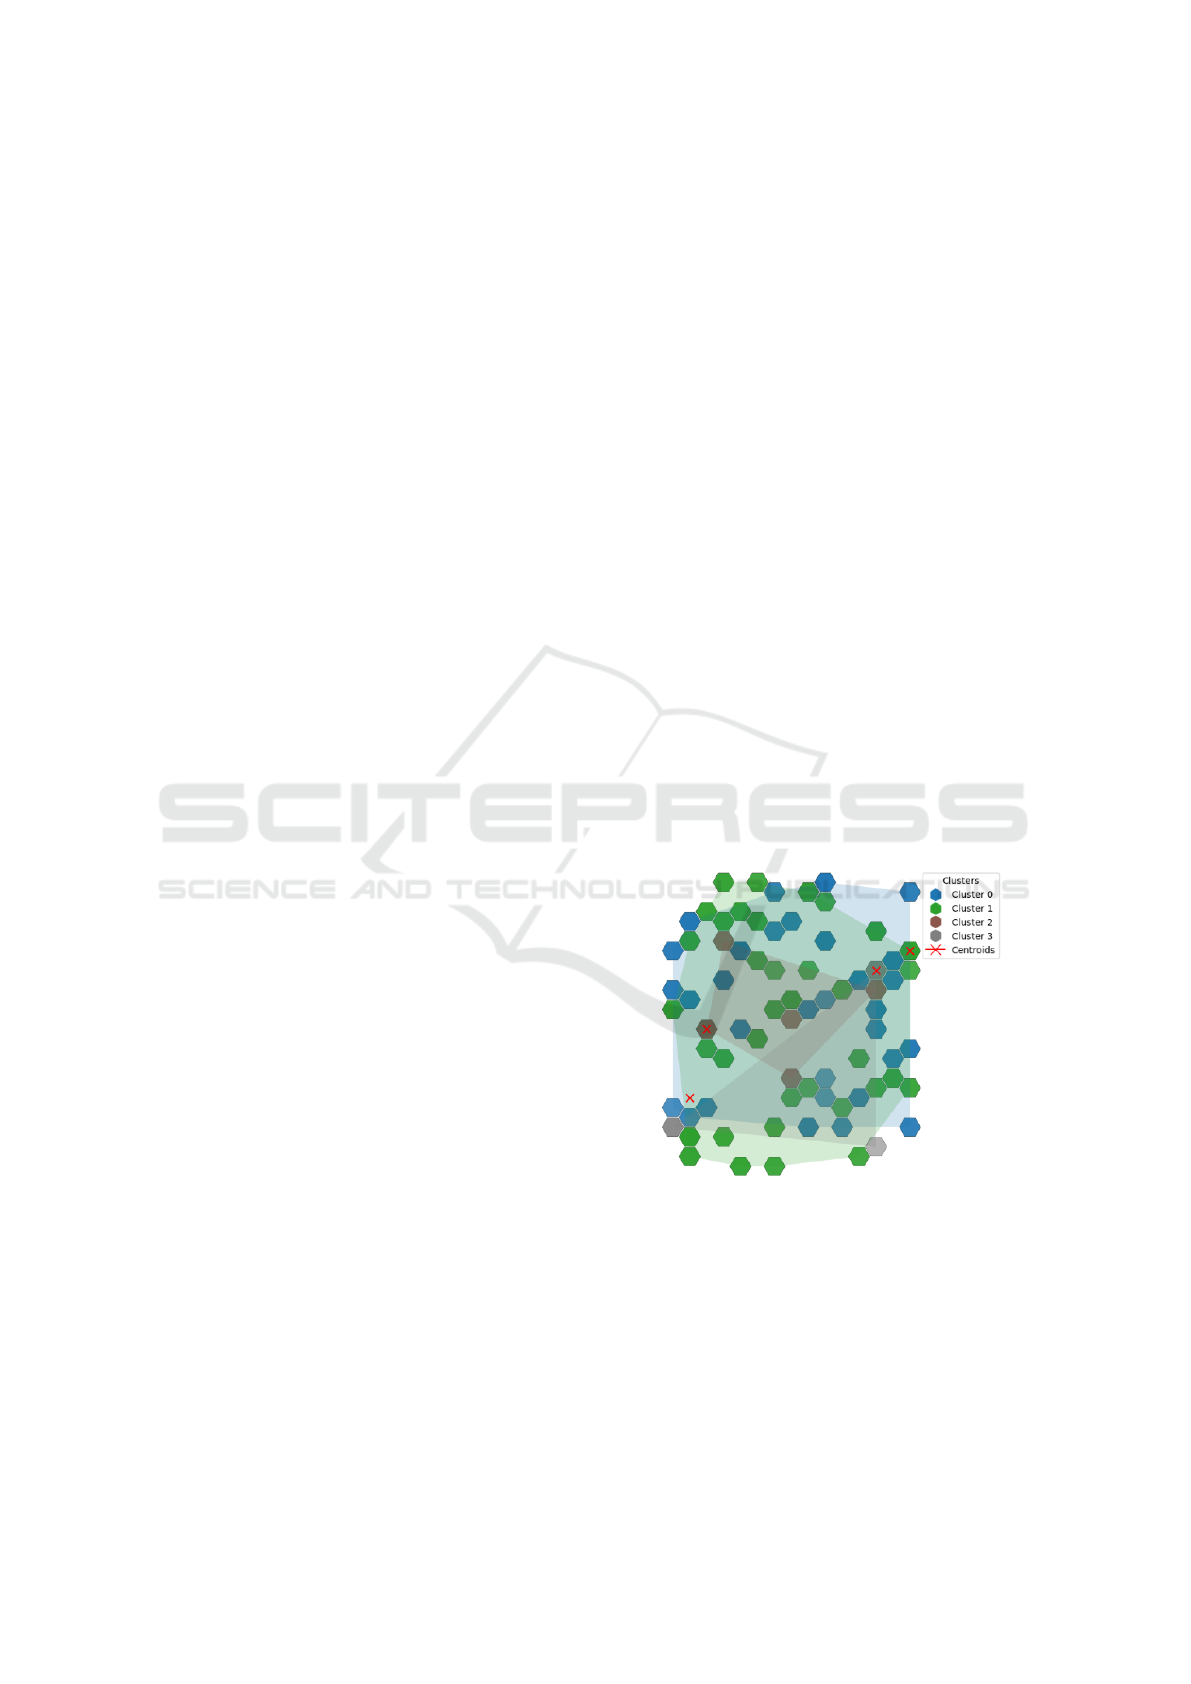
Visualization of SOM Clusters.
The clustered data was visualized on a 15×15 hexag-
onal grid, where the color of each cell represented
its cluster label. Boundaries and centroids were
highlighted for clarity, and convex hulls were drawn
around clusters to enhance interpretability. Figure 2
provides an example visualization, illustrating cluster
density and distribution.
Figure 2: Clusters Visualization on SOM Hexagonal Grid.
This integrated approach emphasizes the inter-
pretability of SOM clusters while preserving robust
clustering accuracy, offering actionable insights into
the structure of the dataset.
3.5.3 Auto-Encoder-Based Clustering
K-Means Clustering Using Auto-Encoders.
This approach leverages auto-encoders, a type of neu-
ICISSP 2025 - 11th International Conference on Information Systems Security and Privacy
368

ral network for unsupervised learning, in combination
with k-means clustering to analyze user responses
on Spamley’s test. Auto-encoders effectively reduce
the dimensionality of high-dimensional data by map-
ping it into a latent space that retains essential fea-
tures while discarding irrelevant information, making
it a reliable framework for analyzing various types of
complex datasets in different study directions (Abou
El-Naga et al., 2022).
Dimensionality Reduction Using Auto-Encoders.
The auto-encoder architecture was configured with
the following parameters to achieve effective dimen-
sionality reduction:
• Learning Rate: 5 × 10
−5
• Batch Size: 50
• Epochs: 20
• Early Stopping Patience: 5
The auto-encoder consists of two components:
• Encoder: Compresses high-dimensional input
into a lower-dimensional latent space using a
dense layer with ReLU activation.
• Decoder: Reconstructs the input from the latent
space, ensuring minimal reconstruction loss, with
a dense layer using sigmoid activation.
The model was trained on the dataset with a val-
idation split of 30%, leveraging early stopping to
prevent overfitting. The training and validation loss
trends were plotted for each encoding dimension to
ensure convergence and identify the most suitable di-
mensionality for clustering.
Optimal Encoding Dimension Selection.
To determine the best encoding dimension, k-means
clustering was applied to the latent features ex-
tracted by the auto-encoder across a range of dimen-
sions (2–15). Clustering quality was evaluated using
silhouette score, Calinski-Harabasz index, Davies-
Bouldin index. The encoding dimension with the
highest silhouette score and the overall combined
metric score were selected as optimal.
Optimal Cluster Determination.
K-means clustering was applied to the latent features
across a range of cluster numbers (k = 2 to 12). The
optimal k was determined by analyzing multiple met-
rics mentioned in subsection 3.4.
In conclusion, integrating the feature extraction
capabilities of auto-encoders with k-means and val-
idating the results using robust clustering evaluation
techniques provided reliable and adaptable outcomes
for analyzing the user responses dataset from Spam-
ley and generating clusters of user profiles.
3.6 Reproducibility and Robustness
To ensure the reliability of all of the models that used
k-means in their clustering approach the following
features were considered:
• Random Seed: A fixed seed (42) was used for all
stochastic operations.
• Consensus-Based Metrics: Optimal k was se-
lected based on a consensus of multiple metrics.
• Manual Centroid Initialization: Final centroids
were saved and reused for consistent clustering re-
sults.
3.7 Utilization of Generated Labels
After selecting the best clustering approach, clusters
were assigned labels ranging from 0 to n-1, where n
is the total number of clusters. A new column, ”la-
bels” was added to enable easy extraction of all the
rows that belong to the same cluster. Additionally,
the ”labels” column will serve as the target variable
in the supervised learning algorithm that will be used
to predict cluster membership for new users.
A more in-depth analysis was conducted to iden-
tify emails that were misclassified as legitimate de-
spite being phishing, and vice versa, by the major-
ity of individuals within each cluster. This analy-
sis utilized the email ids feature, which was excluded
during clustering due to the randomized sampling of
emails presented in each test attempt (Gallo et al.,
2024), as its inclusion could negatively influence clus-
tering outcomes. This insight proved crucial in iden-
tifying email features that tend to deceive users. A
function was then developed to generate a histogram
displaying the top 10 email IDs that misled users. The
identified deceiving email IDs were then passed to
the emails dataset which was generalized to create
a feature-based scheme rather than relying on static
email attributes. This scheme can then used to craft
new emails that align with the user profile.
3.8 Cluster Prediction Models
The methodology leverages a range of Machine
Learning (ML) and Deep Learning (DL) models to
predict cluster assignments.
Dataset Splitting: Data is split into an 80%-20%
ratio for training and testing. Features (X) include 30
selected attributes, while the target variable (y) repre-
sents cluster labels. Consistent random state initial-
ization ensures reproducibility.
Enhanced Predictive Clustering of User Profiles: A Model for Classifying Individuals Based on Email Interaction and Behavioral Patterns
369

Machine Learning Models:
• Random Forest (RF): An ensemble method that
builds multiple decision trees and aggregates pre-
dictions, optimized by tuning the depth of the tree
by hyperparameters and the number of estimators.
• Gradient Boosting Machines (GBM): Sequen-
tially enhances weak classifiers, reducing bias and
variance. Fine-tuning included the learning rate
and number of boosting stages.
• XGBoost: Combines gradient boosting with reg-
ularization and early stopping for computational
efficiency and accuracy in handling complex data.
• Support Vector Machines (SVM): Utilized lin-
ear and radial basis function (RBF) kernels to
separate data with maximum margin. Parameters
such as C and γ were optimized.
• k-Nearest Neighbors (k-NN): Assigns labels
based on majority class among k nearest neigh-
bors, with k = 5 selected for balanced perfor-
mance.
• Naive Bayes (NB): A probabilistic model lever-
aging Gaussian assumptions, suitable for high-
dimensional data.
Deep Learning Models:
• Artificial Neural Networks (ANN): A feed-
forward network with dense layers and dropout
for overfitting control. Trained for 50 epochs us-
ing the Adam optimizer.
• Convolutional Neural Networks (CNN): Imple-
mented as a 1D architecture for sequential data,
extracting local patterns through convolution and
pooling layers.
3.9 Cluster Prediction Evaluation
Metrics
The performance of all of the cluster prediction mod-
els mentioned was evaluated by a variety of metrics,
each assessing different aspects such as the accuracy
of the model, robustness, and generalization capabili-
ties.
Accuracy: measures the proportion of correctly
predicted labels out of the total labels and is defined
as:
Accuracy =
TP + TN
TP + TN + FP +FN
(6)
where TP, TN, FP, and FN represent True Positives,
True Negatives, False Positives, and False Negatives,
respectively. Accuracy provides a simple and intu-
itive measure but may be misleading in imbalanced
datasets (Powers, 2020).
Precision: evaluates the proportion of true posi-
tive predictions among all positive predictions. It is
calculated as:
Precision =
TP
TP + FP
(7)
High precision indicates that the model produces
fewer false positive predictions (Powers, 2020).
Recall: measures the proportion of true positives
correctly identified by the model. It is defined as:
Recall =
TP
TP + FN
(8)
Recall is particularly useful in scenarios where mini-
mizing false negatives is critical (Powers, 2020).
F1-Score: harmonic mean of Precision and Re-
call, providing a single metric to balance both mea-
sures. It is given by:
F1-Score = 2 ·
Precision · Recall
Precision + Recall
(9)
The F1-Score is particularly useful when dealing with
imbalanced datasets (Yedidia, 2016).
4 RESULTS AND DISCUSSION
This section provides detailed analysis of clustering
and predictive model results, comparing methods to
identify the most effective techniques for accurate
clustering. Key findings and evaluations are discussed
to assess performance and alignment with research
objectives
4.1 Clustering Performance According
to Different Dimensionality
Reduction Techniques
The performance of three dimensionality reduction
techniques—Self-Organizing Maps (SOM), auto-
encoders, and Generative Adversarial Networks
(GANs)—combined with k-means clustering is eval-
uated. Each method offers a distinct approach
to transforming high-dimensional data into lower-
dimensional representations, facilitating clustering.
Given the stochastic nature of k-means clustering,
where initial centroid positions are selected randomly
in each run, the outcomes for the optimum encoding
dimension, optimum number of clusters, and evalu-
ation metric scores varied across iterations. To en-
sure reliable and reproducible results, each technique
was subjected to a loop of 300 iterations, where the
most frequently observed optimal number of clusters
(k) was recorded. This iterative approach minimized
ICISSP 2025 - 11th International Conference on Information Systems Security and Privacy
370
variability and allowed for a robust analysis of the re-
sulting evaluation metrics. At the conclusion of all
iterations, the metrics corresponding to the most con-
sistent clustering outcomes were documented and an-
alyzed.
This approach in assessing the results ensures that
the reported results accurately reflect the clustering
effectiveness of each dimensionality reduction tech-
nique, providing a reliable basis for comparison and
insights into their suitability for the given dataset. In
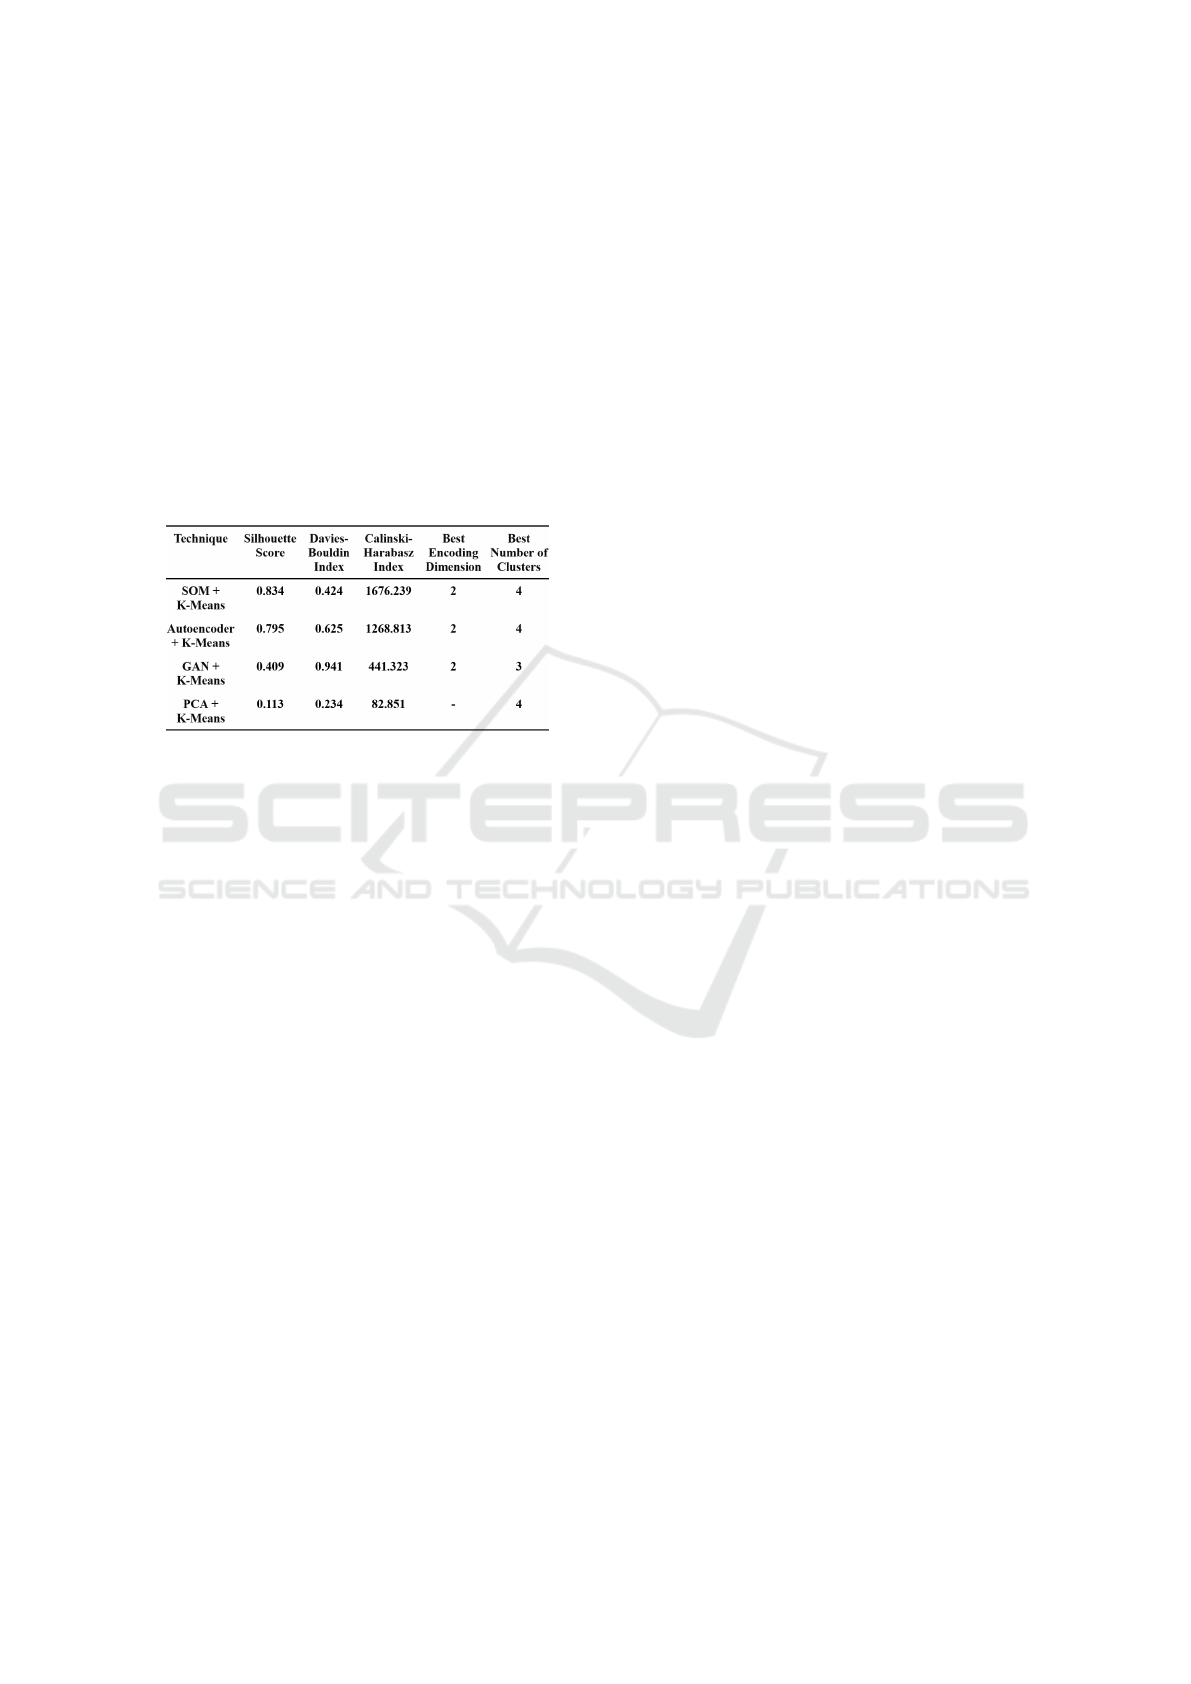
Table1 a comparison is presented including all the re-
sults of each approach.
Table 1: Clustering Metrics Comparison Table.
The performance of clustering techniques was
evaluated across four dimensionality reduction meth-
ods: Self-Organizing Maps (SOM), auto-encoders,
Generative Adversarial Networks (GANs), and Prin-
cipal Component Analysis (PCA). The evaluation uti-
lized a range of clustering metrics, including the Sil-
houette Score, Davies-Bouldin Index, and Calinski-
Harabasz Index, to assess the quality of cluster com-
pactness, separation, and overall structure. These
metrics provide complementary insights into the ef-
ficacy of the clustering process, ensuring a compre-
hensive evaluation framework.
Principal Component Analysis (PCA) and K-
Means: PCA served as the baseline for dimensional-
ity reduction, yielding the lowest performance across
all metrics. The Silhouette Score of 0.113 and the
Calinski-Harabasz Index of 82.851 indicate poor clus-
ter compactness and separation, while the Davies-
Bouldin Index of 0.234 suggests significant overlap
between clusters. Unlike the other methods, PCA did
not optimize an encoding dimension, as it reduces di-
mensionality linearly. The results highlight the lim-
itations of PCA in capturing the non-linear relation-
ships inherent in the data, reaffirming the superior-
ity of non-linear techniques such as SOMs and auto-
encoders for clustering tasks.
Generative Adversarial Network (GAN) and
K-Means: Despite the potential of GANs for gen-
erating rich latent representations, underperformed
compared to SOMs and auto-encoders. The Silhou-
ette Score of 0.409 and the Davies-Bouldin Index of
0.941 indicate less cohesive clusters with higher over-
lap. The Calinski-Harabasz Index of 441.323 reflects
weaker cluster dispersion. The optimal configuration
achieved an encoding dimension of 2 and 3 clusters,
suggesting that GANs struggled to identify distinct
patterns in the data. This low performance can be
attributed to the sensitivity of GANs to noise dur-
ing training and the limited number of epochs used
to avoid over-fitting. Also using GANs to expand
the dataset risks introducing synthetic anomalies and
noise, reducing the authenticity and reliability of the
dataset. That is why it will not be considered in fur-
ther studies.
Auto-Encoder and K-Means: Auto-encoder-
based dimensionality reduction also delivered com-
petitive results, with a Silhouette Score of 0.795 and a
Calinski-Harabasz Index of 1268.813, demonstrating
the effectiveness of the method in capturing mean-
ingful latent representations. However, the Davies-
Bouldin Index of 0.625 suggests that the clusters were
slightly less compact than SOM. The auto-encoder
successfully reduced the dimensionality to 2, and the
optimal number of clusters was determined to be 4,
similar to SOM. This outcome highlights the capabil-
ity of auto-encoders to balance data compression with
the preservation of key features relevant to clustering.
Self-Organizing Maps (SOM) and K-Means:
The combination of SOM with k-means clustering
achieved the highest overall performance across all
metrics. SOM preserved the topological structure of
the data during dimensionality reduction, resulting in
well-separated and cohesive clusters. A Silhouette
Score of 0.834 indicates strong intra-cluster similarity
and inter-cluster separation, while the Davies-Bouldin
Index of 0.424 reflects tight and distinct clusters. The
Calinski-Harabasz Index, with a value of 1676.239,
further supports the robustness of this approach. The
optimal configuration was achieved with an encoding
dimension of 2 and 4 clusters, demonstrating the abil-
ity of the model to maintain data integrity while sim-
plifying its representation.
Key Findings.
The results highlight the existence of four distinct user
profile clusters, providing a foundation for analyzing
the dominant deceptive traits in each cluster influenc-
ing each group. The results also demonstrate the su-
periority of SOM and auto-encoders with k-means for
the responses dataset from Spamley. SOMs, in partic-
ular, provided the most robust and interpretable clus-
ters, while auto-encoders offered competitive perfor-
mance with slightly lower cluster compactness. GAN
proved to be unreliable due to its low scores and sen-
Enhanced Predictive Clustering of User Profiles: A Model for Classifying Individuals Based on Email Interaction and Behavioral Patterns
371
sitivity to noise during training. PCA, while widely
used, proved inadequate for this dataset, underscoring
the importance of using advanced non-linear methods
for complex clustering problems.
These findings highlight the critical role of di-
mensionality reduction techniques in enabling effec-
tive clustering and provide a strong foundation for fu-
ture work in personalized user profiling and predic-
tive analytics. The demonstrated advantages of SOMs
and auto-encoders suggest that they are well-suited
for applications requiring robust clustering in high-
dimensional and behaviorally rich datasets.
4.2 Predictive Clustering Performance
The predictive clustering performance was evaluated
using four key metrics: Accuracy, Precision, Recall,
and F1 Score. These metrics which are further ex-
plained in subsection 3.9, were chosen to comprehen-
sively assess the ability of the models to predict the
cluster of each user.
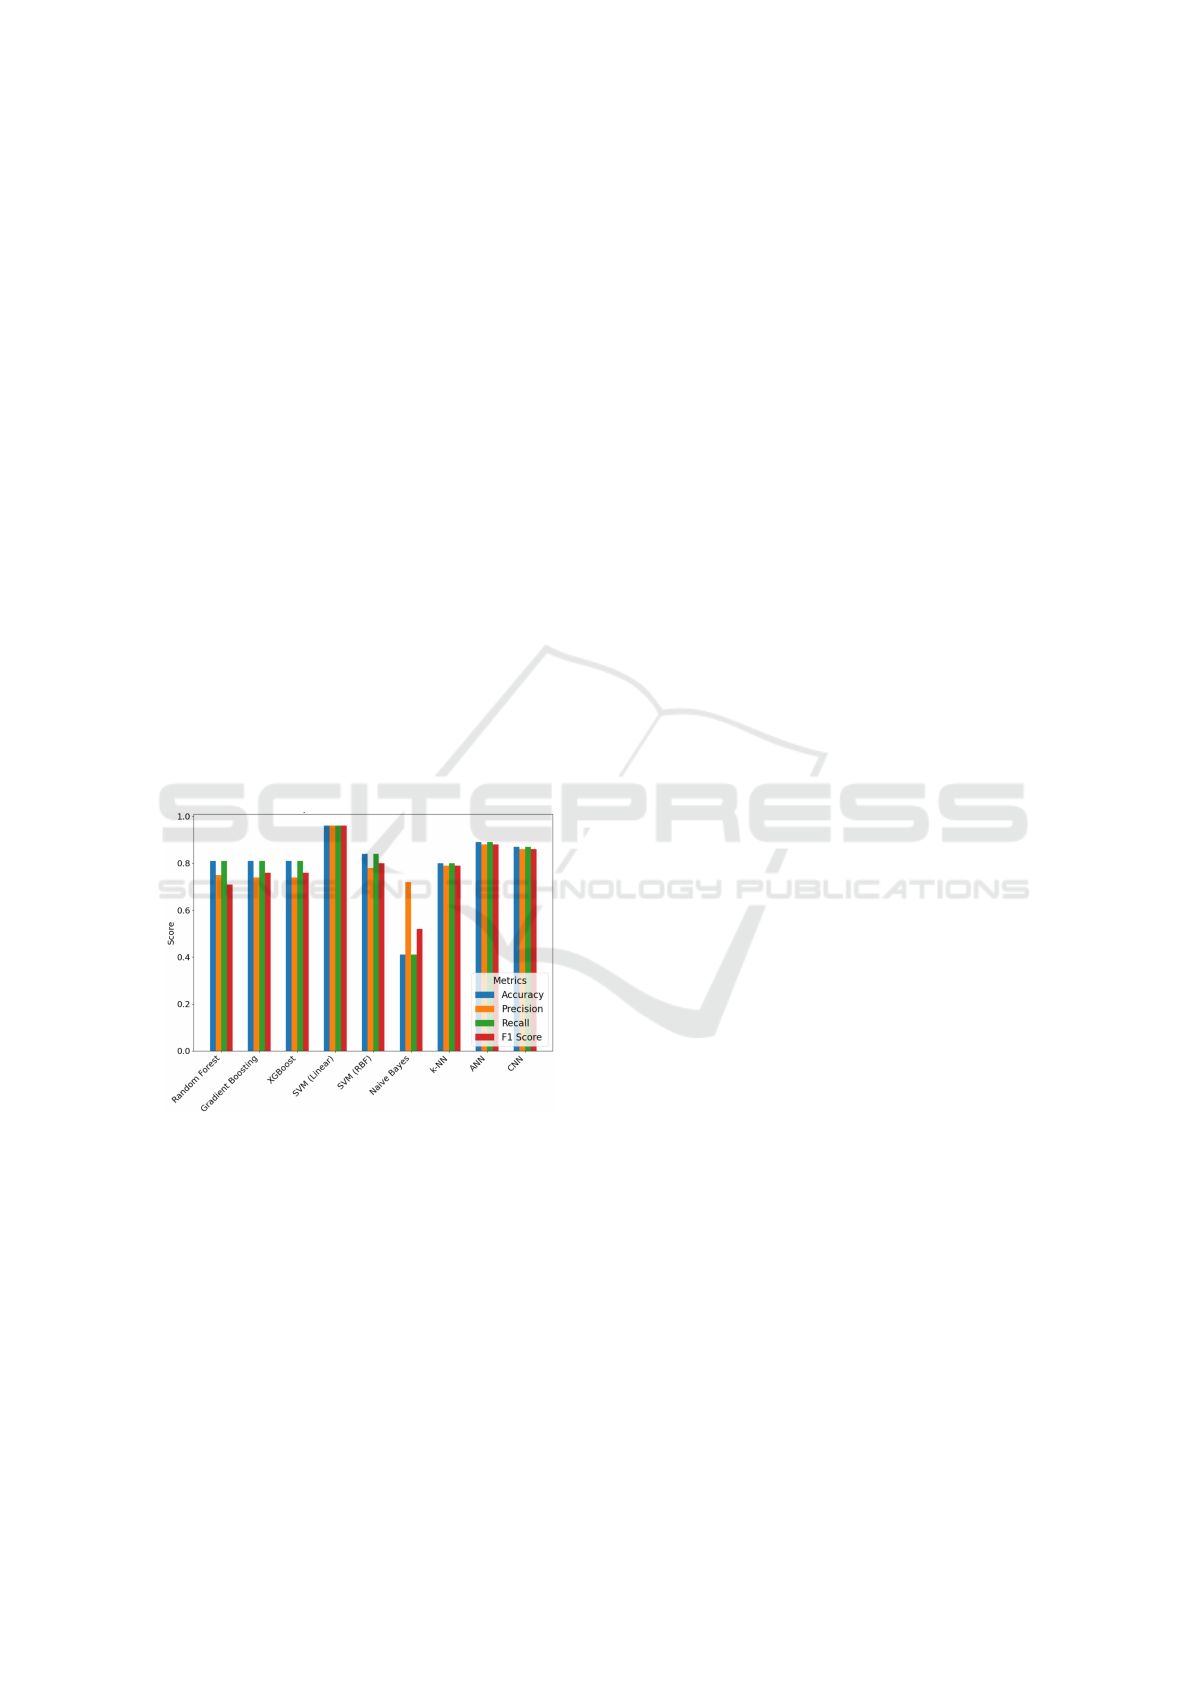
4.3 Performance Across Models
The results, as illustrated in Figure 3, demonstrate no-
table variations in performance across models.
Figure 3: Comparison of Performance Metrics Across All
Supervised Models.
• SVM (Linear) demonstrated the highest perfor-
mance exceeding 90% in all metrics, making it
the most reliable for predictive clustering.
• ANN and CNN Models performed strongly, with
scores exceeding 80% in all metrics, emphasizing
their ability to handle complex datasets.
• Gradient Boosting, Random Forest, and XG-
Boost showed competitive performance but
slightly lower Recall, suggesting a preference for
Precision over sensitivity.
• Naive Bayes underperformed, particularly in Re-
call and F1 Scores, likely due to its simplifying
assumptions that do not suit complex dependen-
cies in the data.
• k-NN offered balanced results but was outper-
formed by deep learning and ensemble-based
methods.
Key Findings.
• Superiority of Linear SVM: The performance of
the SVM model suggests that the cluster bound-
aries are well-separated in the feature space, mak-
ing it the most effective choice for predictive clus-
tering in this dataset.
• Strength of Deep Learning Models: The robust
performance of ANN and CNN highlights their
ability to capture non-linear relationships and sub-
tle patterns, making them well-suited for profiling
tasks.
• Limitations of Naive Bayes: The significant gap
in Recall and F1 Scores for Naive Bayes under-
scores the importance of choosing models that
can accommodate the inherent complexity of user
profiling datasets.
5 CONCLUSIONS AND FUTURE
WORK
This study introduced a novel predictive clustering
framework designed for the Spamley dataset, integrat-
ing email interaction patterns and user traits to en-
hance cybersecurity user profiling. By leveraging ad-
vanced dimensionality reduction techniques, includ-
ing Self-Organizing Maps (SOMs), autoencoders,
and Generative Adversarial Networks (GANs), the
framework delivered its most robust performance
with SOMs, achieving a Silhouette Score of 0.83,
a Davies-Bouldin Index of 0.42, and a Calinski-
Harabasz Index of 1676.2. These results address
the limitations of traditional methods, demonstrating
the effectiveness of advanced non-linear techniques
for clustering complex user profiles. The clustering
models identified four distinct clusters, their analy-
sis would provide foundational insights for the devel-
opment of tailored phishing countermeasures. Addi-
tionally, Support Vector Machines (SVMs) and neu-
ral network models proved to be effective in classify-
ing cluster membership, enabling predictions of email
characteristics that manipulate user profiles. This
framework offers actionable insights for personalized
content delivery and targeted awareness campaigns to
mitigate phishing attacks more effectively.
ICISSP 2025 - 11th International Conference on Information Systems Security and Privacy
372

Future work will focus on analyzing the clus-
ters generated by this model and documenting the
insights, following the expansion of the Spamley
dataset to improve the generalizability and accuracy
of the models. Additionally, efforts will be directed
toward exploring further variables that can be incor-
porated into the model to refine user profiling.
REFERENCES
Abou El-Naga, A. H., Sayed, S., Salah, A., and Mohsen,
H. (2022). Consensus nature inspired clustering
of single-cell rna-sequencing data. IEEE Access,
10:98079–98094.
Aggarwal, C. C. and Aggarwal, C. C. (2017). An introduc-
tion to outlier analysis. Springer.
Albladi, S. M. and Weir, G. R. (2018). User characteristics
that influence judgment of social engineering attacks
in social networks. Human-centric Computing and In-
formation Sciences, 8:1–24.
Allodi, L., Chotza, T., Panina, E., and Zannone, N.
(2019). The need for new antiphishing measures
against spear-phishing attacks. IEEE Security & Pri-
vacy, 18(2):23–34.
Calinski, T. and Harabasz, J. (1974). A dendrite method
for cluster analysis. Communications in Statistics,
3(1):1–27.
Chandola, V., Banerjee, A., and Kumar, V. (2009).
Anomaly detection: A survey. ACM Computing Sur-
veys (CSUR), 41(3):1–58.
Cialdini, R. B. and Cialdini, R. B. (2007). Influence: The
psychology of persuasion, volume 55. Collins New
York.
Davies, D. L. and Bouldin, D. W. (1979). A cluster separa-
tion measure. IEEE transactions on pattern analysis
and machine intelligence, (2):224–227.
Dhamija, R., Tygar, J. D., and Hearst, M. (2006). Why
phishing works. In Proceedings of the SIGCHI confer-
ence on Human Factors in computing systems, pages
581–590.
Gallo, L., Gentile, D., Ruggiero, S., Botta, A., and Ventre,
G. (2024). The human factor in phishing: Collect-
ing and analyzing user behavior when reading emails.
Computers & Security, 139:103671.
GDPR, G. D. P. R. (2016). General data protection reg-
ulation. Regulation (EU) 2016/679 of the European
Parliament and of the Council of 27 April 2016 on the
protection of natural persons with regard to the pro-
cessing of personal data and on the free movement of
such data, and repealing Directive 95/46/EC.
Han, J., Pei, J., and Tong, H. (2022). Data mining: concepts
and techniques. Morgan kaufmann.
Kim, S.-H. and Cho, S.-B. (2024). Detecting phishing urls
based on a deep learning approach to prevent cyber-
attacks. Applied Sciences, 14(22):10086.
Kohonen, T. (1982). Self-organized formation of topolog-
ically correct feature maps. Biological cybernetics,
43(1):59–69.
Kotsiantis, S. B., Kanellopoulos, D., and Pintelas, P. E.
(2006). Data preprocessing for supervised leaning.
International journal of computer science, 1(2):111–
117.
Lawson, P., Pearson, C. J., Crowson, A., and Mayhorn,
C. B. (2020). Email phishing and signal detection:
How persuasion principles and personality influence
response patterns and accuracy. Applied ergonomics,
86:103084.
Little, R. J. and Rubin, D. B. (2019). Statistical analysis
with missing data, volume 793. John Wiley & Sons.
Parrish Jr, J. L., Bailey, J. L., and Courtney, J. F. (2009).
A personality based model for determining suscepti-
bility to phishing attacks. Little Rock: University of
Arkansas, pages 285–296.
Pedregosa, F., Varoquaux, G., Gramfort, A., Michel, V.,
Thirion, B., Grisel, O., Blondel, M., Prettenhofer, P.,
Weiss, R., Dubourg, V., et al. (2011). Scikit-learn:
Machine learning in python. the Journal of machine
Learning research, 12:2825–2830.
Powers, D. M. (2020). Evaluation: from precision, recall
and f-measure to roc, informedness, markedness and
correlation. arXiv preprint arXiv:2010.16061.
Rousseeuw, P. J. (1987). Silhouettes: a graphical aid to
the interpretation and validation of cluster analysis.
Journal of computational and applied mathematics,
20:53–65.
Sammut, C. and Webb, G. I. (2011). Encyclopedia of ma-
chine learning. Springer Science & Business Media.
Sun, Y. (2000). On quantization error of self-organizing
map network. Neurocomputing, 34(1-4):169–193.
Tornblad, M. K., Jones, K. S., Namin, A. S., and Choi,
J. (2021). Characteristics that predict phishing sus-
ceptibility: a review. In Proceedings of the Human
Factors and Ergonomics Society Annual Meeting, vol-
ume 65, pages 938–942. SAGE Publications Sage CA:
Los Angeles, CA.
Van Der Heijden, A. and Allodi, L. (2019). Cognitive triag-
ing of phishing attacks. In 28th USENIX Security Sym-
posium (USENIX Security 19), pages 1309–1326.
Vesanto, J. and Alhoniemi, E. (2000). Clustering of the self-
organizing map. IEEE Transactions on neural net-
works, 11(3):586–600.
Wang, J., Herath, T., Chen, R., Vishwanath, A., and Rao,
H. R. (2012). Research article phishing susceptibil-
ity: An investigation into the processing of a targeted
spear phishing email. IEEE transactions on profes-
sional communication, 55(4):345–362.
Yedidia, A. (2016). Against the f-score.
URL: https://adamyedidia. files. wordpress.
com/2014/11/fscore. pdf.
Enhanced Predictive Clustering of User Profiles: A Model for Classifying Individuals Based on Email Interaction and Behavioral Patterns
373

APPENDIX
This appendix outlines the selected characteristics of each individual included in the dataset, to cluster the indi-
viduals accordingly.
Table 2: Selected Key Features for Clustering.
Feature Description
age Integer number representing age.
gender ”Male”, ”Female” and ”Other”.
years job experience Integer Number representing the number of years
computer science knowledge Score value from 1 to 5 where 5 means strong background.
phishing attack 0 or 1 where 1 means experienced phishing attack before.
antiPhishing course ever 0 or 1 where 1 means familiarity with cybersecurity awareness content.
time on internet Score value from 1 to 10 where 10 means excessive time on the internet.
educationField id,
jobField id
Both features share the same IDs (1 to 15), defined as follows:
1. Natural Sciences 9. Society and Culture
2. Mathematics and Physics 10. Arts and Entertainment
3. Information Technology 11. Culinary, Hospitality
4. Engineering 12. Law
5. Architecture and Building 13. Finance
6. Agriculture and Related Studies 14. Psychology
7. Health 15. Other
8. Management and Commerce
educationLevel id IDs (1 to 4), defined as follows:
1. High school graduate or below 3. Master’s degree
2. Bachelor’s degree 4. Doctorate degree
employmentType id IDs (1 to 9), defined as follows:
1. Trainee 6. Teacher
2. Employee 7. R&D
3. Manager 8. Entrepreneur
4. Executive 9. Freelancer
5. Student
work hours prior test Integer number representing the number of hours.
test location Device type used while reading the email, represented as a string.
self confidence Rating of self-confidence from 0 to 5 where 5 means very Confident.
impulsivity Rating of impulsivity from 0 to 5 where 5 means very impulsive.
curiosity Rating of curiosity from 0 to 5 where 5 means very curious.
risk propensity Rating of risk propensity from 0 to 5, where 5 is the highest value.
risk perception Rating of risk perception from 0 to 5, where 5 is the highest value.
privacy data Rating of care towards data privacy from 0 to 5, where 5 is the highest.
extraversion Rating of Personality trait from 0 to 5, where 5 means very outgoing.
agreeableness Rating of Personality trait from 0 to 5, where 5 means very cooperative.
conscientiousness Rating of Personality trait from 0 to 5, where 5 means very organized.
emotional stability Rating of Personality trait from 0 to 5, where 5 means very calm.
openness Rating of Personality trait from 0 to 5, where 5 means very curious.
scarcity Rating how effective the scarcity persuasion principle is in decision-making
from 0 to 5, where 5 means very effective.
consistency Rating how effective the consistency persuasion principle is in decision-making
from 0 to 5, where 5 means very effective.
social proof Rating how effective the social proof persuasion principle is in decision-making
from 0 to 5, where 5 means very effective.
gratitude Rating how effective the gratitude persuasion principle is in decision-making
from 0 to 5, where 5 means very effective.
authority Rating how effective the authority persuasion principle is in decision-making
from 0 to 5, where 5 means very effective.
education job interaction Feature engineered value resulted from educationLevel id × jobField id
ICISSP 2025 - 11th International Conference on Information Systems Security and Privacy
374
