
Deep Learning Denoising of Low-Dose Computed Tomography Using
Convolutional Autoencoder: A Phantom Study
Simone Damiani
1,2 a
, Manuela Imbriani
1,3
, Francesca Lizzi
2 b
, Mariagrazia Quattrocchi
3
,
Alessandra Retico
2 c
, Sara Saponaro
2
, Camilla Scapicchio
2 d
, Alessandro Tofani
3
,
Arman Zafaranchi
1,2,4 e
, Maria Irene Tenerani
∗,1,2 f
and Maria Evelina Fantacci
1,2 g
1
Department of Physics, University of Pisa, Pisa, Italy
2
National Institute for Nuclear Physics, Pisa Division, Italy
3
Medical Physics Department, Azienda Toscana Nord Ovest Area Nord, Lucca, Italy
4
Department of Computer Science, University of Pisa, Pisa, Italy
Keywords:
Denoising, Chest Low Dose Computed Tomography, Convolutional Autoencoder, Phantom, Lung Cancer,
Deep Learning.
Abstract:
Low Dose Computed Tomography (LDCT) has proven to be an optimal clinical exploration method for early
diagnosis of lung cancer in asymptomatic but high-risk population; however, this methodology suffers from
a considerable increase in image noise with respect to Standard Dose Computed Tomography (CT) scans.
Several approaches, both conventional and Deep Learning (DL) based, have been developed to mitigate this
problem while preserving the visibility of the radiological signs of pathology. This study aims to exploit the
possibility of using DL-based methods for the denoising of LDCTs, using a Convolutional Autoencoder and
a paired low-dose and high-dose scans (LD/HD) dataset of phantom images. We used twelve acquisitions of
the Catphan-500® phantom, each containing 130 slices, acquired with two CT scanners, two dose levels and
reconstructed using the Filtered BackProjection algorithm. The proposed architecture, trained with a com-
bined loss function, shows promising results for both noise magnitude reduction and Contrast-to-Noise Ratio
enhancement when compared with HD reference images. These preliminary results, while encouraging, leave
a wide margin for improvement and need to be replicated first on phantoms with more complex structures,
secondly on images reconstructed with Iterative Reconstruction algorithms and then translated to LDCTs of
real patients.
1 INTRODUCTION
Lung cancer is recognized by the World Health Orga-
nization (WHO) as the leading cause of cancer death
worldwide and among the most aggressive tumors,
also due to the difficulty of an early diagnosis; in fact,
lung cancer is often asymptomatic with the first ra-
diological sign of this disease given by the presence
of lung nodules, sometimes very small and detectable
a
https://orcid.org/0009-0004-8639-9661
b
https://orcid.org/0000-0003-0900-0421
c
https://orcid.org/0000-0001-5135-4472
d
https://orcid.org/0000-0001-5984-0408
e
https://orcid.org/0009-0009-4559-3923
f
https://orcid.org/0009-0000-6230-7858
g
https://orcid.org/0000-0003-2130-4372
∗
Corresponding Author
only with the Computed Tomography (CT) imaging
technique.
Several clinical studies have demonstrated the
usefulness of lung cancer screening in the at-risk pop-
ulation to reduce the mortality rate (Team, 2011),
which according to the ACR guidelines are people
aged 50 to 80 years who currently smoke or formely
smoked with a smoking history of at least 15-20 pack-
years (Wolf et al., 2024). However, many problems
delay its large-scale implementation, including the
high radiation dose to which the potentially healthy
population would be exposed and the high rate of false
positives in the detection and classification of lung
nodules (McKee et al., 2016).
The need to reduce radiation exposure during
low-dose CTs (LDCTs) scans, while maintaining im-
age quality and the diagnostic information contained
376
Damiani, S., Imbriani, M., Lizzi, F., Quattrocchi, M., Retico, A., Saponaro, S., Scapicchio, C., Tofani, A., Zafaranchi, A., Tenerani, M. I. and Fantacci, M. E.
Deep Learning Denoising of Low-Dose Computed Tomography Using Convolutional Autoencoder: A Phantom Study.
DOI: 10.5220/0013306300003911
Paper published under CC license (CC BY-NC-ND 4.0)
In Proceedings of the 18th International Joint Conference on Biomedical Engineering Systems and Technologies (BIOSTEC 2025) - Volume 1, pages 376-385
ISBN: 978-989-758-731-3; ISSN: 2184-4305
Proceedings Copyright © 2025 by SCITEPRESS – Science and Technology Publications, Lda.
within it (Kubo et al., 2016), has led to the devel-
opment of denoising methods to implement effective
and reliable models. These can be based either on
traditional techniques, such as iterative reconstruction
(IR) algorithms, wavelet-based approaches, and total
variation methods (Diwakar and Kumar, 2018), or,
more recently, on deep learning (DL) (Sadia et al.,
2024). The most widely used method to date for LD-
CTs acquisition is to reduce the tube current, which
is linearly proportional to the radiation dose (Living-
stone et al., 2010). However, a reduction in dose ex-
posure corresponds to an increase in image noise, as
this is inversely proportional to the square root of the
tube current, thus compromising image quality and
detectability of small, low-contrast structures, such as
pulmonary nodules.
To overcome these limitations great efforts have
been made in research to find a balance between re-
ducing noise and preserving clinical information and
reliability (Cui et al., 2023). Developments in the use
of Deep Learning in the field of image processing
make it an ideal candidate for the pursuit of such a
balance, with the possibility of integrating the denois-
ing process into working pipelines for nodule detec-
tion and segmentation used in Computed Aided De-
tection (CADe) systems (Jin et al., 2023; Barca. et al.,
2018).
The main objective of this preliminary work is
to develop a Convolution AutoEncoder for low-dose
(LD) images denoising using a dataset of low and
high-dose (HD) scans of the Catphan-500® commer-
cial phantom acquired with two different CT scan-
ners. Although a phantom cannot reproduce the ex-
treme complexity of human anatomy, its use allows
the acquisition of high-dose and low-dose pairs of im-
ages that would be extremely difficult to obtain for pa-
tients, due to the excessive radiation dose that would
be delivered during the acquisition of the data.
2 MATERIALS & METHODS
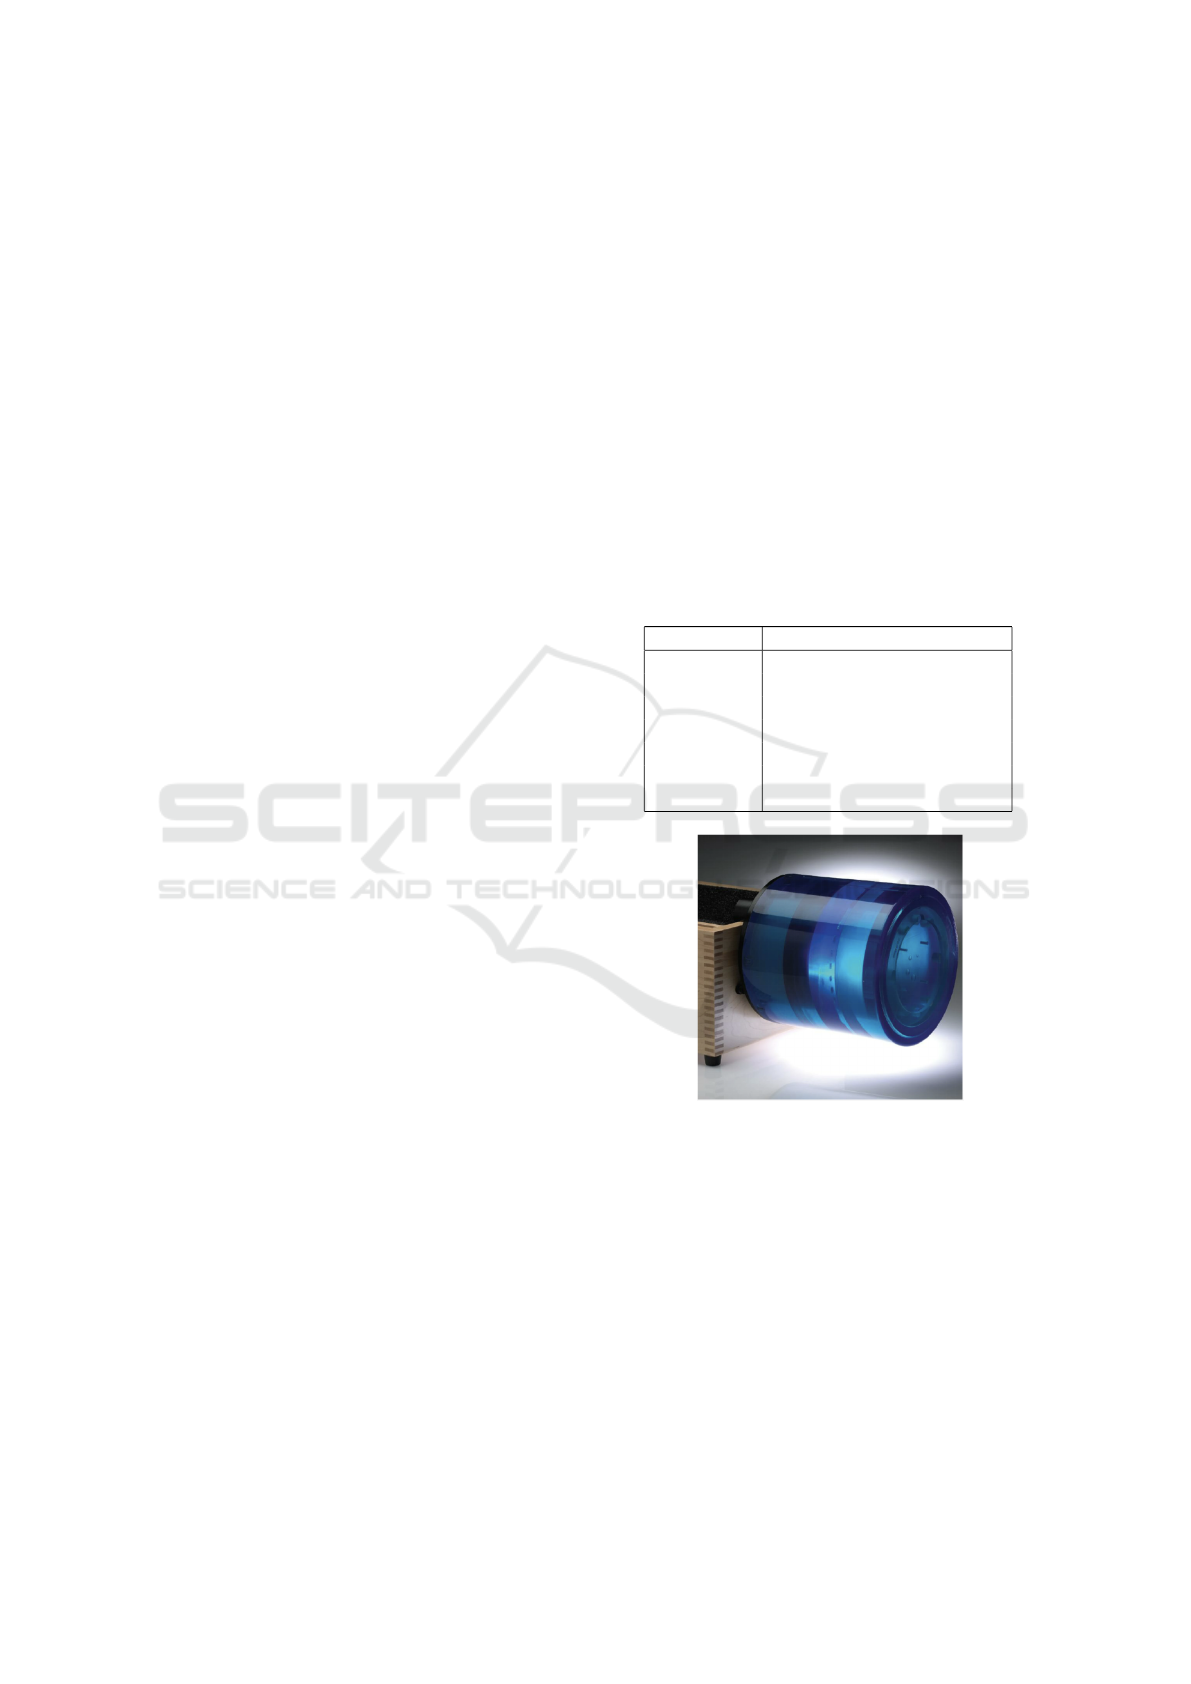
2.1 Phantom
The phantom used in this work is the Catphan-500®
(The Phantom Laboratory, NY, USA) (Mail, 2013). It
is a commercially available phantom, commonly em-
ployed in clinical procedures for quality control. It
has a cylindrical shape with a diameter of 20 cm and
is composed of four modules, as can be seen in Fig. 1.
Each module has a different structure and contains
materials of different densities to investigate several
image properties at different contrast levels. In this
work, three modules were considered:
• the CTP404 module includes seven cylindrical
inserts of 15-mm diameter and 25-mm thick-
ness, made of different materials, i.e. Acrylic,
Polystyrene, LDPE, PMP, Air, Teflon and Del-
rin, with the nominal CT values listed in Table 1,
and a vial of the same dimension which can be
filled with water, all embedded in a uniform back-
ground;
• the CTP486 module that is a homogeneous water-
equivalent module useful for characterizing noise
in the image;
• the CTP528 module which has a 1 through 21 line
pair per centimeter high-resolution test gauge and
two impulse sources (beads), which are cast into
a uniform material.
Table 1: Nominal CT values of the Catphan CTP404 mod-
ule inserts.
Material HU range (reference values)
Air [-1046:-986]
PMP [-220:-172]
LDPE [-121:-87]
Polystyrene [-65:-29]
Acrylic [92:137]
Delrin [344:387]
Teflon [941:1060]
Figure 1: Illustration of the Catphan-500® phantom
model (Mail, 2013).
2.2 Image Acquisition and CT Scanners
The CT images of the Catphan-500® phantom were
acquired via two different CT scanners: Revolution
Evo 64 Slice (GE Healthcare) and Aquilon CX 128
Slice CT (Toshiba). To ensure the correct positioning
of the phantom in the center of the imaging system,
the Catphan was positioned following the instructions
in the manual, i.e. by placing it on the treatment table
at the end of the gantry with its integral support, using
a level and aligning the phantom alignment marker
with the scanner laser. A representation of the phan-
Deep Learning Denoising of Low-Dose Computed Tomography Using Convolutional Autoencoder: A Phantom Study
377
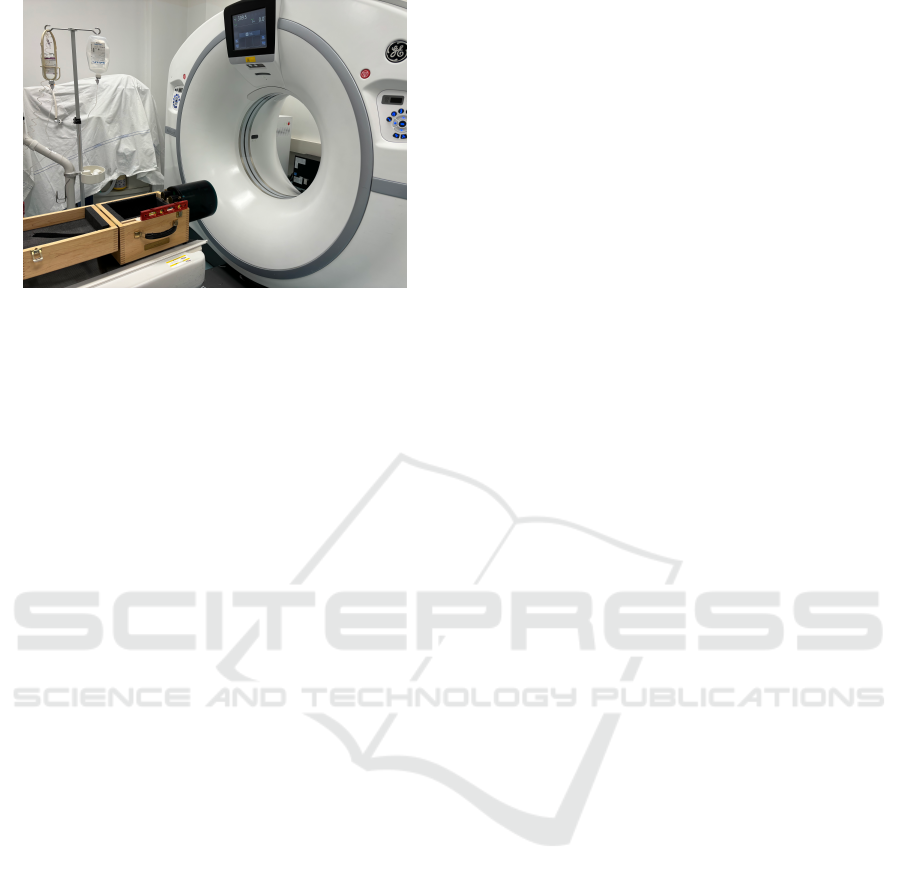
Figure 2: Catphan-500® phantom acquisition setting. The
phantom is placed on its case leveled and aligned with the
scanner alignment markers.
tom positioning on the GE scanner bed is shown in
Fig. 2.
The phantom was scanned in helical modality
starting from the acquisition and reconstruction pa-
rameters of the institutional clinical CT protocol for
diagnostic tasks in chest imaging using a sharp re-
construction kernel (LUNG for GE and FC56 for
Toshiba). Subsequently, three additional dose levels
(double the standard value, 60% of the standard value
and 30% of the standard value) were explored for a
total of eight protocols. The exact acquisition and
reconstruction parameters used in the dataset are de-
scribed in Table 2. For each combination of acqui-
sition parameters, the Catphan-500® acquisition was
repeated three times in a row, each time removing and
repositioning the phantom in the scanner.
The total Catphan-500® dataset consisted of
twenty-four CT scans: a combination of two CT sys-
tems (GE, Toshiba) and four dose levels (high, stan-
dard, reduced and low), each combination repeated
three times. The dimensions of the images in the
dataset were all 512 × 512 pixels in the axial plane
(x,y) while the dimension along z, i.e. the number
of slices, varied depending on the CT system consid-
ered: from a minimum of 169 slices for the Toshiba
to a maximum of 202 slices for the GE.
In this preliminary part of the work, as input to
the network, only two dose levels were used: coupled
2D slice pairs LD/HD, where low dose here means
30 percent of the standard dose and high dose is 200
percent of the standard dose, as these acquisitions rep-
resent the most and least noisy ones, respectively. For
each scan 130 slices were selected for training and
testing the network, considering only those that actu-
ally contain the phantom, that is, excluding the empty
slides and removing the ones strongly affected by ar-
tifacts, typically positioned at the beginning and at the
end of each scan due to the presence of metal inserts.
2.3 Denoising Autoencoder
The proposed architecture for LDCTs denoising is
based on a workhorse for image processing tasks:
a Convolutional Autoencoder. A graphical repre-
sentation of our image-denoising architecture, imple-
mented using PyTorch (a Python DL API), is shown
in Fig.3. The architecture can be divided into 3 main
parts: the encoder, the code (or bottleneck) and the
decoder. Each block in the encoding part consists of
a 2D Convolutional layer, with kernel size 3×3 and
a varying number of filters depending on the depth
of the block itself, a batch normalization layer, a
LeakyReLU activation function and, lastly, a Dropout
layer, set at 10% dropout rate, to reduce the risk of
overfitting during training. The output of each block
is then passed through a Max Pooling layer that halves
its size, bringing the input from an original size of
512×512 pixels to a compressed representation of
64×64 in the code, which is composed of two con-
volutional blocks in sequence. In the decoding part,
the convolutional layer has been replaced with a 2D
Transpose Convolutional layer (often referred to as
the de-convolutional layer), with the same kernel size,
to upsample the images to the original input size, re-
constructing the compressed information retained in
the bottleneck. In the last layer of the neural network,
a Convolutional layer with kernel size 1×1 and Tanh
activation function is applied to the output of the last
de-convolutional block to produce the denoised out-
put image.
In the network architecture here proposed, the en-
coding and the decoding parts are symmetrical and
three skip connections are used to concatenate encod-
ing and decoding blocks placed at the same depth,
making our architecture very similar to a U-net, as
can be seen in Fig.3. The skip connections imple-
mentation allows the network to retain fine structural
information, reducing the blurring effect due to the
convolutional process and improving network conver-
gence.
2.4 Net Training Process
2.4.1 Data Preparation
For this preliminary work, we considered only the
Catphan-500® CT scans acquired with the lower ra-
diation doses, i.e. CT DI
vol
= 2.03 mGy for the GE
and CT DI
vol
= 2.49 mGy for the Toshiba, coupled
with the maximum dose scans used as Ground Truth,
i.e. CT DI
vol
= 13.52 mGy for the GE and CT DI
vol
=
16.50 mGy for the Toshiba. Thus, a total of five
Catphan-500® LD 3D scans and five HD 3D scans
were used as training set to the Autoencoder, of which
BIOIMAGING 2025 - 12th International Conference on Bioimaging
378
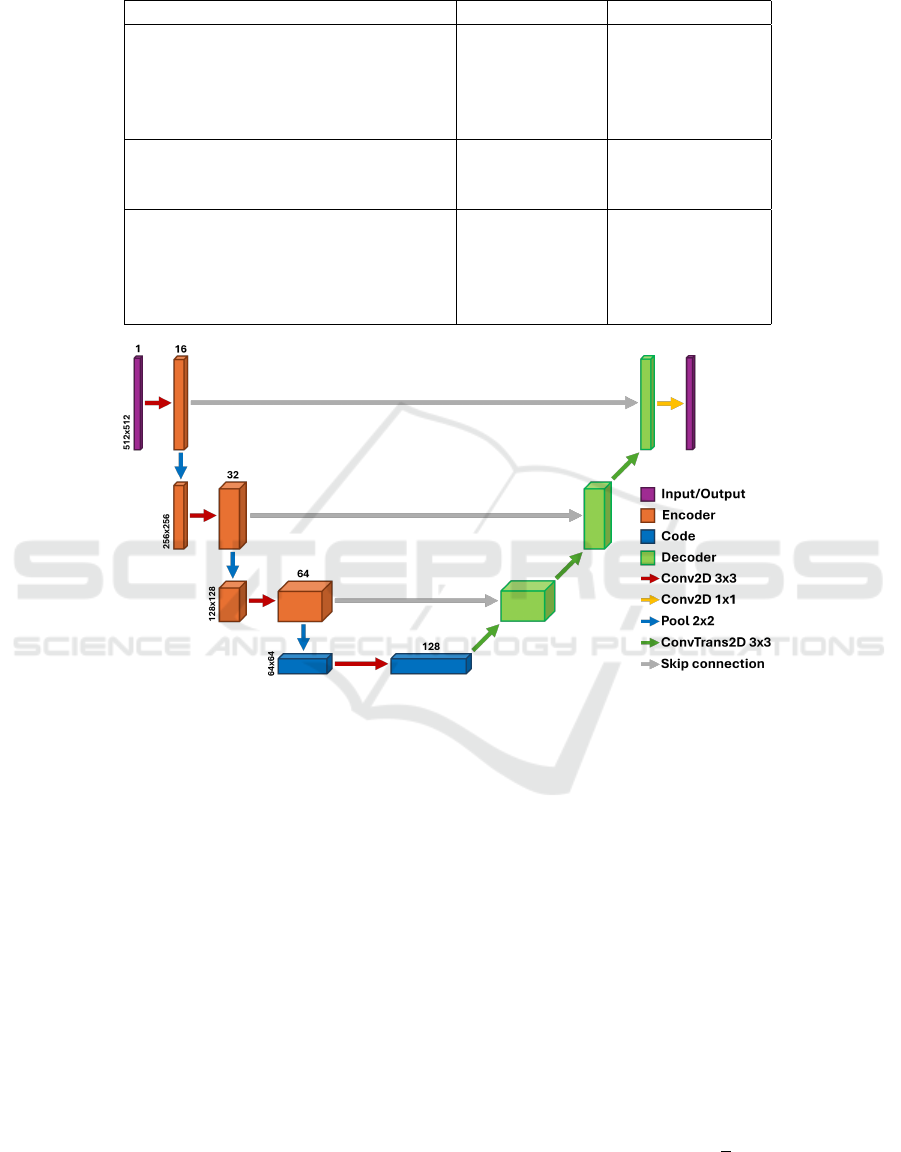
Table 2: Acquisition and reconstruction parameters of the eight protocols used to acquire the Catphan-500® CT images with
the two CT scanners.
Revolution GE Aquilon Toshiba
CTDI
vol
[mGy] (Tube current [mA])
High 13.52 (160) 16.50 (300)
Standard 6.76 (80) 8.30 (150)
Reduced 4.06 (50) 5.00 (90)
Low 2.03 (25) 2.49 (45)
Data acquisition
Tube potential (kVp) 120 120
Pitch 0.984 0.938
Image Reconstruction
Display field of view (mm) 210 219
Pixel Spacing (mm) 0.406 0.427
Slice thickness (mm) 1.25 1.00
Kernel LUNG FC56
Figure 3: Denoising Autoencoder scheme: the architecture is made of four levels of depth. In the encoding part (left of the
image) the input, i.e. a LD series of the Catphan-500® phantom, is processed through 2D convolutions, batch normalization
layers, activation layers (Leaky ReLU) and Max Pooling to reduce its dimensionality, while in the decoding one (right of
the image) the process is reversed through the use of 2D Transpose Convolution, in addition to the batch normalization and
activation layers.
2 belonged to the Toshiba sub-dataset and 3 to the
GE sub-dataset, for a total of 650 pairs of LD/HD
2D slices. The 2D input image pairs were then ran-
domly divided into eighty percent used for training
and twenty percent for validation. Another Catphan-
500® LD 3D scan and the corresponding HD 3D
scan, belonging to the Toshiba sub-dataset, for a to-
tal of 130 LD/HD 2D slice pairs were reserved as the
test set.
The images were windowed to [-2048, 2048]
Hounsfield units and were subsequently normalized
to the [-1,1] range and standard data augmentation
techniques, i.e. flipping and rotations, were applied
to the input training images.
2.4.2 Loss Function
Once the network architecture is chosen and imple-
mented, the set of parameters of the neural network
has to be appropriately trained. For this purpose, a su-
pervised training approach was adopted, using pairs
of LD (as input) and HD images (as reference), as
discussed in more detail in Section 2.4.1, and a com-
bined loss function was defined. A typical choice for
loss function in image restoration tasks is the Mean
Square Error (MSE), a pixel-wise cost function that
is convex and differentiable (Zhao et al., 2017), and
defined as shown in Eq.1:
MSE(Im
HD
, Im
Pred
) =
1
n
n
∑
i=1
(p
i
− ˆp
i
)
2
(1)
Deep Learning Denoising of Low-Dose Computed Tomography Using Convolutional Autoencoder: A Phantom Study
379

where Im
HD
is the high dose scan given as refer-
ence, Im
Pred
is the image output of the network, n
is the total number of pixels in both reference and
reconstructed images, while p
i
and ˆp
i
are the refer-
ence pixel values and predicted pixel values respec-
tively. However, the use of MSE only produces im-
ages that tend to be affected by blurring, resulting in
a loss of quality at the level of human vision percep-
tion, thus affecting the diagnostic information of the
image produced. To mitigate this problem, we de-
cided to add the Structural Similarity Index Measure
(SSIM) (Wang et al., 2004) to the loss function, since
it considers the sensitivity of the Human Visual Sys-
tem (HVS) to local changes in the image and its tex-
ture. The SSIM is defined in Eq.2:
SSIM(x, y) = [l(x, y)]
α
+ [c(x, y)]
β
+ [s(x, y)]
γ
(2)
l(x, y) =
2µ
x
µ
y
+ c
1
µ
2
x
+ µ
2
y
+ c
1
(3)
c(x, y) =
2σ
x
σ
y
+ c
2
σ
2
x
+ σ
2
y
+ c
2
(4)
s(x, y) =
σ
xy
+ c
3
σ
x
σ
y
+ c
3
(5)
where:
• (x, y) are image signals;
• l(x, y), c(x, y), s(x, y) (Eq.3-5) are the luminance,
contrast and structural comparison functions re-
spectively;
• α, β and γ are parameters used to set the relative
contribution of the components defined above;
• µ
x,y
is the mean intensity, σ
x,y
is the standard de-
viation and σ
xy
is the covariance;
• c
1
, c
2
and c
3
are constants depending on the dy-
namic range of the pixel values.
The loss function implemented to train our network
exploits the contributions of MSE and SSIM equally,
taking the form expressed in Eq.6:
L = ε · MSE + (1 − ε) · (1 − SSIM) (6)
where ε is set to 0.5 but can be further fine-tuned to
find the optimal balance between contributions.
During training, a LD series is given as input and
the resulting denoised scan is passed to the loss func-
tion along with the correspondent HD series used as
reference. The resulting value of this operation is then
backpropagated to adjust the model weights before
starting a new training epoch.
2.4.3 Training Details
The network training was performed on an NVIDIA
GeForce RTX 4080 Laptop GPU with 12 GB VRAM,
employing the Adam optimizer, an algorithm for first-
order gradient-based optimization of stochastic objec-
tive functions (Kingma, 2014), with an initial learn-
ing rate of 1 · 10
−4
and a scheduler that reduces this
parameter by a ten factor if validation loss does not
improve for more than ten epochs. The network was
trained for a total of 250 epochs, using a batch size of
16.
2.5 Image Quality and Noise Evaluation
To evaluate the ability of the Autoencoder to reduce
image noise while preserving image quality, the noise
magnitude, the Noise Power Spectrum (NPS) and
the Contrast-to-Noise Ratio (CNR) on low and high-
contrast inserts were calculated. This analysis was
performed firstly on the pair of LD/HD test images
and subsequently on the denoised output image and
the results were then compared.
The noise magnitude is defined as the standard devi-
ation of voxel values within a background region of
interest (ROI).
The NPS describes the distribution of noise vari-
ance in terms of spatial frequencies and it is de-
fined as the Fourier transform of the noise auto-
correlation (Samei et al., 2019). The 2D NPS is de-
fined as follows:
NPS( f
x
, f
y
) =
∆x · ∆y
N
x
· N
y
· ⟨|FFT
ROI
noise
|
2
⟩ (7)
where:
• f
x
and f
y
are the spatial frequencies along the
main orthogonal directions;
• ∆
x
and ∆
y
are the pixel sizes;
• N
x
and N
y
are the number of pixels in each direc-
tion;
• FFT is the 2D Fourier transform;
• ROI
noise(x,y)
is the local value of an ”only-noise”
ROI;
• the brackets <> indicate the ensemble average,
i.e. the average across measurement performed
on a number of ROIs.
The 2D NPS was calculated using nine square ROIs
measuring 64×64 pixels each, five of them were ar-
ranged in a cross starting from the center, as suggested
by (Samei et al., 2019), and the other four were placed
on the diagonals, as shown in Fig. 4. The 2D NPS
from each ROI were averaged to obtain the average
BIOIMAGING 2025 - 12th International Conference on Bioimaging
380
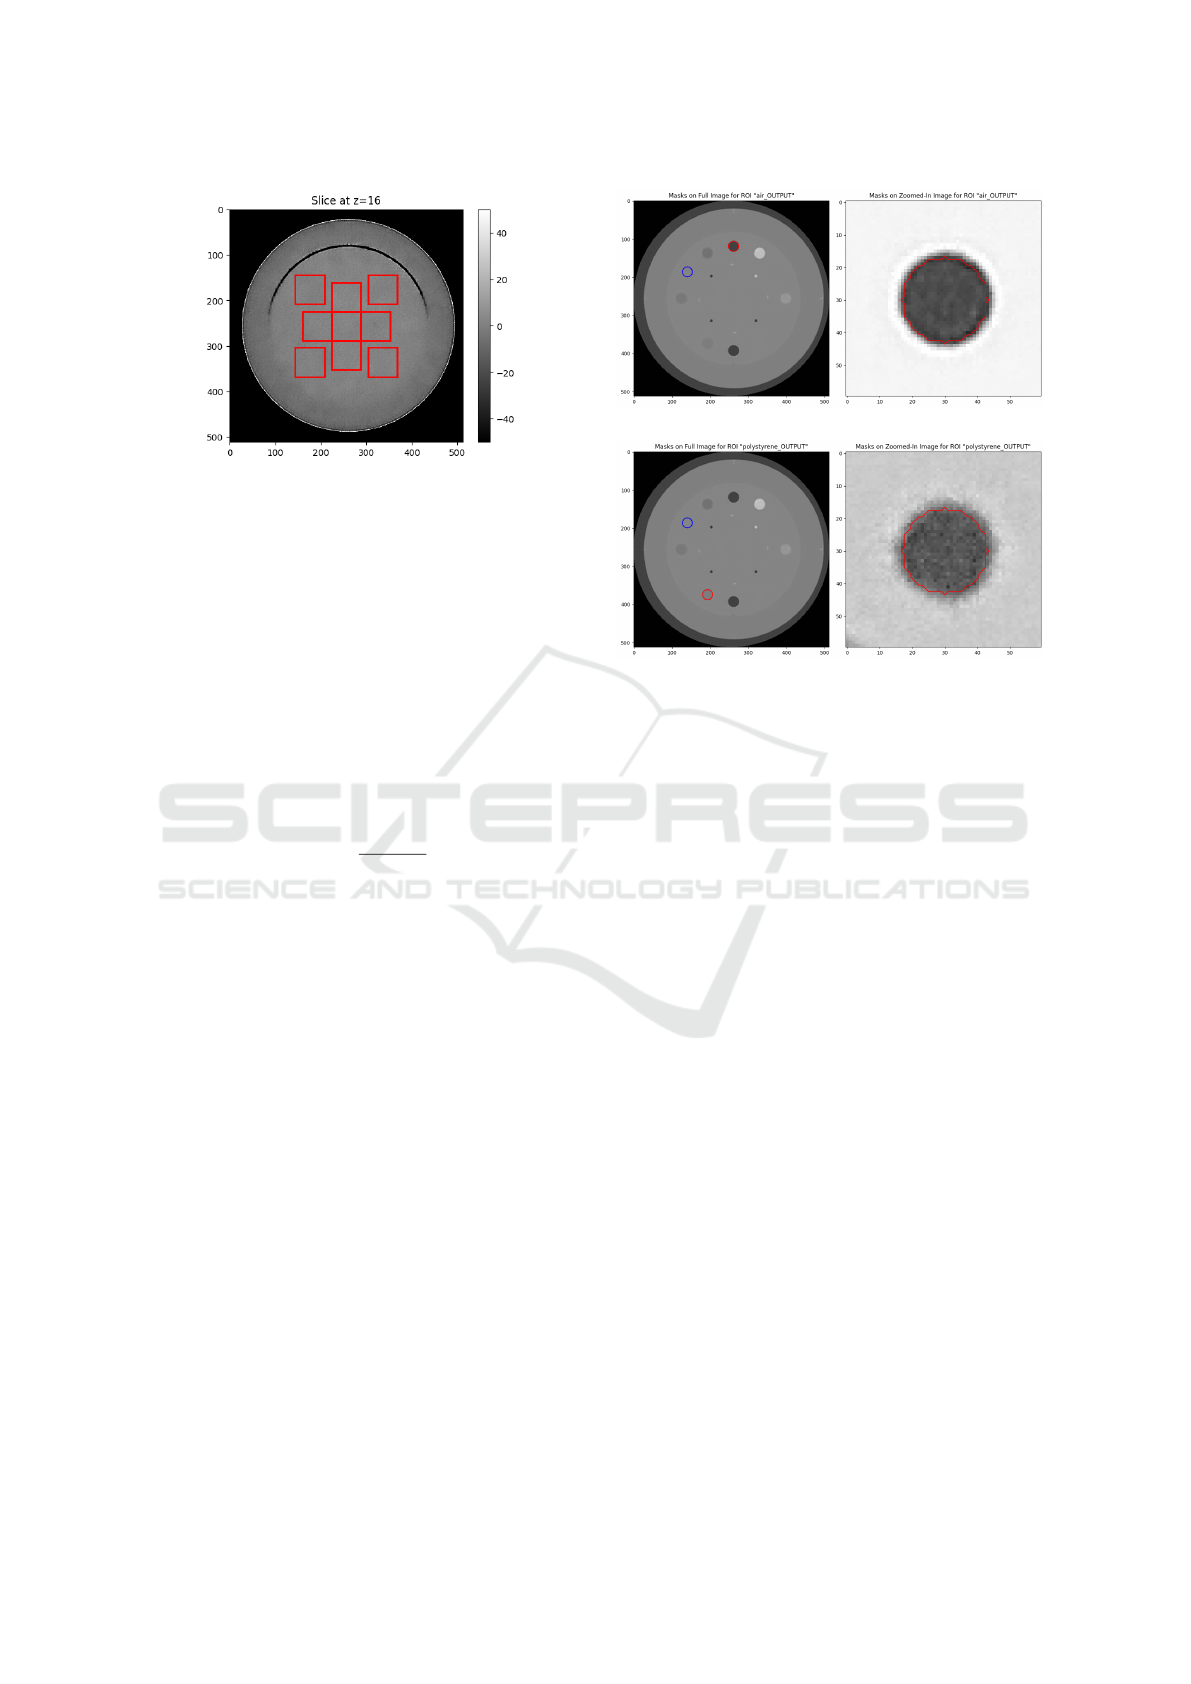
Figure 4: Positioning of the nine square ROIs measuring
64×64 pixels, used to compute the NPS on the central slice
of the CTP486 module in the output image.
2D NPS of the slice. This procedure was repeated for
a total of five non-consecutive slices, taking the cen-
tral one in the middle of the CTP486 module and av-
eraging the 2D NPS of the individual slices to obtain
the final average 2D NPS. The same nine ROIs and
averaging method were used for the noise magnitude
calculation.
The CNR (Eq.9) is defined as the difference in the sig-
nal intensity of two regions in the image, referred to
as Contrast (Eq.8), scaled to image noise:
Contrast =
HU
ob j
− HU
bkg
(8)
CNR =
Contrast
σ
bkg
(9)
where HU
ob j
and HU
bkg
are the mean values in two
regions of the image, one on the object and one on the
background, and σ
bkg
is the standard deviation in the
background region (Barca et al., 2021).
In this analysis the CNR was calculated on the
air and polystyrene inserts contained in the CTP404
Catphan-500® module by defining two different Re-
gions of Interest (ROIs), one centered on the insert
chosen for the analysis and the other centered in a uni-
form background region of the same slice, as can be
seen in Fig. 5. The computation was performed on
ten consecutive slices containing the inserts.
Furthermore, the Structural Similarity Index Mea-
sure (SSIM) was calculated between a central slice of
the CTP404 module for the HD image reference and
the corresponding output slice of the network.
3 RESULTS
The net achieved a test loss of 0.0338 and an average
SSIM calculated between the output image and the
HD series in the test set of 0.96±0.1. Fig. 6 illustrates
the SSIM map calculated between the central slice of
(a)
(b)
Figure 5: Insert (red) and background (blue) ROIs used to
compute the CNR for the air (a) and polystyrene (b) inserts.
the CTP486 module of an HD image in the test set
and the image output by the network.
The results for the 2D NPS for the LD, HD and output
images in the test set are shown in Fig. 7. In Table 3,
the results for the noise magnitude, Contrast and CNR
calculation for the high contrast insert (air) and low
contrast insert (polystyrene) are displayed.
4 DISCUSSION AND FUTURE
DEVELOPMENTS
The SSIM calculation is a method frequently used
in the literature to evaluate the quality of a denois-
ing system. Han et al. achieved a SSIM of 0.91 us-
ing a RED-CNN architecture with an observer loss,
Chen et al. achieved a SSIM of 0.97 using a RED-
CNN with MSE loss and Mentl et al. proposed a
3D sparse denoising autoencoder with Mean Abso-
lute Error (MAE) loss function reaching a SSIM of
0.97 (Han et al., 2021; Chen et al., 2017; Mentl et al.,
2017). The high SSIM value achieved by our network
(presented in Section 3) can be explained by the char-
acteristics of the phantom used, composed of mainly
homogeneous modules. The use of only phantom im-
ages represents a limitation of this work since phan-
toms cannot reproduce the extreme complexity and
the heterogeneity of human anatomy. However, they
allow accurate noise characterization due to the rela-
Deep Learning Denoising of Low-Dose Computed Tomography Using Convolutional Autoencoder: A Phantom Study
381
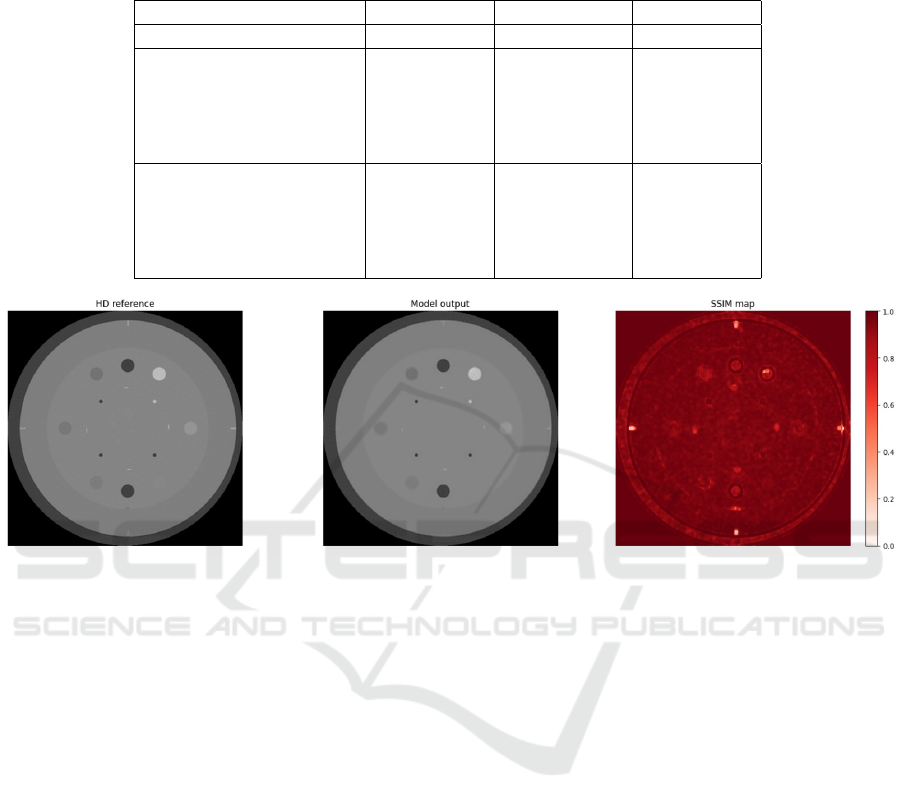
Table 3: Preliminary results of the proposed model denoising performances. Noise magnitude σ has been computed on the
same ROIs and slices used for NPS calculations, while Contrast and CNR has been computed on circular ROIs centered on
inserts of interest and background, as shown in Section 2.5.
LD Input HD reference Predicted
Noise magnitude σ [HU] 63.4 ± 2.0 24.0 ± 0.8 2.5 ± 0.1
Contrast [HU]
High contrast insert 1112.4 ± 2.6 1110.2 ± 0.7 1105.8 ± 1.2
(Air)
Low contrast insert 136.4 ± 1.6 136.2 ± 0.9 134.2 ± 0.7
(Polystyrene)
CNR
High contrast insert 17.0 ± 0.7 45.3 ± 2.3 389.4 ± 8.2
(Air)
Low contrast insert 2.1 ± 0.1 5.6 ± 0.3 47.2 ± 1.0
(Polystyrene)
Figure 6: SSIM map computed between the central slice of the CTP486 module of the HD test image and the network output
image.
tive simplicity of their structures. One of the possible
future developments of this work therefore concerns
the introduction into the dataset of phantoms with a
more complex structure, and the application, as a last
step, to the clinical chest CTs of patients to improve
the detectability and classification of pulmonary nod-
ules. Another option for expanding the dataset is to
use synthetic noise addition methods for both phan-
toms and real patients CTs, yet many techniques in-
volve the use of raw projection data which are difficult
to access and manage (Massoumzadeh et al., 2009).
A tool to add artificial noise that simulates reduced-
dose CT images using the existing Standard Dose CT
(SDCT) images without requiring projection data was
recently developed by Alsaihati et al. (Alsaihati et al.,
2024). The implementation of this method on both
currently used CT phantom images and with patient
chest-CTs would allow to train our network on larger
and more realistic datasets.
The preliminary results presented here show the
network ability to reduce the noise magnitude while
maintaining the contrast, thus increasing the CNR
of both the low-contrast insert (polystyrene) and the
high-contrast insert (air) compared to both those cal-
culated on the LD and on the HD images. We as-
sume that the considerable increase in CNR is due to
the choice to use a uniform background ROI, where
the proposed network tends to significantly reduce the
variability of pixel intensities, leading to low stan-
dard deviation values within the background ROI. The
CNR, being inversely proportional to this quantity, in-
creases accordingly.
In lung nodule detection, the ability of the denois-
ing system to transfer contrast is critical since nodules
are often very small and similar in shape to structures
normally found within the lung parenchyma. How-
ever, given the great complexity of this task, CNR
measurements may not always be the best metric for
describing the visibility of such nodules by radiolo-
gists, since it does not take into account human vi-
sual perception. One possibility to integrate this as-
pect when evaluating the quality of the generated im-
age could be to implement the calculation of the de-
tectability index on high- and low-contrast inserts.
This new task-based metric, first introduced by Samei
et al. (Samei et al., 2019), allows the joint effect of
spatial resolution, contrast, and noise to be evaluated,
as shown, for example, by the work of Scapicchio et
BIOIMAGING 2025 - 12th International Conference on Bioimaging
382
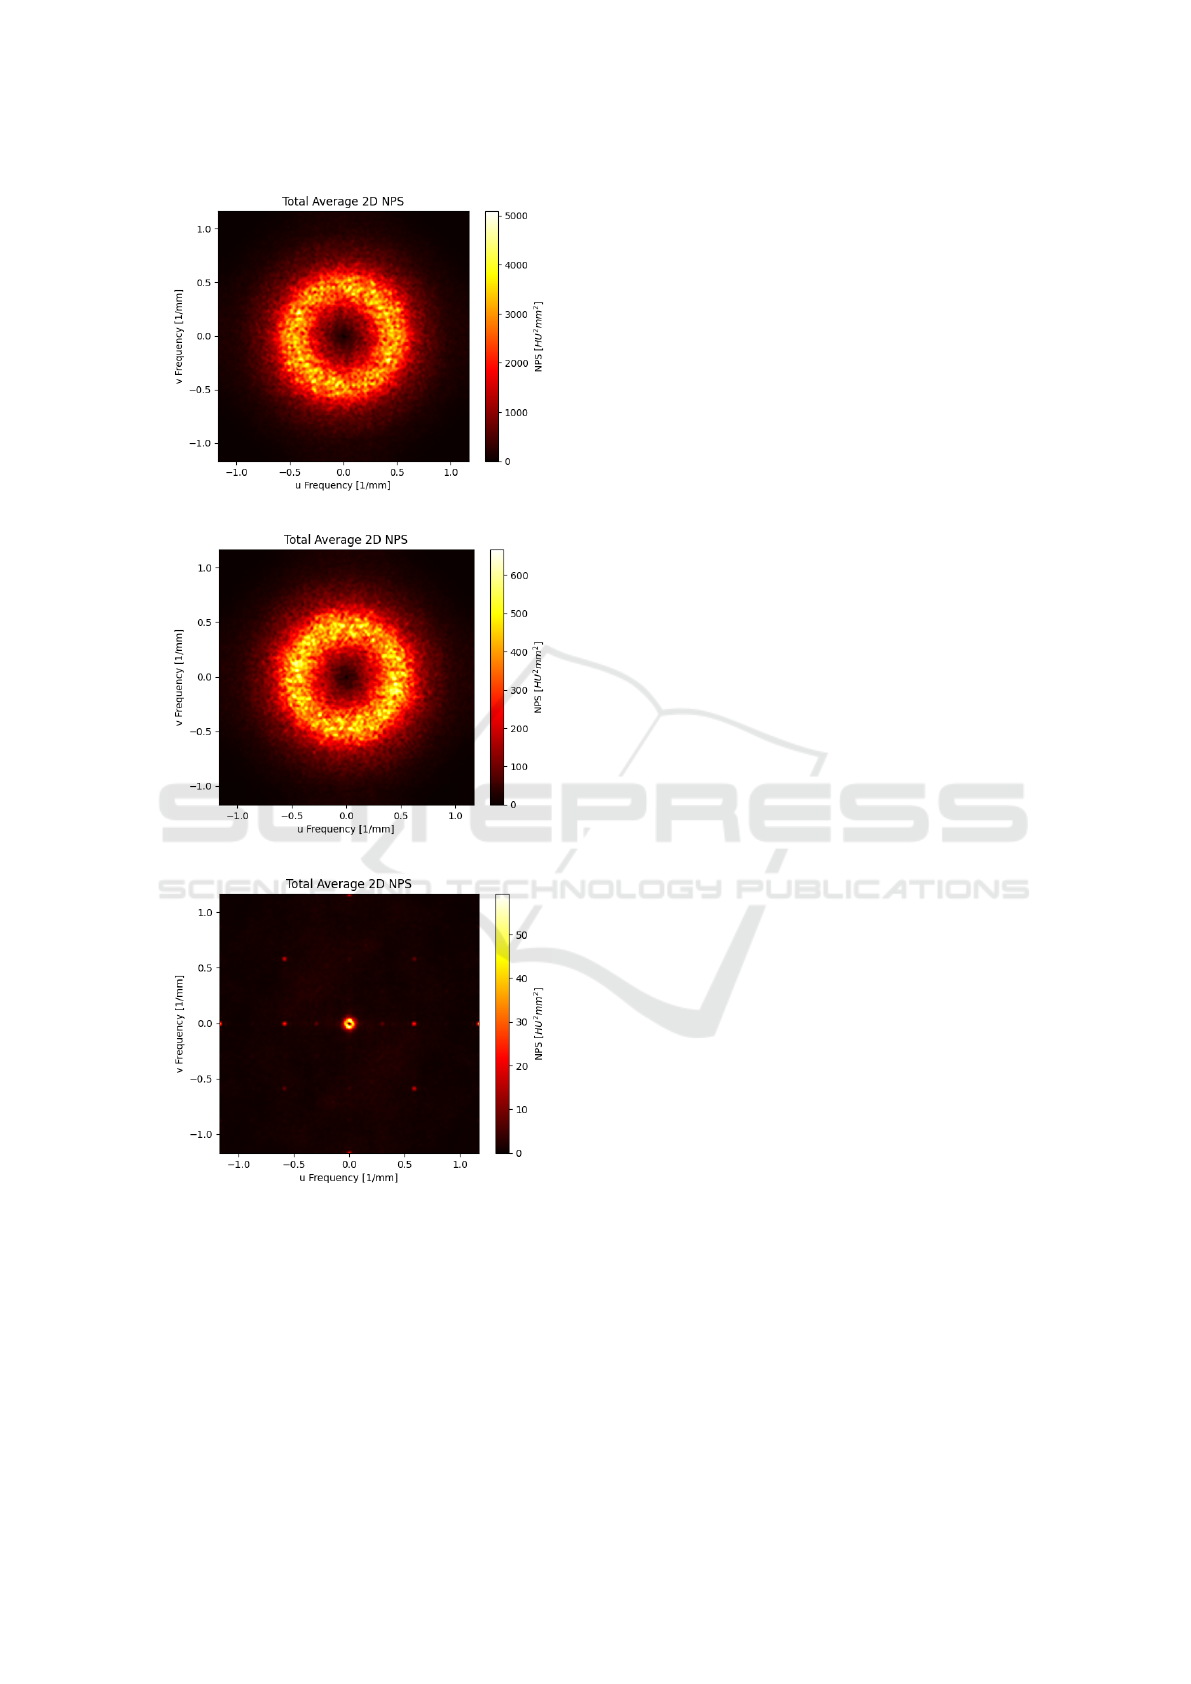
(a)
(b)
(c)
Figure 7: 2D NPS evaluated on the test LD series (a), test
HD series (b) and Net output image (c).
al. (Scapicchio et al., 2024b).
As can be seen from Table 3, the results of the De-
noising Autoencoder show a significant discrepancy
in terms of noise magnitude reduction. The reason for
this result can be attributed to the training paradigm
employed: the training approach is a supervised one,
however, the reference used is not free of noise but
rather has a smaller amount of noise with a different
spatial distribution. The presence of noise in both
images makes our training approach similar to the
Noise2Noise algorithm, a self-supervised method de-
veloped for training denoising U-net (Lehtinen, 2018)
in which only the most relevant features not associ-
ated with the noise are retained by the network. In
this work, a similar reasoning can be made: since
the network cannot map the noise patterns exactly
between the input image and the given reference, it
does additional approximation work, thus reducing
the noise beyond what are the given reference lev-
els. In addition to this, the influence of using a sharp
kernel for image reconstruction and the MSE in the
loss function, which tends to over-smoothing, should
be considered. Lastly, the employment of a super-
vised method with LD/HD pairs is driven by the pur-
suit to maximize the image spatial resolution used
to train the network; in fact, as shown by previous
studies (Scapicchio et al., 2024a; Scapicchio et al.,
2024b), the detectability of the low-contrast inserts
present in the Catphan-500®phantom increases with
the dose delivered. The use of LD/HD pairs can thus
help the network in the complex task of reconstructing
small, low-contrast details, such as lung nodules in
clinical chest-CTs, whose detectability is often com-
promised by image noise.
From the maps of the 2D NPS, shown in Fig. 7, it
is possible to observe the reduction of high-frequency
noise in the network output images compared to both
the reference and the input images. This particular be-
havior may be due to the use of the MSE as part of the
loss function as it tends to perform image blurring. It
might be interesting to study the ability of the MSE as
loss function to effectively reduce noise in the image,
for example by performing a bias-variance decompo-
sition of the MSE for noise estimation. In addition,
we would like to investigate different values of the ε
parameter (ranging from 0 to 1) within the loss func-
tion, which determines the proportion between MSE
and SSIM, to deepen the understanding of the contri-
bution of both metrics to the denoising task. In addi-
tion, it is worth investigating other types of loss func-
tions, such as MAE and Total Variation, to increase
the network ability to preserve fine details.
Another limitation of this work is the use of a 2D
network, a choice constrained by the limited dataset
at our disposal. However, even by not fully exploit-
ing the volumetric dataset, the use of 2D input slices
allows to evaluate the denoising capabilities of our
algorithm. The evolution to a 3D model, subject to
greater data availability, would provide better gener-
alization to clinical data and will be investigated in
Deep Learning Denoising of Low-Dose Computed Tomography Using Convolutional Autoencoder: A Phantom Study
383

possible future developments. The choice to use both
sub-datasets (GE and Toshiba) for network training,
despite belonging to different vendors, was necessary
for both maximizing the number of training samples
and increasing the generalizability of the model to dif-
ferent CT-scanners.
A last interesting investigation concerns the use
of iterative reconstruction algorithms. In fact, the
twelve CT scans used in this work belong to a larger
Catphan-500® dataset, entirely described and origi-
nally used for radiomics studies in the work of Scapic-
chio et al. (Scapicchio et al., 2024a), which also in-
cludes images reconstructed with different iterative
reconstruction (IR) blending levels. The addition of
these images to our analysis could be useful to eval-
uate the effectiveness of combining the two methods,
IR algorithms and DL, to reduce noise in LDCTs.
5 CONCLUSIONS
The Convolutional Autoencoder presented in this
work shows promising results for denoising LD im-
ages of the Catphan-500® phantom both in terms of
artifact reduction and of noise magnitude, noise tex-
ture (NPS) and CNR of low- and high-contrast in-
serts. Despite the homogeneous structure of the phan-
tom used, these results are encouraging for a possible
extension of this work to both phantoms with more
complex geometries and textures and patient CTs. In
particular, the latter application would open up the
possibility of incorporating the denoising step into
pipelines of lung nodule segmentation, detection and
classification helping to decrease the false-positive
rate and increase the reliability of CADe systems for
their implementation in lung cancer screening pro-
grams.
ACKNOWLEDGEMENTS
The research leading to these results has received
funding from:
The European Union - NextGenerationEU through
the Italian Ministry of University and Research
under: PNRR - M4C2-I1.3 Project PE 00000019
”HEAL ITALIA” to Maria Evelina Fantacci, Maria
Irene Tenerani and Arman Zafaranchi – CUP
I53C22001440006.
Piano Nazionale di Ripresa e Resilienza
(PNRR), Missione 4, Componente 2, Ecosis-
temi dell’Innovazione–Tuscany Health Ecosystem
(THE), Spoke 1 “Advanced Radiotherapies and
Diagnostics in Oncology”—CUP I53C22000780001.
PNRR - M4C2 - Investimento 1.3, Partenariato
Esteso PE00000013 - ”FAIR - Future Artificial
Intelligence Research” - Spoke 8 ”Pervasive AI”,
funded by the European Commission under the
NextGeneration EU programme.
PNRR - M4C2 - I1.4, CN00000013 - ”ICSC –
Centro Nazionale di Ricerca in High Performance
Computing, Big Data and Quantum Computing”
- Spoke 8 ”In Silico medicine and Omics Data”,
both funded by the European Commission under the
NextGeneration EU programme.
The National Institute for Nuclear Physics (INFN)
within the next AIM (Artificial Intelligence in
Medicine: next steps) research project (INFN-
CSN5), https://www.pi.infn.it/aim.
The views and opinions expressed are those of the
authors only and do not necessarily reflect those of
the European Union or the European Commission.
Neither the European Union nor the European
Commission can be held responsible for them.
REFERENCES
Alsaihati, N., Solomon, J., McCrum, E., and Samei, E.
(2024). Development, validation, and application of
a generic image-based noise addition method for sim-
ulating reduced dose computed tomography images.
Medical Physics.
Barca., P., Palmas., F., Fantacci., M. E., and Caramella., D.
(2018). Evaluation of the adaptive statistical iterative
reconstruction algorithm in chest ct (computed tomog-
raphy) - a preliminary study toward its employment
in low dose applications, also in conjunction with cad
(computer aided detection). In Proceedings of the 11th
International Joint Conference on Biomedical Engi-
neering Systems and Technologies - AI4Health, pages
688–694. INSTICC, SciTePress.
Barca, P., Paolicchi, F., Aringhieri, G., Palmas, F., Marfisi,
D., Fantacci, M. E., Caramella, D., and Giannelli, M.
(2021). A comprehensive assessment of physical im-
age quality of five different scanners for head ct imag-
ing as clinically used at a single hospital centre—a
phantom study. PLoS One, 16(1):e0245374.
Chen, H., Zhang, Y., Kalra, M. K., Lin, F., Chen, Y.,
Liao, P., Zhou, J., and Wang, G. (2017). Low-dose
ct with a residual encoder-decoder convolutional neu-
ral network. IEEE transactions on medical imaging,
36(12):2524–2535.
Cui, S., Zhang, Y., Du, W., Wang, J., Kang, K., and Zhang,
L. (2023). Innovative noise extraction and denoising
in low-dose ct using a supervised deep learning frame-
work. Electronics, 13(16):3184.
Diwakar, M. and Kumar, M. (2018). A review on ct image
noise and its denoising. Biomedical Signal Processing
and Control, 42:73–88.
Han, M., Shim, H., and Baek, J. (2021). Low-dose ct de-
noising via convolutional neural network with an ob-
BIOIMAGING 2025 - 12th International Conference on Bioimaging
384

server loss function. Medical physics, 48(10):5727–
5742.
Jin, H., Yu, C., Gong, Z., Zheng, R., Zhao, Y., and Fu, Q.
(2023). Machine learning techniques for pulmonary
nodule computer-aided diagnosis using ct images: A
systematic review. Biomedical Signal Processing and
Control, 79:104104.
Kingma, D. P. (2014). Adam: A method for stochastic op-
timization. arXiv preprint arXiv:1412.6980.
Kubo, T., Ohno, Y., Nishino, M., Lin, P.-J., Gautam, S.,
Kauczor, H.-U., Hatabu, H., iLEAD Study Group,
et al. (2016). Low dose chest ct protocol (50
´
amas)
as a routine protocol for comprehensive assessment of
intrathoracic abnormality. European Journal of Radi-
ology Open, 3:86–94.
Lehtinen, J. (2018). Noise2noise: Learning image
restoration without clean data. arXiv preprint
arXiv:1803.04189.
Livingstone, R. S., Pradip, J., Dinakran, P. M., and Srikanth,
B. (2010). Radiation doses during chest examina-
tions using dose modulation techniques in multislice
ct scanner. Indian Journal of Radiology and Imaging,
20(2):154–157.
Mail, T. B. (2013). Catphan® 500 and 600 manual. The
Phantom Laboratory.
Massoumzadeh, P., Don, S., Hildebolt, C. F., Bae, K. T., and
Whiting, B. R. (2009). Validation of ct dose-reduction
simulation. Medical physics, 36(1):174–189.
McKee, B. J., Hashim, J. A., French, R. J., McKee, A. B.,
Hesketh, P. J., Lamb, C. R., Williamson, C., Flacke,
S., and Wald, C. (2016). Experience with a ct screen-
ing program for individuals at high risk for developing
lung cancer. Journal of the American College of Ra-
diology, 13(2):R8–R13.
Mentl, K., Mailh
´
e, B., Ghesu, F. C., Schebesch, F., Hader-
lein, T., Maier, A., and Nadar, M. S. (2017). Noise re-
duction in low-dose ct using a 3d multiscale sparse de-
noising autoencoder. In 2017 IEEE 27th International
Workshop on Machine Learning for Signal Processing
(MLSP), pages 1–6. IEEE.
Sadia, R. T., Chen, J., and Zhang, J. (2024). Ct image de-
noising methods for image quality improvement and
radiation dose reduction. Journal of Applied Clinical
Medical Physics, 25(2):e14270.
Samei, E., Bakalyar, D., Boedeker, K. L., Brady, S., Fan, J.,
Leng, S., Myers, K. J., Popescu, L. M., Ramirez Gi-
raldo, J. C., Ranallo, F., et al. (2019). Performance
evaluation of computed tomography systems: sum-
mary of aapm task group 233. Medical physics,
46(11):e735–e756.
Scapicchio, C., Imbriani, M., Lizzi, F., Quattrocchi, M.,
Retico, A., Saponaro, S., Tenerani, M. I., Tofani, A.,
Zafaranchi, A., and Fantacci, M. E. (2024a). Char-
acterization and quantification of image quality in
ct imaging systems: A phantom study. Proceed-
ings of the 17th International Joint Conference on
Biomedical Engineering Systems and Technologies -
BIOIMAGING.
Scapicchio, C., Imbriani, M., Lizzi, F., Quattrocchi, M.,
Retico, A., Saponaro, S., Tenerani, M. I., Tofani, A.,
Zafaranchi, A., and Fantacci, M. E. (2024b). Inves-
tigation of a potential upstream harmonization based
on image appearance matching to improve radiomics
features robustness: a phantom study. Biomedical
Physics & Engineering Express, 10(4):045006.
Team, N. L. S. T. R. (2011). Reduced lung-cancer mortality
with low-dose computed tomographic screening. New
England Journal of Medicine, 365(5):395–409.
Wang, Z., Bovik, A. C., Sheikh, H. R., and Simoncelli, E. P.
(2004). Image quality assessment: From error visi-
bility to structural similarity. IEEE Transactions on
Image Processing, 13(4):600–612.
Wolf, A. M., Oeffinger, K. C., Shih, T. Y.-C., Walter, L. C.,
Church, T. R., Fontham, E. T., Elkin, E. B., Etzioni,
R. D., Guerra, C. E., Perkins, R. B., et al. (2024).
Screening for lung cancer: 2023 guideline update
from the american cancer society. CA: A Cancer Jour-
nal for Clinicians, 74(1):50–81.
Zhao, H., Gallo, O., Frosio, I., and Kautz, J. (2017).
Loss functions for image restoration with neural net-
works. IEEE Transactions on Computational Imag-
ing, 3(1):47–57.
Deep Learning Denoising of Low-Dose Computed Tomography Using Convolutional Autoencoder: A Phantom Study
385
