
GLOW-ENV: A Dual-Data IoE-Based Approach for Integrating Glucose
and Environmental Data into a Diabetes Recommendation System
Juan F. Gait
´
an-Guerrero
1 a
, Carmen Mart
´
ınez-Cruz
2 b
, Jos
´
e L. L
´
opez
1 c
, Francisco Mata-Mata
1 d
,
Luis G. P
´
erez-Cord
´
on
1 e
, Jos
´
e-Mar
´
ıa Serrano
1 f
, Juana M. Morcillo-Mart
´
ınez
3 g
,
´
Angeles Verdejo-Espinosa
4 h
, Juan C. Cuevas-Mart
´
ınez
5 i
, Raquel Viciana-Abad
5 j
,
Pedro J. Reche-L
´
opez
5 k
, Jos
´
e M. P
´
erez-Lorenzo
5 l
, David D
´
ıaz-Jim
´
enez
1 m
and
Macarena Espinilla
1 n
1
Department of Computer Science, University of Ja
´
en, 23071, Ja
´
en, Spain
2
Department of Languages and Computer Systems, University of Granada, 18071, Granada, Spain
3
Psycology Department, Faculty of Social Work, University of Ja
´
en, 23071 Ja
´
en, Spain
4
Electrical Engineering Department, University of Ja
´
en, 23071 Ja
´
en, Spain
5
Telecommunication Engineering Department, University of Ja
´
en, 23071 Ja
´
en, Spain
Keywords:
Internet of Everything, Diabetes, Continuous Glucose Monitoring, Environmental Factors, Artificial
Intelligence Models, Recommendation Systems, Mobile Health Applications, eHealth, Healthcare
Information Systems.
Abstract:
This paper introduces GLOW-ENV, an intelligent Internet of Everything (IoE)-driven mobile application de-
signed with the objective of integrating real-time glucose monitoring data and environmental metrics to en-
hance diabetes care and management. The proposed IoE ecosystem integrates a continuous glucose monitoring
with a personalized Artificial Intelligence model designed to predict glycemic fluctuations in a near-future. Ad-
ditionally, GLOW-ENV integrates a rule-based recommendation system to dynamically adapt its suggestions
based on contextual glucose and environmental data. This framework advances personalized diabetes care,
contributing to their progression and well-being offering valuable insights and improving decision-making.
1 INTRODUCTION
Diabetes diagnosis has emerged in recent decades,
positioning it as a global concern within societies in
a
https://orcid.org/0009-0007-6872-1401
b
https://orcid.org/0000-0002-8117-0647
c
https://orcid.org/0000-0003-2583-8638
d
https://orcid.org/0000-0001-6099-0016
e
https://orcid.org/0000-0002-0753-6460
f
https://orcid.org/0000-0001-5046-0724
g
https://orcid.org/0000-0002-5271-6145
h
https://orcid.org/0000-0002-7998-553X
i
https://orcid.org/0000-0003-3749-5986
j
https://orcid.org/0000-0003-2545-7229
k
https://orcid.org/0000-0002-5417-3551
l
https://orcid.org/0000-0002-5286-8026
m
https://orcid.org/0000-0003-1791-4258
n
https://orcid.org/0000-0003-1118-7782
general, due to the profound risk factors that are de-
rived from it. According to the International Diabetes
Federation (IDF), this disease is medically defined
as a chronic condition that appears by the time the
pancreas is no longer capable of producing insulin or
when the body is unable to manage it in a proper man-
ner (International Diabetes Federation, 2024). Essen-
tially, there are three main different ways in which
diabetes can be classified. First, type 1 diabetes is the
condition of the disease that might be developed at
any time while requiring insulin supply to guarantee
patients’ survival. Type 2 diabetes is the one that is
more often diagnosed in adults, accounting for nearly
90% of all diabetes cases. Last but not least, ges-
tational diabetes appears by the time high glycemia
values are registered during pregnancy, whose conse-
quences might be reflected on both, the mother and
child. In any form, statistics are critical; the IDF has
reported that there are around 537 million adults that
Gaitán-Guerrero, J. F., Martínez-Cruz, C., López, J. L., Mata-Mata, F., Pérez-Cordón, L. G., Serrano, J.-M., Morcillo-Martínez, J. M., Verdejo-Espinosa, Á., Cuevas-Martínez, J. C.,
Viciana-Abad, R., Reche-López, P. J., Pérez-Lorenzo, J. M., Díaz-Jiménez, D. and Espinilla, M.
GLOW-ENV: A Dual-Data IoE-Based Approach for Integrating Glucose and Environmental Data into a Diabetes Recommendation System.
DOI: 10.5220/0013307100003911
Paper published under CC license (CC BY-NC-ND 4.0)
In Proceedings of the 18th International Joint Conference on Biomedical Engineering Systems and Technologies (BIOSTEC 2025) - Volume 2: HEALTHINF, pages 797-804
ISBN: 978-989-758-731-3; ISSN: 2184-4305
Proceedings Copyright © 2025 by SCITEPRESS – Science and Technology Publications, Lda.
797

are currently suffering from diabetes –3 in 4 adults
live in low- and middle-income countries–, a number
that is expected to rise in the upcoming years.
In parallel, the society has witnessed an impres-
sive flow of information generated through the uti-
lization of technologies such as the Internet of Things
(IoT), as characterized by the capacity of characteriz-
ing different phenomena that can be monitored. Ad-
ditionally, the reduction in the cost of devices and
storage components has paved the way to a social
panorama of massive interconnection, with a growing
use of the IoT technology that often goes unnoticed
in the environment. Many different and diverse fields
have taken advantage of this paradigm. Specifically,
in the healthcare realm, sensors are acquiring a no-
table importance in human beings’ safeguarding and
care. The information retrieved by this sort of sys-
tems is of high value and risk, not only for the need to
ensure data privacy and safety, but also for the thor-
ough treatment of the information, with the objective
of not comprising the health state or the well-being of
the patients involved. Different applications are being
developed and some are cited next: hospital bed oc-
cupancy for accelerating the process of taking patients
from the emergency room to an inpatient unit (Affleck
et al., 2013), vital signs monitoring to prevent future
complications (Chakraborty et al., 2020), or activity
recognition approaches like (Schmitter-Edgecombe
et al., 2024), (Lupi
´
on et al., 2020) and (L
´
opez Ruiz
et al., 2024). Beyond this, the intersection of people,
processes, data and things is named after the Internet
of Everything (IoE), materializing by the time real-
time data coming from different and diverse sensors
is processed to aid “automated and people-based pro-
cesses” (Bradley et al., 2013).
In the domain of diabetes, commonly used de-
vices refer to traditional glucometers. This instru-
ments consists of a the device, a lancet with a needle,
and a test strip. Therefore, the objective is to mea-
sure capillary blood glucose carrying out a tap over
the patient’s finger, extracting a drop of blood, plac-
ing it on the test strip to measure the level of glucose
using the device. This process is characterized to be
harmful, while necessitating the repetition of it many
different times to be able to fully observed glycemic
dynamics. As a consequence, technological advance-
ments have paved the way for developing continuous
glucose monitoring sensors. These devices are capa-
ble of solving the problem of the traditional ones, by
their application over the patient skin to sample the
glucose level from the interstitial fluid. This measure-
ment is performed through the utilization of a filament
from which an enzymatic reaction takes place to gen-
erate the glucose value. An example of this sensor
is the Freestyle Libre 3 device (Abbott, 2022), which
has been observed to be used widely in the diabetic
population, or other similar versions.
Beyond this, glucose monitoring has allowed re-
searchers to further investigate in glucose fluctua-
tions, in a attempt to better understand patients’ dy-
namics, rather than assuming only those factors that
are directly associated to a patient’s daily life (e.g.:
physical effort, insulin administration or food intake).
In these sense, different approaches evolve the study
evaluation of the correlation between weather and en-
vironmental factors on people suffering from, or in
the risk of, type 1 diabetes, type 2 diabetes or gesta-
tional diabetes. The main purpose of these proposals
is to potentially determine how external factors varies
blood glucose concentration, or even how the body
performs when being exposed to certain contextual
circumstances. According to type 1 diabetes, (Chi-
acchiaretta et al., 2024) determine that there is neg-
ative correlation between temperature and blood glu-
cose levels, being even more pronounced in extreme
heat conditions; a seasonal variation is observed de-
riving in stating that glycemia is more likely to be
stable in hotter months with an increased risk of hy-
poglycemia, while showing higher variability during
colder months, being the latter correlated to a higher
risk of hyperglycemia. These findings are also at-
tested by (Vodrahalli et al., 2023) and (Richardson
et al., 2020) in the case of type 2 diabetes patients.
The findings sustain that these patients are also af-
fected by environmental factors like temperature and
air quality, showing that high temperatures enhance
glucose absorption while air pollution might worse
glucose metabolism under certain conditions, by in-
creasing insulin resistance (Vallianou et al., 2021).
Gestational diabetes and environmental risk factors
are addressed in (Preston et al., 2020) or (Elshahidi,
2019), where it is highlighted how elevated ambient
temperatures are associated with increased odds of
this condition. Taken together, these works acclaim
the need for developing a decision support system that
continuously inform diabetic patients about the ambi-
ent exposure they might experienced, together with
the possible actions to take to prevent potential con-
sequences.
Alongside these advancements, healthcare in-
formation technology systems are essential to pro-
vide personalized care and attention over the mon-
itored patients Consequently, different approaches
have been developed to continuously monitor glu-
cose. (Murakami et al., 2006) proposes the develop-
ment of a system capable of being implemented in
cardiac patients in the intensive care unit, establish-
ing a client-server architecture. (Helal et al., 2009)
HEALTHINF 2025 - 18th International Conference on Health Informatics
798

propose the design of a smart home-based platform to
monitor, analyze and even alter patient behaviors, im-
proving healthcare efficiency through IoT devices. To
the best of our knowledge, there is no technological
platform that supply diabetic populations with a mon-
itoring tool that suggest actionable behavior based on
glucose and ambient data. Nonetheless, these valu-
able digital tools are the premises of the main contri-
butions of this work:
1. Definition of an IoE-based real-time monitoring
architecture for information data retrieval of pa-
tients’ glycemia and environmental conditions.
2. Construction of a simplified artificial neural net-
work model to predict glucose values in a near-
future, being tailored to a concrete patient.
3. Establishment of a predefined rule-based recom-
mendation system integrating IoT devices data to
enhanced diabetic patients’ quality of life.
The rest of this paper is organized as follows. Sec-
tion 2 describes the designed architecture, together
with the procedures associated to it, a step-by-step de-
scription of the system developed. While Section 3
briefly evolves the interaction between the end-user
and the graphical interface of the monitoring frame-
work in the form of a mobile application, Section 4
contemplates the limitations of it and the future direc-
tions that may apply. Finally, Section 5 includes the
concluding remarks of this proposal.
2 IoE ECOSYSTEM
ARCHITECTURE DESIGN
This section is dedicated to the specification of all in-
terconnected components of the IoE architecture de-
veloped. All of comprised elements come to the res-
cue after reviewing the different approaches and find-
ings found in the literature. Therefore, the proposed
system aims to promote the development of a recom-
mendation system for diabetic patients based on en-
vironmental and continuous glucose monitoring data,
both in real-time, providing a clear and straightfor-
ward response based on the observed phenomena.
In this regard, this work first contemplates the def-
inition of a connection schema between a proprietary
server and the sensor for continuously monitor glu-
cose values. This process derives in the implemen-
tation of a RESTful API service that allows different
operations for further treatment of the collected data
(Section 2.1). With the purpose of not only provid-
ing the diabetic patient with an application capable
of graphing the observed glucose values, our system
Listing 1: Example of JSON formatted message from the
glucose sensor.
{
” i d ” : ” 6739 c e e 3978132 d f c 8 bca 3 0 a ” ,
” t i m e s t a m p ” : ” 1 7 3 1 8 4 1 7 6 3 7 4 1 ” ,
” s g v ” : 75 ,
” t y p e ” : ” sgv ” ,
” u t c O f f s e t ” : 6 0
}
opts for the utilization of these measures to generate
an Artificial Neural Network capable of predicting ex-
pected measures in a close future (Section 2.2). In
parallel, due to the different relationships established
in scientific research between glycemia dynamics and
environmental conditions, another connection is es-
tablished with an external API for this data retrieval
(Section 2.3). Ultimately, the developed application
gather all the knowledge obtained by processing the
raw data for establishing the recommendation that
should be communicated to the patient (Section 2.4).
The whole architecture is illustrated in Figure 1.
2.1 Device Layer and Operational
Workflow of the RESTful API
This layer concerns the glucose values sampling from
an IoT glucose sensor, acquiring a significant role in
providing a real-time solution in the domain handled
in this work. Recently commercialized sensors con-
sist of a filament or electrode for being placed subcu-
taneously, typically, on the upper arm of the patient.
These devices measure interstitial glucose, which dif-
fers from capillary glucose only in terms of a slight
delay during glycemia fluctuations; the system’s ar-
chitecture of this work is tested with the utilization of
the Freestyle Libre 3 sensor (Abbott, 2022). To per-
form the sampling, Bluetooth Low Energy (BLE) and
Near Field Communication technologies are needed,
together with a third-party application named xDrip+
and a smartphone.
In detail, the process is initiated by the time the
sensor is paired with a mobile device via NFC con-
nection, allowing for the interstitial glucose values
collection once the BLE connection becomes active.
Next, data transmission for its storage and process-
ing is performed by the xDrip+ application. The
latter allows for the implementation of a proprietary
RESTful API Service, enabling request-level proce-
dures without establishing a dependency on other
more restricted services that do not provide multi-
patient monitoring.
The data is provided in JSON-formatted messages
(see Listing 1), mainly containing the timestamp and
GLOW-ENV: A Dual-Data IoE-Based Approach for Integrating Glucose and Environmental Data into a Diabetes Recommendation System
799

API REST
send/request
return
Database
Data collection
running
+ NFC
response
request
response
request
GLOW-ENV APP
GRU Model
Rules
Proprietary server
Open-Meteo API
Figure 1: Description of the proposed system architecture.
the glucose value in mg/dL. The API service directly
communicates with the smartphone for data sampling
(GET) and the database (POST, GET) for persistent
storage and data consultation, being the latter mainly
used for its transfer to the application layer.
2.2 Artificial Neural Network for the
Prediction of Glucose Values
The storage of the samples in the database have al-
lowed for the obtaining of a large dataset compre-
hending glucose values for a single patient in a time
interval of 405 days
1
. At first, the validation of the
dataset in terms of validity and diversity is performed
through the computation of linguistic protoforms; dif-
ferent linguistic labels are defined to clearly observe
how different patterns and features appear along the
dataset. As a consequence, distinct membership func-
tions are defined for the linguistic labels associated
to temporal day intervals (see Table 1), glucose val-
ues (see Table 2; values are specified according to the
WHO (World Health Organization, 2024)), and quan-
tifiers (see Table 3). This procedure takes advantage
of the Fuzzy Logic (Zadeh and Aliev, 2018) theory.
Table 1: Specification of the different linguistic labels for
temporal day intervals (in hours).
Day interval labels Membership Function
At night z-shape(−∞, −∞, 6, 8)
In the morning trapmf(6, 8, 12, 2)
In the afternoon trapmf(12, 2, 8, 10)
At the end of day s-shape(8, 10, ∞, ∞)
During the daytime s-shape(7, 9, ∞, ∞)
The different linguistic labels permit the creation
of type 2 protoforms in the form R (day interval la-
bel) Q (quantifier) glucose values are S (glucose la-
bel). The activation of the protoform within the ana-
lyzed time series comes from Equation 1 as specified
1
This dataset is available in
https://zenodo.org/records/10713570
Table 2: Specification of the different linguistic labels for
glucose registered values.
Glucose label Membership Function
Low z-shape(−∞, −∞, 75, 80)
Medium trapmf(75, 80, 125, 140)
High s-shape(125, 140, ∞, ∞)
Table 3: Specification of linguistic labels for quantifiers.
Quantifier label Membership Function
Few s-shape(10, 30, ∞, ∞)
Many s-shape(40, 60, ∞, ∞)
Most s-shape(60, 80, ∞, ∞)
Almost all s-shape(80, 100, ∞, ∞)
in (Zadeh and Aliev, 2018) (note that µ represent the
distinct membership functions).
θ(R , Q , A , S) = max
µ
q
∑
i
(µ
r
∗ µ
s
)(c
i
)
∑
i
µ
r
(c
i
)
, (1)
where c
i
corresponds to the evaluated instance of the
dataset and ∗ denotes minimum.
As a result, it has been observed that nearly the
92% of all possible protoforms are activated, ensuring
the diversity of the individuals in the dataset. At this
point, it must be highlighted that a 15% of the time
series are excluded from the dataset in order to test the
final generated outputs within the system, also based
on protoform activation and pattern identification as
attested by (Martinez-Cruz et al., 2021) or (Pel
´
aez-
Aguilera et al., 2019).
The selected model to predict glucose values in
a close future is a recurrent neural network, particu-
larly, a Gated Recurrent Unit (GRU), due to its capac-
ity to combine an update and a reset gate to control the
flow of information. This kind of neural networks ne-
cessitate fewer parameters, being simpler and faster
to train than other models. Additionally, as glucose
time series data may exhibit rapid fluctuations accord-
ing to different activities (e.g.: food ingestion, insulin
supply, weather conditions and/or physical activity), a
GRU architecture can effectively capture without the
HEALTHINF 2025 - 18th International Conference on Health Informatics
800
need of a more complex one. Furthermore, the con-
sideration of the final model to be intended for mobile
devices, derives in efficiency as a key feature to look
up a this stage. Then, the proposed recurrent neural
network is established in Algorithm 1.
Algorithm 1: GRU Model for Glucose Time Series Fore-
casting.
Data: X = {x
1
, x
2
, . . . , x
T
}: Time series
Result: ˆy
t
: Predicted glucose values
Parameters: Window size w, GRU units
u
1
, u
2
, dropout rate p, learning rate α;
X
t
= {x
t
, x
t+1
, . . . , x
t+w−1
}, y
t
= x
t+w
X
train
, X
val
, X
test
with ratios r, s, t
h
t
= GRU(X
t
, u
1
), h
t
∈ R
u
1
h
′
t
= GRU(h
t
, u
2
), h
′
t
∈ R
u
2
h
′′
t
= Dropout(h
′
t
, p)
ˆy
t
= Dense(h
′′
t
)
optimizer(α)
Loss function: L =
1
N
∑
N
i=1
(y
i
− ˆy
i
)
2
Minimize: min
θ
E
(X
train
,y
train
)
[L ]
Validation loss: L
val
= E
(X
val
,y
val
)
[L ]
Test loss: L
test
= E
(X
test
,y
test
)
[L ]
Firstly, the hyperparameters are defined in terms
of the number of samples used for prediction (win-
dow size), the dropout rate for reducing overfitting
by randomly deactivating a fraction of neurons dur-
ing training, and the learning rate to control the con-
vergence while avoiding local optima; the GRU units
correspond to the number of neurons in the first, the
second and successive layers within the network. Af-
ter that, the dataset is split into three subsets, which
refer to the training (70%), validation (15%) and test
(15%) datasets, respectively. The model then starts
to be constructed by the definition of the first GRU
layer, used to transform the input data to capture tem-
poral dependencies within it; the second one performs
a further processing with a reduced dimensionality, to
extract deeper temporal dynamics in data. Finally, a
dropout layer is employed to prevent overfitting by
deactivating some neurons prior to the final prediction
of the glucose values. In this process, the Amam Op-
timizer is employed alongside the loss function, the
minimization of the loss function, and the validation
loss function to optimize the model parameters during
training.
As a result, the designed GRU model is expected
to estimate glucose values in a close future, by quanti-
fying and labeling them according to the membership
functions provided in Tables 1–2–3, with the objec-
tive of providing a clear message to the patient show-
ing the expected values to happen.
An experimental process have been carried out to
determine the specifications of the final model. Con-
cretely, this work implements the GRU model incor-
porating two layers with 64 and 32 units, respectively,
followed by a dropout layer with a rate of 40% to mit-
igate overfitting. The Adam optimizer is applied with
an initial learning rate of 0.001, and the mean squared
error (MSE) is selected as the loss function. The train-
ing process runs for a maximum of 35 epochs with
early stopping set to a patience of 10 epochs and a
learning rate reduction factor of 0.5 when improve-
ments are no longer seen.
The final model setup results of training demon-
strate a substantial reduction in both the training and
validation losses over the 35 epochs, highlighting the
GRU model’s ability to effectively learn temporal de-
pendencies and patterns in the dataset. The train-
ing loss began at 8384.49 and steadily decreased to
366.72 by the final epoch, while the validation loss
showed a similar trend, reducing from 8303.06 to
239.60. Both metrics are stable after approximately
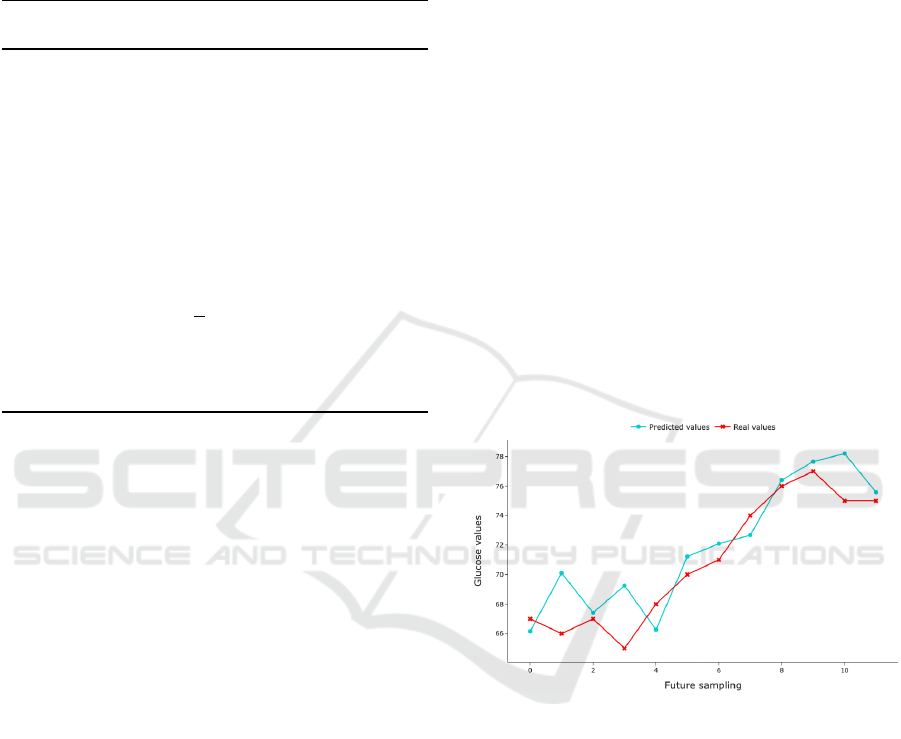
20 epochs. An output example is graphically shown
in Figure 2 for the prediction of one hour values, as
each sample is expected every 5 minutes.
Figure 2: GRU model performance in predicting glucose
values.
The results reveal how the model can effectively
capture the general trend of the future values. Even
though notable deviations may occur, it must be clari-
fied that further improvement of the model is not con-
sidered necessary as the expected and real values are
established within the same label (Table 2), thereby
not necessitating higher complexity.
2.3 Environmental Data Collection
In this section, the environmental data corresponding
to the temperature and the air quality is collected. As
the nature of these phenomena reveals little variation
in their recordings in a near future, the data utilized is
the one that is present in the moment when the request
GLOW-ENV: A Dual-Data IoE-Based Approach for Integrating Glucose and Environmental Data into a Diabetes Recommendation System
801

Listing 2: Example of JSON Response from Open-Meteo.
{
” l a t i t u d e ” : 40 . 4 3 7 5 ,
” l o n g i t u d e ” : −3 . 6 8 7 5 ,
” t i m e z o n e ” : ”GMT” ,
” h o u r l y u n i t s ” : {
” t e m p e r a t u r e 2m” : ” degC” ,
”pm10 ” : ”mu−g /mˆ 3 ” ,
”pm2 5 ” : ”mu−g /mˆ 3 ”
} ,
” h o u r l y ” : {
” t i m e ” : [
” 2024−11−03T00 : 0 0 ”
] ,
” t e m p e r a t u r e 2m” : [
16 . 3
]
}
}
is made, in contrary to what happens with glycemia,
due to its fast fluctuation according to both, internal
and external factors of the patient.
To achieve this, the Open-Meteo API (Open-
Meteo, 2024a) has been selected for the real-time
environmental data retrieval. This API provides ac-
cess to different environmental phenomena, including
weather and air quality, providing the users the ca-
pability to request both, historical and real-time data,
making it an ideal choice for this study, as being pro-
vided for non-commercial use, including the utiliza-
tion of the service for public research (Open-Meteo,
2024b). For a better understanding of outdoor condi-
tions on behalf of diabetic patients, as specified in the
literature review, Open-Meteo API incorporates the
metrics of temperature, PM10 and PM2.5 (the latter
ones corresponding to air-suspended particles), which
influence in patient health, if being exposed for a con-
siderable amount of time. The data collection pro-
cess involves constructing requests with different pa-
rameters. In our case, the utilized ones are related to
the geographic coordinates of the patient (latitude and
longitude) the date and the metrics of interest. These
requests return structured JSON responses, detailing
hourly values for the chosen variables. A sample re-
sponse is presented below:
From this output, the metrics data is filtered to fo-
cus on the recordings that allows a real-time response.
For air quality, PM10 and PM2.5 values are analyzed
to determine the category (i.e.: “good”, “fair”, “un-
health” or “extreme”) based on established thresh-
olds (Sloss and Smith, 2000). On the other hand,
temperature is represented as low, normal or high. At
last, all metrics together, i.e. glucose levels, air par-
ticles and temperature, derives in the generation of a
rule-based recommendation system.
2.4 Application Layer
This layer may be consider the core of the system,
responsible for performing the execution of the neu-
ral network model and the rule-based recommenda-
tion system. In detail, the application located in the
patient’s smartphone is capable of connecting to the
RESTful API service developed for glucose values
retrieval, serving as an input for the prediction model
that is stored locally. This last decision has been made
considering that each patient, due to the simple de-
signed of the network, could be provided with a tai-
lored model, reducing server dependency and satura-
tion in a context of multi-patient monitoring. Along-
side this connection, the application is also able to re-
quest environmental data from the proposed API ser-
vice. Through the combination of these components,
the application layer dynamically adapts its glucose
predictions and personalized recommendations, aim-
ing to ensure context-aware guidance for users.
According to the application view (see Figure 3),
it can be observed how the patient is capable of ob-
serving the collected glucose values in real-time, be-
ing able to interact with his/her glycemic dynamics.
Followed by the graphical representation of the raw
data, a message is provided to the patient, based on
the results thrown by the GRU model for a near-
future prediction of 1 hour, which are subsequently
processed through fuzzy labeling and quantification.
Next, the air quality and temperature data is shown,
both in a quantitative and a qualitative manner, to
make it easier and faster to understand. Based on all
the information gathered, a final message is given to
the diabetic patient as a recommendation, according
to the literature review and expert knowledge.
3 USER WORKFLOW
In this section, the interaction of the user with the
whole system’s architecture is addressed.
On the one hand, the patient must request access
to the API service for glucose sampling. Therefore,
he/she can be provided with an URL that is neces-
sary for sending the data via the mobile application
(xDrip+). Right after the patient has performed the
connection between the mobile device and the glu-
cose sensor, all the data collected is sent to the server
automatically, allowing for data consultation and re-
trieval through the proprietary API.
On the other hand, once the GLOW-ENV applica-
tion is also running on the patient’s device, as an user,
the person will be able to check the collected glucose
values and, the summarization of the expected one in
HEALTHINF 2025 - 18th International Conference on Health Informatics
802
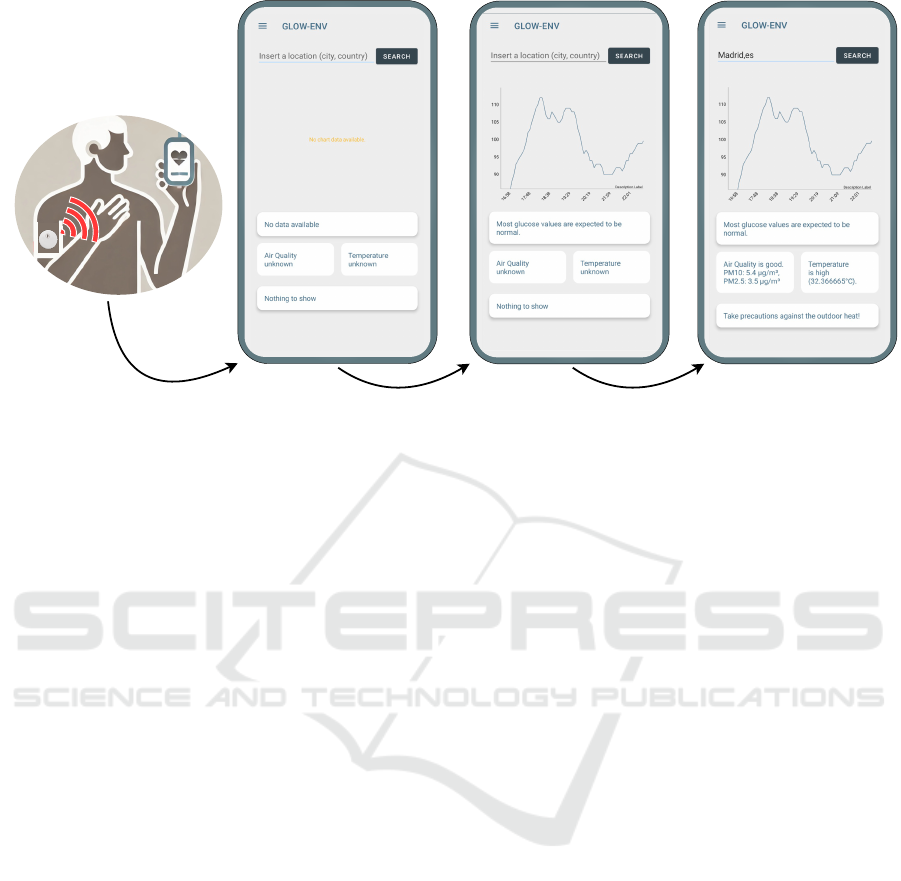
Patient is logged in
Glucose data is retrieved
Patient has chosen a location
Figure 3: Dashboard of the designed mobile application.
the future. At this point, the patient could type man-
ually his/her current location for environmental data
consultation, being provided with a recommendation
message at last (see Figure 3).
4 LIMITATIONS AND FUTURE
RESEARCH
Since this research aims to enhance the care of di-
abetic patients by promoting personalized, context-
based guidelines through API requests for data re-
trieval, fuzzy labeling and tailored Artificial Intelli-
gence models, it is evident that addressing the limita-
tions and future research in this topics is essential.
Regarding the API petitions, the real-time recom-
mendation system could incorporate location and date
parameters specification, thereby enabling patients to
perform a historical data analysis for a better under-
standing of past events. Additionally, the automation
of the latter mentioned parameters could improve the
system by incorporating an automatic alert function-
ality. Ending up with this point, it is considered inter-
esting to perform a data mining procedure to discover
new relationships between glycemia and environmen-
tal conditions.
Noticeably, the architecture heavily relies on
third-party API services for glucose data sampling
and environmental conditions retrieval, creating a de-
pendency that may introduce potential challenges due
to restrictions imposed by the external providers; ex-
ploring alternatives to reduce dependency on them is
a must in the future.
Lastly, future research could focus on developing
a federated system that integrates a more complex
model on the server side to improve glucose value
predictions, since the current system already incor-
porates local personalized models. Therefore, this
betterment could improve the accuracy of the predic-
tions, which may be required by the time the patient
monitoring integrates personal activities recordings
(f.i.: food ingestion, physical activity or medicine in-
take).
5 CONCLUSIONS
In this proposal, a new intelligent IoE-based mobile
application designed for glucose and environmental
data fusion is presented, with the objective of enhanc-
ing diabetes care, management and prevention.
The system’s architecture holds a sophisticated in-
terconnection of different devices and servers, facili-
tating the collection, processing, and analysis of dis-
tinct data streams. Glucose sampling does not require
direct patient interaction as being performed automat-
ically, while the environmental data will not be avail-
able prior to the specification of the parameters on
patients’ behalf. However, the combination of con-
tinuous glucose monitoring data with environmental
metrics, both in real-time, provides a context-aware
approach throughout the utilization of tailored predic-
tions and actionable insights.
GLOW-ENV: A Dual-Data IoE-Based Approach for Integrating Glucose and Environmental Data into a Diabetes Recommendation System
803

ACKNOWLEDGMENTS
This result has been partially supported
by grant PID2021-127275OB-I00, grant
PID2021-126363NB-I00 funded by MICI-
U/AEI/10.13039/501100011033 and by “ERDF
A way of making Europe”, grant PDC2023-145863-
I00 funded by MICIU/AEI/10.13039/501100011033
and by “European Union NextGenerationEU/PRTR”,
and grant M.2 PDC 000756 funded by Consejer
´
ıa
de Universidad, Investigaci
´
on e Innovaci
´
on and by
ERDF Andalusia Program 2021-2027.
REFERENCES
Abbott (2022). Sistema freestyle libre 3.
https://www.freestyle.abbott/es-es/productos/
freestylelibre-3.html. (Accessed on 11/10/2024).
Affleck, A., Parks, P., Drummond, A., Rowe, B. H., and
Ovens, H. J. (2013). Emergency department over-
crowding and access block. Canadian Journal of
Emergency Medicine, 15(6):359–370.
Bradley, J., Reberger, C., Dixit, A., Gupta, V., and
Macaulay, J. (2013). Internet of everything (ioe): top
10 insights from cisco’s ioe value at stake analysis for
the public sector. Economic Analysis, 1.
Chakraborty, S., Bhatt, V., and Chakravorty, T. (2020). Big-
data, iot wearable and mhealth cloud platform integra-
tion triads-a logical way to patient-health monitoring.
International Journal of Engineering and Advanced
Technology, 9(3):388–394.
Chiacchiaretta, P., Tumini, S., Mascitelli, A., Sacrini, L.,
Saltarelli, M. A., Carabotta, M., Osmelli, J., Di Carlo,
P., and Aruffo, E. (2024). The impact of atmospheric
temperature variations on glycaemic patterns in chil-
dren and young adults with type 1 diabetes. Climate,
12(8):121.
Elshahidi, M. H. (2019). Outdoor air pollution and ges-
tational diabetes mellitus: a systematic review and
meta-analysis. Iranian journal of public health,
48(1):9.
Helal, A., Cook, D. J., and Schmalz, M. (2009). Smart
home-based health platform for behavioral monitoring
and alteration of diabetes patients. Journal of diabetes
science and technology, 3(1):141–148.
International Diabetes Federation (2024). What is diabetes.
https://idf.org/about-diabetes/what-is-diabetes/. (Ac-
cessed on 11/09/2024).
L
´
opez Ruiz, J. L., Jim
´
enez Villar, J. M., Alb
´
ın Rodr
´
ıguez,
A. P., and Espinilla Estevez, M. (2024). Indoor area
location system using uwb technology and axis-linear
bounding boxes. In IEEE Congress on Evolutionary
Computation (IEEE CEC). IEEE Access.
Lupi
´
on, M., Redondo, J. L., Sanjuan, J. F., and Ortigosa,
P. M. (2020). Deployment of an iot platform for ac-
tivity recognition at the ual’s smart home. In Inter-
national Symposium on Ambient Intelligence, pages
82–92. Springer.
Martinez-Cruz, C., Rueda, A. J., Popescu, M., and Keller,
J. M. (2021). New linguistic description approach for
time series and its application to bed restlessness mon-
itoring for eldercare. IEEE Transactions on Fuzzy Sys-
tems, 30(4):1048–1059.
Murakami, A., Gutierrez, M., Lage, S., Rebelo, M.,
Guiraldelli, R., and Ramires, J. A. F. (2006). A con-
tinuous glucose monitoring system in critical cardiac
patients in the intensive care unit. In 2006 Computers
in Cardiology, pages 233–236. IEEE.
Open-Meteo (2024a). Free open-source weather api. https:
//open-meteo.com/. (Accessed on 10/31/2024).
Open-Meteo (2024b). Terms — open-meteo.com.
https://open-meteo.com/en/terms. (Accessed on
11/19/2024).
Pel
´
aez-Aguilera, M., Espinilla, M., Fern
´
andez, M., and
Medina, J. (2019). Fuzzy linguistic protoforms to
summarize heart rate streams of patients with is-
chemic heart disease. hindawi. Complexity.
Preston, E. V., Eberle, C., Brown, F. M., and James-Todd, T.
(2020). Climate factors and gestational diabetes mel-
litus risk–a systematic review. Environmental Health,
19:1–19.
Richardson, M. B., Chmielewski, C., Wu, C. Y., Evans,
M. B., McClure, L. A., Hosig, K. W., and Gohlke,
J. M. (2020). The effect of time spent outdoors during
summer on daily blood glucose and steps in women
with type 2 diabetes. Journal of behavioral medicine,
43:783–790.
Schmitter-Edgecombe, M., Luna, C., Dai, S., and Cook,
D. J. (2024). Predicting daily cognition and lifestyle
behaviors for older adults using smart home data and
ecological momentary assessment. The Clinical Neu-
ropsychologist, pages 1–25.
Sloss, L. L. and Smith, I. M. (2000). Pm10 and pm2. 5:
an international perspective. Fuel Processing Tech-
nology, 65:127–141.
Vallianou, N. G., Geladari, E. V., Kounatidis, D., Geladari,
C. V., Stratigou, T., Dourakis, S. P., Andreadis, E. A.,
and Dalamaga, M. (2021). Diabetes mellitus in the
era of climate change. Diabetes & Metabolism,
47(4):101205.
Vodrahalli, K., Lyng, G. D., Hill, B. L., Karkkainen, K.,
Hertzberg, J., Zou, J., and Halperin, E. (2023). Un-
derstanding and predicting the effect of environmental
factors on people with type 2 diabetes. In Conference
on Health, Inference, and Learning, pages 545–555.
PMLR.
World Health Organization (2024). Mean fast-
ing blood glucose. https://www.who.int/data/
gho/indicator-metadata-registry#:
∼
:text=Mean%
20fasting%20blood%20glucose. Accessed: 31
October 2024.
Zadeh, L. A. and Aliev, R. A. (2018). Fuzzy logic theory
and applications: part I and part II. World Scientific
Publishing.
HEALTHINF 2025 - 18th International Conference on Health Informatics
804
