
A Pre-Study on Tremor Classification During Activities of Daily Living
Linda B
¨
uker
a
, Sandra Hellmers
b
and Andreas Hein
c
Assistance Systems and Medical Device Technology, Department for Health Services Research,
School VI - School of Medicine and Health Sciences, Carl von Ossietzky Universit
¨
at Oldenburg,
Ammerl
¨
ander Heerstraße 114-118, 26129 Oldenburg, Germany
{linda.bueker, sandra.hellmers, andreas.hein}@uol.de
Keywords:
Tremor Classification, Inertial Measurement Units, Support Vector Machine, Activities of Daily Living.
Abstract:
Motor impairments, such as tremors, are often measured with specific tests or rating scales. As these have some
disadvantages, like an inter-rater reliability and a lack of representation of the everyday life, a sensor-based
continuous and objective monitoring of activities of daily living could be a suitable alternative. According
to the literature, the use of inertial measurement units attached to the tremor-dominant arm in combination
with support vector machines or neural networks seem to be promising. However, many approaches have
to be adapted individually. Therefore, we conducted a preliminary study with ten healthy participants, who
were asked to perform conventional and simulated tremor movements during five different activities related
to eating. These movements were recorded with inertial measurement units. We identified four different
parameters calculated from the recorded data, that we used to train multiple support vector machines for a
non-individualized approach. The overall median accuracy score was 0.75, which is comparable to the results
reported in the literature. This shows that support vector machines may be a non-individualized approach for
differentiating between tremor and non-tremor movements during activities of daily living.
1 INTRODUCTION
Motor impairment is an important indicator for the
early detection and monitoring of disease progression
in a number of conditions, including Parkinson’s dis-
ease, stroke, or multiple sclerosis. These motor im-
pairments are measured in a medical context, for ex-
ample, to either detecting them or determining the de-
gree of impairment. There are multiple tests for mea-
suring these impairments. The Action Research Arm
Test (ARAT), for example, is a standardized tool for
measuring the arm motor status in individuals who
have experienced a stroke (Yozbatiran et al., 2008).
The Unified Parkinson’s Disease Rating Scale (UP-
DRS) is frequently used for assessing the severity of
Parkinson’s disease (Goetz et al., 2008).
Even though these tests are used very frequently
and have many advantages, they come with a few dis-
advantages. These tests are unable to reflect possible
fluctuations throughout the day, as they are not a con-
tinuous measurement (Heldman et al., 2011). Further-
more, the test results may be biased due to inter-rater
a
https://orcid.org/0000-0002-6129-0940
b
https://orcid.org/0000-0002-1686-6752
c
https://orcid.org/0000-0001-8846-2282
reliability, with the clinician potentially influencing
the output (Heldman et al., 2011). In addition, it is
uncertain whether the test accurately reflects the limi-
tations encountered in everyday life. On the one hand,
the individuals may perform to a higher standard in a
test situation than they would in their everyday lives.
On the other hand, the exercises included in the test
may not fully cover the individually important every-
day movements of the individuals being tested.
As sensorimotor impairments correlate with activ-
ities of daily living (ADLs) (Shamay et al., 2011), par-
ticularly eating, which is one of the most affected ac-
tivities by a tremor (Heldman et al., 2011; Feys et al.,
2004), measurements during ADLs, especially eating,
could counteract some of the aforementioned disad-
vantages. To enable continuous and objective mon-
itoring, measurements could be conducted via sen-
sors. Soran et al. achieved an accuracy of 95.4% in
the detection of tremors using a camera as a sensor
and a support vector machine (SVM) for training pur-
poses (Soran et al., 2012). In the context of everyday
live, cameras could have two potential disadvantages:
firstly, that they are stationary, and secondly, that they
may violate the anonymity of individuals. In contrast,
inertial measurement units (IMUs) have the advan-
tage of mobility and greater anonymity. As IMUs
Büker, L., Hellmers, S. and Hein, A.
A Pre-Study on Tremor Classification During Activities of Daily Living.
DOI: 10.5220/0013307400003911
Paper published under CC license (CC BY-NC-ND 4.0)
In Proceedings of the 18th International Joint Conference on Biomedical Engineering Systems and Technologies (BIOSTEC 2025) - Volume 2: HEALTHINF, pages 805-812
ISBN: 978-989-758-731-3; ISSN: 2184-4305
Proceedings Copyright © 2025 by SCITEPRESS – Science and Technology Publications, Lda.
805

can capture the kinematics during ADLs in healthy
adults (Aguirre, 2016), they could be useful sensors
for monitoring. Additionally, IMUs can be used to es-
timate upper limb impairments after a stroke in ADLs
(Oubre and Lee, 2022). Furthermore, Thorp et al.
suggested that IMUs could be a promising approach
for detecting tremor in in-home settings (Thorp et al.,
2018).
There are multiple studies using IMUs or simi-
lar sensors to monitor ADLs: As demonstrated by
Schmidle et al., the analysis of IMU data during
ADLs can lead to conclusions regarding the frailty
status of the elderly (Schmidle et al., 2020). Gulde
et al. used an accelerometer, gyroscope, and pedome-
ter during daily routines of stroke patients, for ob-
taining information of stroke-related laterality (Gulde
et al., 2024). Heldman et al. used an IMU on the in-
dex finger during the everyday live to detect and clas-
sify tremors and to quantify tremor severity (Heldman
et al., 2011). Nevertheless, it is unclear whether the
placement of the sensor on the index finger is an op-
timal choice. As the sensor must not interfere with
the performance of the ADLs (Thorp et al., 2018).
Skaramagkas et al. demonstrated that training a SVM
on features derived from accelerometer data to distin-
guish between essential tremor, Parkinson’s tremor,
and no tremor works best on poses and movements
that are similar to ADL (Skaramagkas et al., 2021). In
their literature review, Thorp et al. also concluded that
Parkinson’s disease symptoms can be classified using
movement and muscle activity sensors with machine
learning. They found that IMU sensors in combina-
tion with neural networks appear to be particularly
promising for this purpose (Thorp et al., 2018).
Many algorithms need to be customized for each
individual, which is a major challenge for clinical use
(Thorp et al., 2018). Therefore, the aim of this pa-
per is to check whether a non-individualized approach
can be used across multiple individuals. This will
be demonstrated through the analysis of tremor/ no
tremor classification in ADLs using an IMU sensor
on the potential affected arm. For this purpose, a pre-
study will be conducted with healthy subjects simu-
lating tremor and moving in a conventional manner
while performing various eating activities, testing two
distinct IMU positions.
2 METHODS
2.1 Study Design
To generate a dataset containing both tremor and con-
ventional movements, we conducted a study with 10
healthy and young subjects (7 male, 3 female). The
subjects were seated in front of a table and performed
five different exercises. Each exercise was initially
performed in a conventional manner and then with a
simulated tremor in the dominant arm. For all sub-
jects, the dominant arm was the right arm. The five
exercises were as follows:
1. Hold an apple in the hand and bite into it.
2. Grasp a piece of cake with a fork and then eat it.
3. Cut a slice of bread with a knife.
4. Imitate to spread butter on a slice of bread with a
knife.
5. Consume soup with a spoon.
For the tremor condition, participants were instructed
to shake their dominant arm at a consistent frequency
while performing the exercise. Subsequent analysis
confirmed that the maximum frequency of 75% of
the recorded simulated tremors was between 4 and
12 Hz, which is consistent with the typical frequency
range for postural and kinetic tremors (Heldman et al.,
2011).
The subjects were equipped with two inertial mea-
surement units (Move4, Movisens). As stated in
(Thorp et al., 2018), the sensors should be positioned
on the (tremor-)dominant arm. Accordingly, one sen-
sor was attached to the upper arm and another to the
lower arm enabling a comparison of these two posi-
tions. Each IMU recorded data from an accelerometer
and a gyroscope at a frequency of 64 Hz. In addition,
the subjects were filmed by a camera (Azure Kinect
DK, Microsoft). An illustration of the study setup is
shown in Figure 1.
Figure 1: Illustration of the study setup. The participant was
seated at a table with the eating utensils positioned in front
of them. The camera was filming the scene from an angle.
The study was approved by the local ethics com-
mittee (ethical vote: Carl von Ossietzky Universit
¨
at
Oldenburg (Drs.EK/2024/022), and conducted in ac-
cordance with the Declaration of Helsinki.
2.2 Software Used
All data processing (data preprocessing, parameter
calculation, and analysis) was done on the same com-
HEALTHINF 2025 - 18th International Conference on Health Informatics
806

puter using Python (version 3.12.7). The most impor-
tant used packages were numpy (version 1.26.4), pan-
das (version 2.2.2), scikit-learn (version 1.5.1), and
matplotlib (version 3.9.2).
2.3 Data Preprocessing
Prior to data analysis, it was necessary to preprocess
the data. First, each exercise in the video data was
visually labeled. This was necessary in order to an-
alyze each exercise separately. As the start time was
known from both the videos and the IMU data, the
labeled time spans could be transferred to the IMU
data. However, the IMU data and the video data were
not recorded by the same computer, and the computer
clocks were not synchronized. Consequently, the time
spans must be shifted by seven seconds. To verify the
correct assignment of time spans, each subject’s IMU
data was visually compared to the video data.
The IMU data was then loaded into Python, with
each exercise correctly assigned to the data. Both the
accelerometer and gyroscope sensors provide data for
three axes separately. Therefore, the Euclidean norm
was calculated to obtain the total acceleration and an-
gular velocity. Additionally, the offset observed in
each sensor (along with the 1 g of gravity) was sub-
tracted from the data. These offsets were determined
prior to analysis.
2.4 Parameter Calculation
In order to detect a difference between a conventional
manner and a tremor, a number of parameters de-
rived from the accelerometer and gyroscope data were
calculated. There are multiple parameters found in
the literature, that are used for analyzing activities
of daily living. These include parameters to detect
stroke-related laterality (Gulde et al., 2024), to mea-
sure the frailty status (Schmidle et al., 2020) or to get
an upper limb functional status (Nam et al., 2022).
As it was unclear if these parameters could be used to
distinguish between tremors and conventional move-
ments, we decided to test multiple found parameters.
A list of the calculated parameters is provided in the
appendix (Table 3).
To identify the most important parameters, an
SVM with radial basis function as the kernel was
trained multiple times, with one participant left out
as test set for each SVM on the data of the upper arm.
The most important features were determined for each
run using the permutation importance method, that
determines the contribution of each feature to the per-
formance of the SVM. Subsequently, the four most
prominent features were identified across all runs.
The four parameters that were used in the following
analysis for both sensor positions are ”Peak Ratio Ac-
celeration”, ”Relative Activity Acceleration”, ”Peak
Ratio Angular Rate”, ”Number Peaks Angular Rate”.
The ”Peak Ratio Acceleration” (see (Schmidle
et al., 2020)) was defined as the ratio between the
number of peaks having a prominence of 0.2
m
s
2
or
higher and the total number of peaks found in the ac-
celeration data. This parameter was calculated with
the scikit-learn method find peaks:
PeakRatioAcc =
{i | prominence(acc
i
) ≥ 0.2
m
s
2
}
|
{i | i is a peak in acc}
|
(1)
The ”Relative Activity Acceleration” (see (Schmi-
dle et al., 2020)) was defined as the number of accel-
eration data points, where the absolute data points are
greater than 0.2
m
s
2
in relation to the total number of
data points:
RelativeActivityAcc =
{z ∈ acc | |z| > 0.2
m
s
2
}
|acc|
(2)
The ”Peak Ratio Angular Rate” (see (Gulde et al.,
2024)) represented the signal-to-noise ratio of the an-
gular velocity signal. It was calculated by the number
of peaks having a minimum prominence of 0.17
◦
s
di-
vided by the total number of peaks of the angular ve-
locity data. This parameter was also calculated using
the scikit-learn method find peaks:
PeakRatioGyro =
{i | prominence(gyro
i
) ≥ 0.17
◦
s
}
|
{i | i is a peak in gyro}
|
(3)
The ”Number Peaks Angular Rate” was defined
as the ratio of all peaks in angular rate data having a
minimum height of 1.05
◦
s
and all data points. This
calculation used the scikit-learn method find peaks:
NumberPeaksGyro =
{i | height(gyro
i
) ≥ 1.05
◦
s
}
|gyro|
(4)
The used thresholds for each parameter were pri-
marily derived from existing literature. After identi-
fying these four parameters, we attempted to optimize
the thresholds using Bayesian optimization. As the
results of the SVMs using the optimized thresholds
are comparable, we employed the aforementioned
thresholds from the literature for the subsequent anal-
ysis.
2.5 Analysis
The aim of this paper is to classify the calculated pa-
rameters into two distinct categories: conventional
A Pre-Study on Tremor Classification During Activities of Daily Living
807
movements and tremor movements. Initially, all pa-
rameters were visually analyzed to identify a poten-
tial threshold that might separate data from tremor
and conventional movements. This was conducted for
each calculated parameter and for all used sensors. In
addition, we analyzed the distribution of various pa-
rameters for each individual participant and for each
exercise.
In a second step, we applied machine learning for
the purpose of classification. Given the limited size
of the dataset, we have decided not to use neural net-
works. In the existing literature, SVMs were used fre-
quently (Soran et al., 2012; Skaramagkas et al., 2021).
Therefore, we trained multiple SVMs. In addition,
we attempted to train multiple Random Forest Clas-
sifiers. However, the results were slightly worse than
those obtained from the trained SVMs, and thus we
concentrated our analysis on the SVMs. For training
the multiple SVMs, the identified four most important
parameters (see Section 2.4) were used. The SVMs
were trained using scikit-learn SVC. For each sensor,
we trained SVMs, with four different kernels: linear,
radial basis function (rbf), polynomial (poly), and sig-
moid. All other SVC parameters were set to their
default values. For each SVM, cross-validation was
employed for training, using a StratifiedKFold with
ten splits and shuffle, and with accuracy serving as
the scoring metric as the accuracy was also given as
results in the literature (Soran et al., 2012; Skaram-
agkas et al., 2021). For each kernel, multiple SVMs
were trained with distinct train and test sets. The
data of two participants was consistently designated
as the testing set, while the remaining participants’
data served as the training set. This process was re-
peated for every possible combination of participants.
The performance of the SVMs was evaluated based
on the accuracy, recall, precision, and F1 scores ob-
tained from all runs of each used kernel.
All analysis steps were done on both sensors, up-
per and lower arm, to compare these two positions.
3 RESULTS
Due to the malfunction of the camera during the video
recording of one participant, which made it impossi-
ble to recognize the different exercises, the data from
nine participants could be evaluated. In addition, one
participant did not perform the cutting exercise (exer-
cise 3) with a simulated tremor. Therefore, the dataset
contained 45 conventional exercise performances and
44 simulated tremor exercise performances.
As described in Section 2.5, we analyzed all
parameter values visually to determine whether the
tremor and conventional movements could be distin-
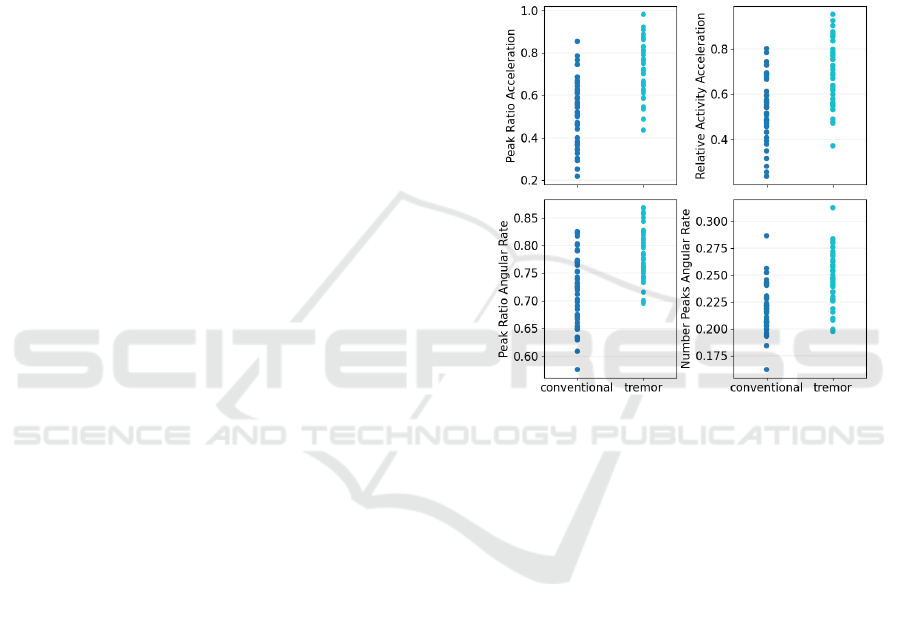
guished. Figure 2 shows the four parameters from
Equations 1 to 4 that were used for training the SVM,
calculated for the right upper arm. The parameter val-
ues for all nine participants and all five exercises (re-
sulting in 45 and 44 values for conventional move-
ment and simulated tremor, respectively) are shown.
No clear threshold could be identified for the individ-
ual parameters to separate conventional and simulated
tremor data. This behavior was observed consistently
across all other parameters and sensor positions.
Figure 2: The parameter values for all four used parameters,
divided for conventional manner and simulated tremor. The
plotted data represent the values for all participants and all
exercises. The data are presented for the upper arm.
Furthermore, the distribution of two out of the
four used parameters for each exercise and each par-
ticipant, calculated on the upper arm data, is shown
in Figure 3 and Figure 4, respectively. Figure 3
shows that some conventional performances (repre-
sented by a cross) of exercises eating an apple (1)
and cutting bread (3) were distributed more in the
cluster representing the tremor performances (repre-
sented by a circle). Figure 4a shows that some perfor-
mances of participant 0 with a simulated tremor were
closely aligned with the cluster representing conven-
tional movements (depicted by blue circles on the
left). In addition, the conventional movements of par-
ticipant 5 (illustrated by brown crosses in Figure 4b)
tended towards higher parameter values than the other
participants.
Furthermore, multiple SVMs were trained for four
different kernels and different train and test sets. Ta-
ble 1 shows the minimum, maximum, median, and
standard deviation of accuracy, recall, precision, and
F1 scores for all four kernels, calculated on all splits
HEALTHINF 2025 - 18th International Conference on Health Informatics
808
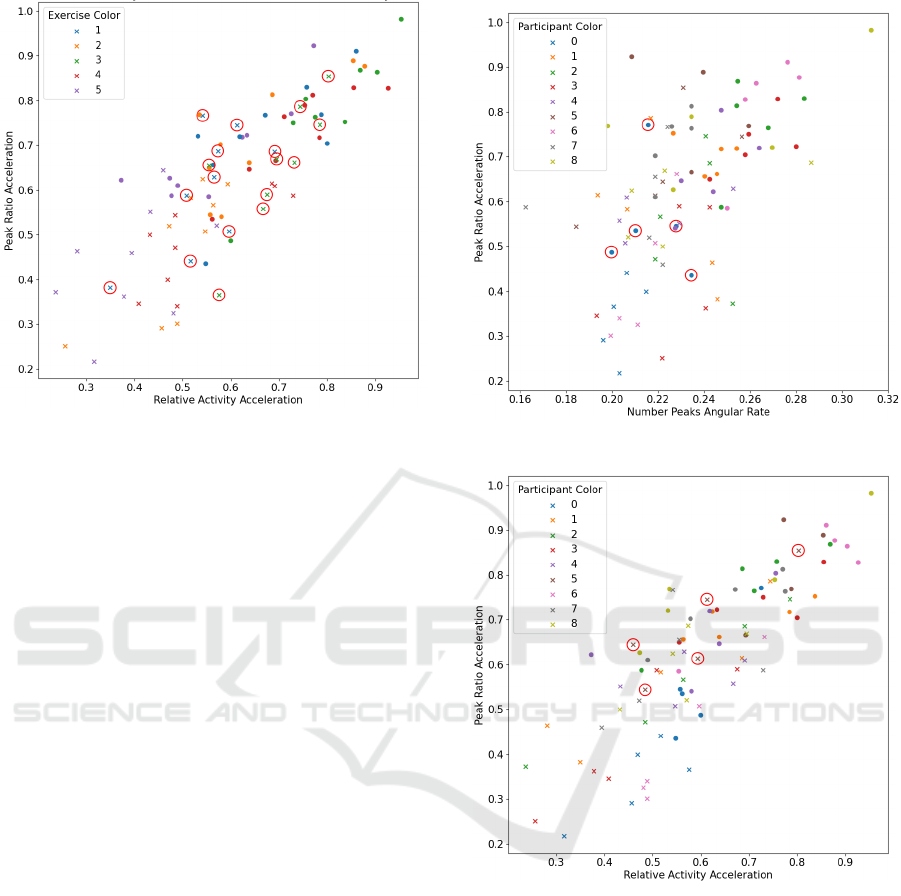
Figure 3: Scatter plot of two out of the four used param-
eters. The color represents the five different exercises eat-
ing an apple (1), eating with a fork (2), cutting a bread (3),
spreading butter (4), and eating soup (5). A cross represents
a performance in a conventional manner while a circle rep-
resents a performance with a simulated tremor. Red circles
highlight performances of exercises 1 and 3 with conven-
tional movements. The data are presented for the upper arm.
of the train and test sets. These values are for the sen-
sor attached to the upper arm. The median accuracy
was 0.75 for all kernels, while the median F1 score
ranged from 0.72 (sigmoid) to 0.79 (poly). In com-
parison, the metrics for the lower arm are shown in
Table 2. Here, the median accuracy ranged from 0.60
(poly) to 0.65 (linear and rbf), while the median F1
score ranged from 0.63 (rbf and poly) to 0.67 (linear
and sigmoid).
4 DISCUSSION
Upon visual analysis of the parameter values, we
could not identify thresholds that would differenti-
ate the values between conventional movements and
movements with a simulated tremor. Therefore, there
does not seem to be a clear distinction between the
two behaviors across all participants. The distribution
of the individual participants across the parameters in
Figure 4 also demonstrated that there are differences
between individuals. These observations align with
those of Thorp et al., indicating that most algorithms
require individual thresholds for individual persons
(Thorp et al., 2018).
The trained SVMs showed that a distinction be-
tween conventional movements and tremor yielded
to better outcome when a sensor was positioned at
the upper arm in comparison to the lower arm. This
(a) Red circles highlight performances of participant 0 with
a simulated tremor.
(b) Red circles highlight performances of participant 5 with
conventional movements.
Figure 4: Two scatter plots, each showing two out of the
four used parameters. The color represents the nine differ-
ent participants. A cross represents a performance in a con-
ventional manner while a circle represents a performance
with a simulated tremor. The data are presented for the up-
per arm.
is particularly interesting, as the videos indicate that
the participants tended to present more noticeable
tremors in their lower arms than in their upper arms.
Given the considerable discrepancy in scores be-
tween the different splits of train and test sets, we
have conducted a more detailed analysis of the test
sets with accuracy scores below or equal to 0.6. It is
striking that participant 5 had primarily recall scores
A Pre-Study on Tremor Classification During Activities of Daily Living
809

Table 1: The minimum (Min), maximum (Max), median,
and standard deviation (Std) of the accuracy, recall, preci-
sion, and F1 scores for all test sets of the trained support
vector machines separated by the four different kernel types
linear, rbf, poly, and sigmoid. The data are presented for the
upper arm.
SVM kernel
linear rbf poly sigmoid
Accuracy
Min 0.58 0.58 0.63 0.55
Max 0.95 0.95 0.90 0.90
Median 0.75 0.75 0.75 0.75
Std 0.09 0.10 0.06 0.08
Recall
Min 0.40 0.40 0.70 0.30
Max 1.00 1.00 1.00 1.00
Median 0.80 0.80 1.00 0.70
Std 0.18 0.19 0.08 0.19
Precision
Min 0.54 0.55 0.56 0.57
Max 1.00 1.00 0.9 1.00
Median 0.75 0.78 0.67 0.75
Std 0.11 0.12 0.07 0.11
F1
Min 0.50 0.50 0.72 0.40
Max 0.95 0.95 0.90 0.90
Median 0.76 0.75 0.79 0.72
Std 0.11 0.12 0.04 0.11
of 0.75 or 1.0 and precision scores of 0.5, indicat-
ing that numerous conventional movements were de-
tected as simulated tremors. Upon inspection of the
video, it became evident that this participant seemed
to experience involuntary tremors on occasional ba-
sis. This is observable between the exercises during
periods of rest. It is possible that this participant also
experienced tremors while performing the exercises
in a conventional manner, which could have resulted
in the detection as a simulated tremor. In contrast,
participant 8 often showed recall and precision scores
of 0.6, with three correct and two incorrect exercises
of each type of movement. This behavior cannot be
explained at first glance, as the videos indicate clear
differences between the participants conventional and
tremor movements. Participant 0 is also noticeable,
with a recall score of only 0.2 and a precision score of
1.0 for the majority of the exercises, as all exercises
were usually classified as “conventional”. In com-
parison to other participants, this participant seems
to simulate a slightly lighter tremor, which could be
the source of these results. These scores align with
the results presented in Figure 4. This shows that, on
the one hand, a slight natural tremor movement can
be detected as tremor while on the other hand, slight
simulated tremor movements can be classified as con-
ventional movements. This needs to get investigated
further in the future.
The overall results of the trained SVMs on the
Table 2: The minimum (Min), maximum (Max), median,
and standard deviation (Std) of the accuracy, recall, preci-
sion, and F1 scores for all test sets of the trained support
vector machines separated by the four different kernel types
linear, rbf, poly, and sigmoid. The data are presented for the
lower arm.
SVM kernel
linear rbf poly sigmoid
Accuracy
Min 0.37 0.42 0.47 0.45
Max 0.90 0.85 0.90 0.85
Median 0.65 0.65 0.60 0.62
Std 0.11 0.11 0.10 0.11
Recall
Min 0.20 0.10 0.00 0.20
Max 1.00 1.00 1.00 1.00
Median 0.70 0.60 0.63 0.78
Std 0.24 0.22 0.27 0.19
Precision
Min 0.40 0.43 0.00 0.40
Max 1.00 1.00 1.00 0.89
Median 0.64 0.68 0.63 0.58
Std 0.13 0.14 0.18 0.12
F1
Min 0.29 0.17 0.00 0.27
Max 0.91 0.86 0.90 0.86
Median 0.67 0.63 0.63 0.67
Std 0.15 0.16 0.18 0.13
upper arm with a median accuracy of 0.75 for ev-
ery kernel indicate that it may be feasible to detect
a tremor during ADLs with a non-individualized ap-
proach. Skaramagkas et al. show success rates be-
tween 56.9% and 96.5%, with an average of 75.66%
for data recorded at the forearm (Skaramagkas et al.,
2021). These findings are comparable to our re-
sults. It should be noted that a distinction was made
between three classes (essential tremor, Parkinson’s
tremor, and no tremor) and not between two classes,
as is the case in our study. It is also important to note
that a separate classifier was trained for each exercise,
rather than a single classifier for different movements
combined. As shown in Figure 3, the distributions
of parameters may vary in different activities, poten-
tially influencing the results. Our results were not as
good as those reported by Soran et al. (accuracy of
95.4%) (Soran et al., 2012), although it is important
to note that they used a camera, which is a differ-
ent sensor system than our used IMUs. The study’s
findings indicate the presence of differences among
the participants, primarily due to the absence of a
clear threshold for distinguishing between the move-
ments and the presence of variability in the precision
and recall scores of the individual participants. Nev-
ertheless, a non-individualized approach was imple-
mented, enabling the differentiation of tremor from
conventional movements with a median accuracy of
0.75.
HEALTHINF 2025 - 18th International Conference on Health Informatics
810

It should be noted that the data set is relatively
small, with only nine participants and five exercises.
Additionally, the participants did not experience an
actual tremor, but rather simulated one. Nevertheless,
the overall results appear promising, suggesting that
the study should be repeated with a larger sample size
in the future. This should include participants with
and without actual tremor performing different exer-
cises to verify that machine learning algorithms like
SVM can effectively differentiate between individu-
als with and without tremor in ADLs. With a larger
data set, it is also possible to test whether neural net-
works, such as LSTM, deliver better results than an
SVM. Additionally, a more detailed evaluation of the
other calculated parameters could be conducted in the
future, as it is possible that the permutation feature
method may discard relevant parameters if they ap-
pear to correlate with other parameters.
5 CONCLUSION
In conclusion, we trained a SVM as a non-
individualized approach to distinguish between a
tremor and conventional movements during ADLs
with a median accuracy of 0.75. Therefore, in addi-
tion to the tests and rating scores used to quantify im-
pairments, data could be recorded in everyday life to
identify possible fluctuations throughout the day, gen-
erate more objective measurements, and enhance the
recognition of actual effects on everyday life. How-
ever, this requires further confirmation through a more
detailed study.
ACKNOWLEDGEMENTS
We thank Matthis Heese for conducting the study.
This work was supported by the Research Training
Group (RTG) 2783, funded by the German Research
Foundation (DFG) - Project ID 456732630.
REFERENCES
Aguirre, A. (2016). Evaluating upper-extremity
(dys)function using measurement unit technol-
ogy and its applications to resource-constrained
settings. In 2016 IEEE Global Humanitarian
Technology Conference (GHTC), pages 640–645.
Feys, P., Romberg, A., Ruutiainen, J., and Ketelaer, P.
(2004). Interference of upper limb tremor on daily life
activities in people with multiple sclerosis. Occupa-
tional Therapy In Health Care, 17(3-4):81–95. PMID:
23941223.
Goetz, C. G., Tilley, B. C., Shaftman, S. R., Stebbins, G. T.,
Fahn, S., Martinez-Martin, P., Poewe, W., Sampaio,
C., Stern, M. B., Dodel, R., et al. (2008). Movement
disorder society-sponsored revision of the unified
parkinson’s disease rating scale (mds-updrs): scale
presentation and clinimetric testing results. Movement
disorders: official journal of the Movement Disorder
Society, 23(15):2129–2170.
Gulde, P., Vojta, H., Schmidle, S., Rieckmann, P., and
Hermsd
¨
orfer, J. (2024). Outside the laboratory assess-
ment of upper limb laterality in patients with stroke: A
cross-sectional study. Stroke, 55(1):146–155.
Heldman, D. A., Jankovic, J., Vaillancourt, D. E., Prodoehl,
J., Elble, R. J., and Giuffrida, J. P. (2011). Essential
tremor quantification during activities of daily living.
Parkinsonism & Related Disorders, 17(7):537–542.
Nam, H. S., Lee, W. H., Seo, H. G., Smuck, M. W., and
Kim, S. (2022). Evaluation of motion segment size
as a new sensor-based functional outcome measure in
stroke rehabilitation. Journal of International Med-
ical Research, 50(9):03000605221122750. PMID:
36129970.
Oubre, B. and Lee, S. I. (2022). Estimating post-
stroke upper-limb impairment from four activities of
daily living using a single wrist-worn inertial sen-
sor. In 2022 IEEE-EMBS International Conference
on Biomedical and Health Informatics (BHI), pages
01–04.
Schmidle, S., Gulde, P., Jansen, B., Herdegen, S., and
Hermsd
¨
orfer, J. (2020). Frailty assessment in daily
living (frail) - assessment of adl performance of frail
elderly with imus. In Stephanidis, C., Antona, M.,
and Ntoa, S., editors, HCI International 2020 – Late
Breaking Posters, pages 92–101, Cham. Springer In-
ternational Publishing.
Shamay, N. S., William, T. W., Patrick, K. W., Philip, T. T.,
and Jefferry, W. C. (2011). Sensorimotor impairments
of paretic upper limb correlates with activities of daily
living in subjects with chronic stroke. South African
journal of physiotherapy, 67:9–16.
Skaramagkas, V., Andrikopoulos, G., Kefalopoulou, Z., and
Polychronopoulos, P. (2021). A study on the essen-
tial and parkinson’s arm tremor classification. Signals,
2(2):201–224.
Song, X., Van De Ven, S. S., Liu, L., Wouda, F. J., Wang,
H., and Shull, P. B. (2022). Activities of daily living-
based rehabilitation system for arm and hand motor
function retraining after stroke. IEEE Transactions
on Neural Systems and Rehabilitation Engineering,
30:621–631.
Soran, B., Hwang, J.-N., Lee, S.-I., and Shapiro, L. (2012).
Tremor detection using motion filtering and svm. In
Proceedings of the 21st International Conference on
Pattern Recognition (ICPR2012), pages 178–181.
Thorp, J. E., Adamczyk, P. G., Ploeg, H.-L., and Pickett,
K. A. (2018). Monitoring motor symptoms during ac-
tivities of daily living in individuals with parkinson’s
disease. Frontiers in Neurology, 9.
Yozbatiran, N., Der-Yeghiaian, L., and Cramer, S. C.
(2008). A standardized approach to performing the ac-
tion research arm test. Neurorehabilitation and Neural
Repair, 22(1):78–90. PMID: 17704352.
A Pre-Study on Tremor Classification During Activities of Daily Living
811

APPENDIX
Table 3: All calculated parameters.
Parameter Name Explanation of parameter
Mean Acceleration Mean of acceleration; found in (Aguirre, 2016)
Maximal Jerk Maximum of jerk; found in (Aguirre, 2016)
Mean Jerk Mean of jerk
Mean Absolute Jerk Mean of absolute jerk values
Mean Amplitude Deviation Ac-
celeration (MAD)
The mean of the distances to the mean acceleration; based on (Gulde
et al., 2024)
90th Percentile of Mean Ampli-
tude Deviation
the 90th percentile of the distances to the mean acceleration; based on
(Gulde et al., 2024)
Physical Activity Level The ratio of the time with an absolute distance to the mean acceleration
greater 0.1 g and the total time; based on (Gulde et al., 2024)
Maximum Angular Velocity The maximum of angular velocity; based on (Gulde et al., 2024)
Mean Angular Velocity The mean of angular velocity; based on (Gulde et al., 2024)
Standard Deviation Angular Ve-
locity
The standard deviation of angular velocity; based on (Gulde et al., 2024)
Peak Ratio Angular Rate The ratio of the number of peaks in angular velocity with a prominence
of 0.17
◦
s
and the number of all peaks in angular velocity; based on
(Gulde et al., 2024)
Number Angular Velocity Peaks
per 360°
The number of peaks in angular velocity per 360°; based on (Gulde et al.,
2024)
Mean Height Angular Velocity
Peaks
The mean of the heights of all peaks in angular velocity; based on (Gulde
et al., 2024)
Mean Standard Deviation Angu-
lar Velocity Peaks
The standard deviation of the heights of all peaks in angular velocity;
based on (Gulde et al., 2024)
Standard Deviation Acceleration Standard deviation of the acceleration data; found in (Song et al., 2022)
Relative Activity Acceleration ”Period of time in which the absolute acceleration signal exceeded 0.2
m
s
2
related to [duration]” (Schmidle et al., 2020)
Peak Standard Deviation Acceler-
ation
”Standard deviation of all acceleration peaks (maxima) in
m
s
2
” (Schmidle
et al., 2020)
Peaks Per Second Acceleration ”Number of acceleration peaks per second” (Schmidle et al., 2020)
Peak Ratio Acceleration ”Ratio between the number of acceleration peaks with a minimum
prominence of 0.2
m
s
2
and the total number of acceleration peaks”
(Schmidle et al., 2020)
Mean Peak Acceleration ”Mean of acceleration peaks” (Schmidle et al., 2020)
Signal to Noise Ratio Accelera-
tion
”Ratio of the sum of the frequency spectrum [of the acceleration data]
by a fast Fourier transformation from 0.01 to 3 Hz and from 0.01 to 50
Hz” (Schmidle et al., 2020)
Frequency Spectrum 0-3 Hz Sum of the frequency spectrum of the acceleration data from 0.01 to 3
Hz
Frequency Spectrum 3-50 Hz Sum of the frequency spectrum of the acceleration data from 3 to 50 Hz
Mean Variance Acceleration Mean of the variance of every second of the acceleration data
Root Mean Square Acceleration Root mean square of acceleration data
Root Mean Square Jerk Root mean square of jerk data
Number Peaks Acceleration Ratio of all peaks in acceleration data having a minimum hight of 1.05 g
and all data points
Mean Variance Angular Rate Mean of the variance of every second of the angular rate
Amplitude Angular Rate Difference of maximum and minimum of angular rate
Number Peaks Angular Rate Ratio of all peaks in angular rate data having a minimum hight of 1.05
◦
s
and all data points
HEALTHINF 2025 - 18th International Conference on Health Informatics
812
