
A New Cluster Validation Index Based on Stability Analysis
Adane Nega Tarekegn
a
, Bjørnar Tessem
b
and Fazle Rabbi
c
Department of Information Science and Media Studies, University of Bergen, Bergen, Norway
Keywords: Cluster Validation
, Stability Analysis, Clustering Algorithm, Text Clustering, CSAI.
Abstract: Clustering is a frequently employed technique across various domains, including anomaly detection,
recommender systems, video analysis, and natural language processing. Despite its broad application,
validating clustering results has become one of the main challenges in cluster analysis. This can be due to
factors such as the subjective nature of clustering evaluation, lack of ground truth in many real-world datasets,
and sensitivity of evaluation metrics to different cluster shapes and algorithms. While there is extensive
literature work in this area, developing an evaluation method that is both objective and quantitative is still
challenging task requiring more effort. In this study, we proposed a new Clustering Stability Assessment
Index (CSAI) that can provide a unified and quantitative approach to measure the quality and consistency of
clustering solutions. The proposed CSAI validation index leverages a data resampling approach and prediction
analysis to assess clustering stability by using multiple features associated within clusters, rather than the
traditional centroid-based method. This approach enables reproducibility in data clustering and operates
independently of the clustering algorithms used, which makes it adaptable to various methods and
applications. To evaluate the effectiveness and generality of the CSAI, we have carried out an extensive
experimental analysis using various clustering algorithms and benchmark datasets. The obtained results show
that CSAI demonstrates competitive performance compared to existing cluster validation indices and
effectively measures the quality and robustness of clustering results across multiple samples.
1 INTRODUCTION
Clustering is one of the fundamental tasks in
unsupervised learning, where the input is a set of
unlabeled samples, each described by a vector of
feature values. The goal is to partition a set of
observations into distinct groups such that
observations within each cluster exhibit substantial
similarity, while those in different clusters should be
dissimilar (Duan et al., 2023). The cohesion of these
groups may stem from various factors, including
proximity in the distance, inherent trends, patterns,
and interrelationships present within the dataset.
Clustering is often employed across different tasks
(Oyewole & Thopil, 2023; Halim et al., 2015), such
as anomaly and event detection, recommendation
systems, graph analysis, customer segmentation, and
natural language processing. It is frequently applied
to get an intuition about the underlying structure in
a
https://orcid.org/0000-0002-4005-1238
b
https://orcid.org/0000-0003-2623-2689
c
https://orcid.org/0000-0001-5626-0598
the data, find meaningful groups, feature extraction,
topic modelling, and summarization (Nakshatri et
al., 2023). Clustering can also serve as a method for
representation learning in the absence of reference
data for supervised learning tasks (Li et al., 2022;
Tarekegn et al., 2021), and it can improve
classification performance. Clusters can be
generated using either hard clustering or soft
clustering based on the level of membership
assignment to each data point. Hard clustering
assigns each data point exclusively to one cluster,
while soft clustering assigns degrees of membership
to multiple clusters, indicating the likelihood
or probability of each data point belonging to each
cluster (Murtagh, 2015). Depending on the specific
nature of the problem, various algorithms have been
developed, which can be categorized into various
groups, including partitioning-based, hierarchical-
based, density-based, and model-based (Xu &
Wunsch, 2005; Ezugwu et al., 2022).
Tarekegn, A. N., Tessem, B. and Rabbi, F.
A New Cluster Validation Index Based on Stability Analysis.
DOI: 10.5220/0013309100003905
In Proceedings of the 14th International Conference on Pattern Recognition Applications and Methods (ICPRAM 2025), pages 377-384
ISBN: 978-989-758-730-6; ISSN: 2184-4313
Copyright © 2025 by Paper published under CC license (CC BY-NC-ND 4.0)
377

Despite the proven efficiency of various
clustering algorithms in data grouping, a crucial
aspect of clustering analysis is evaluating algorithm
performance (W. Wu et al., 2020; Tarekegn et al.,
2020). This involves determining not only the
consistency of clusters but also assessing the validity
of results that best fit the underlying structure of the
data (Kim & Ramakrishna, 2005). Different methods
often lead to different clusters, and even for the same
algorithm, variations in parameter selection or the
sequence in which input patterns are presented may
affect the results. Thus, effective evaluation
standards and criteria are essential to provide users
with a degree of confidence in the clustering results
derived from the employed algorithms. However,
cluster validation poses significant challenges due to
factors such as the subjective nature of evaluating
clustering results, the absence of predefined labels
or ground truth in many real-world datasets, and the
sensitivity of evaluation metrics to different cluster
shapes and densities (Xu & Wunsch, 2005).
A clustering book by Jain and Dubes (Jain & Dubes,
1988) stated that “the validation of clustering
structures is the most difficult and frustrating part of
cluster analysis. Without a strong effort in this
direction, cluster analysis will remain a black art
accessible only to those true believers who have
experience and great courage ". This observation
has persisted for several years despite substantial
advancements in the field. Numerous evaluation
methods exist in the literature, with a common
approach being the use of internal validity measures
(Jegatha Deborah et al., 2010) that rely solely on
metrics such as compactness, cluster separation, and
roundness to assess clustering quality. However,
these methods are designed for evaluating convex-
shaped cluster, making them less effective for non-
convex clusters and unable to directly assess cluster
stability (Liu et al., 2022) across different runs or
perturbations.
In this study, we propose a new Clustering
Stability Assessment Index (CSAI) for measuring
the validity and stability of the clustering solutions
based on multiple feature information associated
with clusters. The proposed method employs the
data resampling approach, where the training data is
grouped into several partitions for cluster
construction, from which the prediction of cluster
memberships for test data points is made. CSAI was
motivated by the news event detection task in which we
would like to assess the quality of news text clusters.
The main contributions of this study include:
1. We propose stability-based cluster validation
index (CSAI) that leverages information from
multiple features associated with clusters.
2. The proposed method is evaluated using
benchmark textual datasets, each containing
multiple partitions for cluster construction and
a separate validation set for assessing the
quality of results.
3. The effectiveness of the proposed validation
index is compared against the widely used
clustering validation indices using various
clustering algorithms.
4. CSAI employs the structure of features within
clusters instead of centroids and adopts the
mean squared error expression as a distance
measure.
2 PROPOSED METHOD
In this paper, we propose CSAI to measure the quality
and consistency of clustering solutions. It employs
stability analysis to examine the robustness of
clustering algorithms across various samples, where
each cluster is characterized by aggregation of multiple
features. CSAI score is computed based on partitioning
the training data into several samples for cluster
generation and holding separate validation data for
evaluation of clustering results. The data partitioning
process shares some similarities with the conventional
cross-validation approach in supervised learning, but
here, the training data is resampled into several parts
without reserving any portion for validation purposes.
With this validation data, the clustering model applied
to the training data can be used to predict the cluster
membership of new data points. This strategy is in line
with (Tibshirani & Walther, 2005; Xu & Wunsch,
2005) that an effective clustering model should handle
new data points without relearning. The degree of
clustering stability is then measured by applying a
normalized distance measure between the clusters on
the training data and the validation set. This distance
quantifies how close or similar the features of the
validation data are to those of the training data within a
particular cluster.
In CSAI, the distance or similarity is calculated
individually for each cluster and then averaged across
all clusters in each of the partitions, which provides a
measure of the average discrepancy between the
similarity scores of features in the training and
validation data. By ‘features’, we refer to the
transformed representation of the original textual data
obtained through embeddings and manifold learning
techniques or other transformations. By leveraging
ICPRAM 2025 - 14th International Conference on Pattern Recognition Applications and Methods
378

these aggregated properties of cluster-associated data,
the CSAI index can be computed independent of the
clustering method used and its mode of operation.
Moreover, the distance measure employs a more robust
quality estimator, utilizing the mean square error
measure instead of relying solely on the Euclidean
distance.
2.1 Theoretical Framework for CSAI
The proposed CSAI method can be expressed formally
as follows. Assume a dataset X consist of 𝑝 data points
and A be a clustering algorithm. Each data point 𝑥
for
𝑟=1,2,…,𝑝, is represented as a vector of 𝑞 real-
valued features: 𝒙
𝒓
=𝑥
,𝑥
,…,𝑥
. Consider the
dataset X is randomly divided into 𝑚+1 subsets or
partitions: 𝑋
,𝑋
,…,𝑋
,𝑋
, and let 𝑋
= V is
used as the validation set, while all the remaining
partitions constitute the training set, denoted as
T=
⋃
𝑋
.
Our next step is to take each partition in
𝑇: 𝑋
,𝑋
,…,𝑋
, and run an identical clustering
method A resulting in 𝑛 clusters each, the clusters
being named 𝐶
, 𝑖=1,2,…,𝑚 and j=1,2,…,𝑛. The
cluster membership of the data points in V is
subsequently determined based on their similarity to
the data points in 𝑇.
Compute the representative points for each cluster
𝐶
in T and 𝑉 by aggregating all features that are
associated with each cluster of 𝑇 and 𝑉. This process
transforms the values of T and V, each containing 𝑛
points in s-dimensional feature space. These points are
represented as 𝑥
and 𝑣
, respectively, where the
values can be the mean, sum, or maximum of all
features in each T and 𝑉. The distance between the
representative points 𝑥
and 𝑣
is indicative of both
cluster validity and stability. In both cases, less distance
implies higher quality clustering, reflecting accurate
(valid) and consistent (stable) clustering results. We
use a distance based on the mean square distance
expression (Eq. (1)), with division by 𝑞 to reflect the
average magnitude of the distance between 𝑥
and 𝑣
.
𝑑𝑥
,𝑣
=
∑
𝑥
−𝑣
(1)
where 𝑠<𝑞 is the total number of features,𝑥
and
𝑣
represent the k
feature obtained in the j
cluster
of the i
partition in T and 𝑉, respectively. To make
comparability of the distance scores across datasets and
algorithms, it is necessary to divide all scores by the
size of the largest value range among all features in the
representative points in T. This range value is
calculated in Eq. (2) for each partition.
w=max
(
max
(
max
𝑥
−min
𝑥
)) (2)
The CSAI score on each partition, obtained using
clustering algorithm A, represents the average distance
(𝑑) for all clusters in T
, normalized by 𝑤, as shown in
Eq. (3).
CSAI
(
𝑇
,𝐴
)
=
1
𝑤.𝑛
1
𝑠
𝑥
−𝑣
(3)
Finally, the global CSAI score is computed across all
the training partitions in 𝑇 using Eq. (4), which is
obtained by adding Eq. (3) for multiple partitions.
CSAI
(
T,A
)
=
1
m
1
𝑤.𝑛
1
𝑠
𝑥
−𝑣
(4)
where 𝑚 represents the total number of partitions in the
training data, and 𝑛 is the total number of clusters
generated from each partition in the training data. 𝑤,
denote the difference between the maximum and
minimum values of the features in each partition of T.
The specific characteristic of CSAI is that it is based
on the exploitation of aggregated features attached to
clusters and the concept of stability. The aggregated
features can be helpful for discovering non-linear
relationships within the data and assessing the
robustness of clustering results, which might not be
feasible in the original data space. The similarity or
distance between these features is computed for each
cluster, which allows CSAI to assess both the validity
and the robustness of clustering solutions. The concept
of stability, on the other hand, is important for
determining the reliability of the clustering results and
can enhance the practicalability of results in real-world
applications. The other important feature of CSAI is
that a separately stored validation dataset is used for
quality assessment. The validation data, whether
sampled from the original dataset or collected
independently, should be excluded from the clustering
generation process, and solely used for result
evaluation. CSAI offers a unified approach to
validating clustering quality, aiding in the assessment
of clustering stability and generalizability while also
addressing the reproducibility issues in the field of
unsupervised learning (Hutson, 2018). Moreover,
CSAI can operate independently of the clustering
algorithm used.
A New Cluster Validation Index Based on Stability Analysis
379
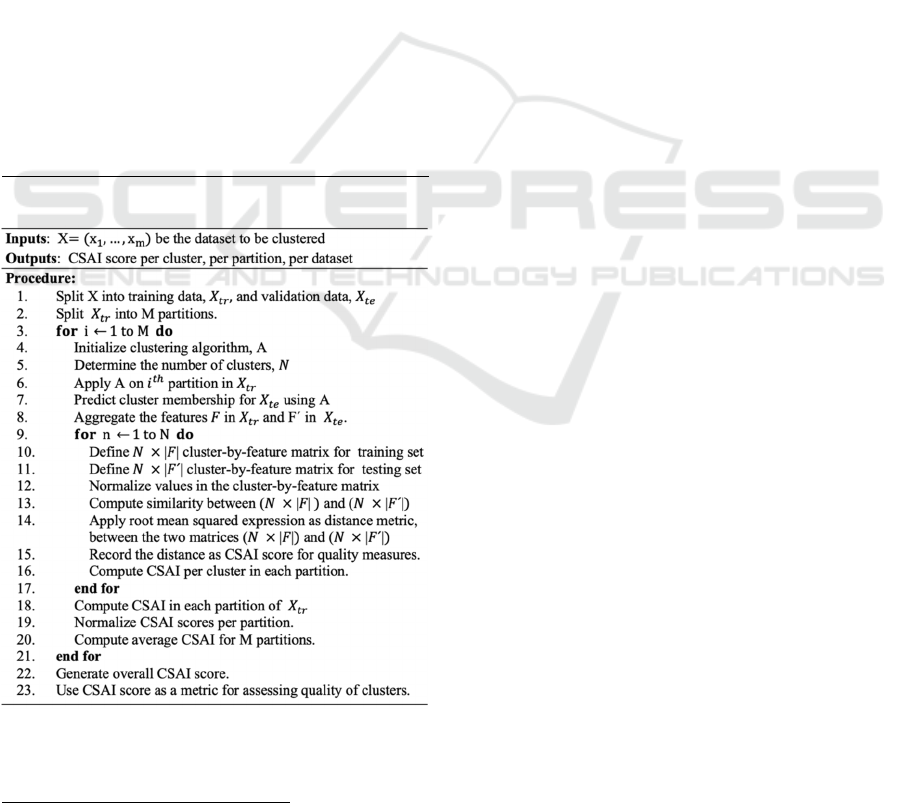
2.2 Algorithm for CSAI
The proposed algorithm for the CSAI method is
presented in Algorithm 1. By analysing the theoretical
framework and algorithmic procedure, we can
determine the time complexity of the CSAI module. In
Algorithm 1, lines 1 and 2 involve iterating over the
dataset to split it into multiple subsamples. Step 3 of
Algorithm 1 iterates over the number of partitions in
the training data to construct clusters on each partition.
The subsequent steps include essential aspects of
CSAI, such as determining the number of partitions
and clusters, assigning data points to clusters, and
aggregating features within clusters. Feature
aggregation transformation involves statistical
calculations such as mean, median, mode, standard
deviation, etc., Then, from step 9 onwards, the error
between the training and validation datasets is
computed within each cluster and over partitions.
Overall, let M be the number of partitions in the
training dataset, N be the number of clusters in each
partition, and F be the number of features in the latent
space. Therefore, the time complexity of the CSAI
index can be approximated as O(M⋅N
2
⋅F), reflecting
the computational cost of the CSAI score calculations.
Algorithm 1: Proposed Clustering Stability Assessment
Index (CSAI).
4
https://www.gdeltproject.org/
3 EXPERIMENTS AND RESULTS
3.1 Datasets and Algorithms
Three publicly available datasets: 20 newsgroups
(20NG) (Rennie, 2003), MN-DS (Petukhova &
Fachada, 2023) and arXiv (Clement et al., 2019)
datasets, and one curated news dataset from the Global
Database of Events, Language, and Tone(GDELT)
4
,
were used to evaluate the effectiveness of our proposed
validation index. The 20NG dataset is a widely
recognized benchmark in machine learning and text
analysis, containing a total of 18,846 newsgroup posts
organized into 20 different categories. The MN-DS
dataset is based on the NELA-GT-2019 dataset
(Gruppi et al., 2020), which is a collection of 10,917
news articles, with most of them sourced from
mainstream outlets, such as ABC News, BBC, and The
Guardian. The ArXiv dataset is a collection of research
papers submitted to arXiv.org, a preprint repository
where scholars from various fields share their scientific
papers. It typically includes metadata such as title,
authors, abstract, publication date, and categories. The
fourth dataset is a collection of news articles from
GDLET, which is a comprehensive repository of
global news events and coverage. GDELT processes
news articles, television broadcasts, online news
sources, and other media to extract valuable insights.
For each textual dataset, we utilized the Sentence-
BERT (SBERT) (Reimers & Gurevych, 2019) for text
embedding, which produces 768-dimensional output
representation. Subsequently, we applied Uniform
Manifold Approximation and Projection (UMAP)
(McInnes et al., 2018) for generating low-dimensional
representations and visualizations (2D for visualization
and 10D for clustering).
In terms of clustering algorithms, four different
clustering algorithms: k-means and k-medoids,
agglomerative clustering, and Gaussian mixture model
(model-based clustering) were used for the evaluation
of CSAI. K-means clustering is among the most
popular clustering algorithms, which works by
partitioning a set of data points into distinct, non-
overlapping clusters (Dharmarajan & Velmurugan,
2013). K-medoid is an extension of K-means to
discover clusters, while it adopts “modes” instead of
cluster centres (Kaufman, 1990). One limitation of both
K-means and K-medoids is that they struggle to handle
noise and outliers and are not well-suited for detecting
clusters with non-convex shapes. Hierarchical
clustering, on the other hand, constructs a hierarchy of
clusters, visualized as a tree-like structure called a
ICPRAM 2025 - 14th International Conference on Pattern Recognition Applications and Methods
380
dendrogram. A Gaussian Mixture Model (GMM) is a
probabilistic approach for clustering and density
estimation (Lin et al., 2019). It assumes that data is
generated from a mixture of several Gaussian
distributions, each representing a distinct cluster.
3.2 Analysis of Results
In this study, multiple experiments were conducted to
assess the effectiveness of the proposed CSAI index.
Figure 1 depicts the CSAI score generated by four
different clustering algorithms (k-means, k-medoid,
agglomerative, and GMM) across three datasets. From
the figure, lower CSAI scores were observed on the
MN-DS dataset with k-means and k-medoid
algorithms. On the arXiv dataset, the better scores of
CSAI were scored with agglomerative and GMM,
while the worst was observed on k-medoid. Notably,
when comparing clustering algorithms based on CSAI
values, the agglomerative clustering algorithm
consistently outperformed others across all three
datasets (MN-DS, GDELT, and arXiv).
Figure 1: CSAI scores on different clustering algorithms.
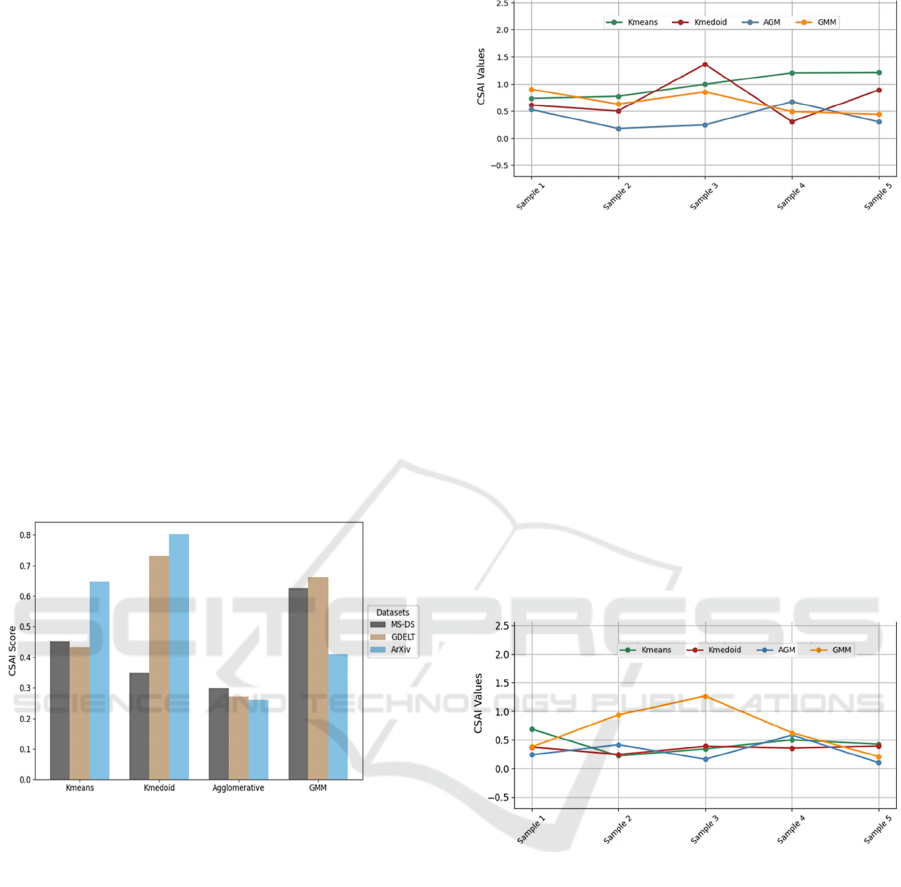
In addition to evaluating each clustering algorithm
using the overall CSAI, we have also computed the
CSAI score across different partitions of each dataset
to gauge the stability of each algorithm. Understanding
the variability of CSAI can aid in selecting alternative
models; for instance, models with less variability in
CSAI score may be preferred over those with higher
variability. Additionally, CSAI variation can assist in
choosing the final clustering solution. The variation of
each model's CSAI score across the five samples in
each partition of the training data is shown in Figure 2
for the GDELT dataset and Figure 3 for the MN-DS
dataset. To quantify the stability assessment more
precisely, we computed the standard deviation (SD) of
the CSAI values across different subsamples. On
GDELT, it is evident that the highest instability was
observed with the k-medoid algorithm (SD:0.3664),
Figure 2: CSAI scores of four models across five samples
on the GDELT dataset.
showing significant differences in CSAI values across
the five samples. Furthermore, a slight variation in
CSAI scores was noted with AGM (SD:0.1860), where
almost identical CSAI values were scored on samples
2, 3, and 5, as well as the similarity between sample 1
and sample 4. The most plausible clustering solution
was observed in sample 2, with a better score of CSAI
on AGM, which produced nine reasonable clusters. On
MN-DS, all the clustering algorithms have shown
stability across the 5 samples, except GMM
(SD:0.3818), which has quite different values across
the five samples. On 20NG and arXiv datasets, the k-
means algorithm produced the most stable CSAI scores
with SD of 0.0780 and 0.1962, respectively.
Figure 3: CSAI scores of four models across five samples
on the MN-DS dataset.
3.3 CSAI Results with Different Indices
In addition to evaluating clustering results using CSAI,
we also considered other well-known clustering
validation indices, including silhouette index (SS)
(Rousseeuw, 1987), Davies-Bouldin (DB) (Davies &
Bouldin, 1979), Calinski-Harabasz (CH)
(Bandyopadhyay & Saha, 2008), Dunn index (DI)
(Dunn, 1974), Ray-Turi index (RT) (Ray & Turi,
1999), S_Dbw (Halkidi & Vazirgiannis, 2001), and
Xie-Beni (XB) (Tang et al., 2005). While these indices
are commonly used, they focus on a single aspect of
clustering quality (e.g. cluster validity). In contrast,
CSAI integrates both the stability and validity of
A New Cluster Validation Index Based on Stability Analysis
381
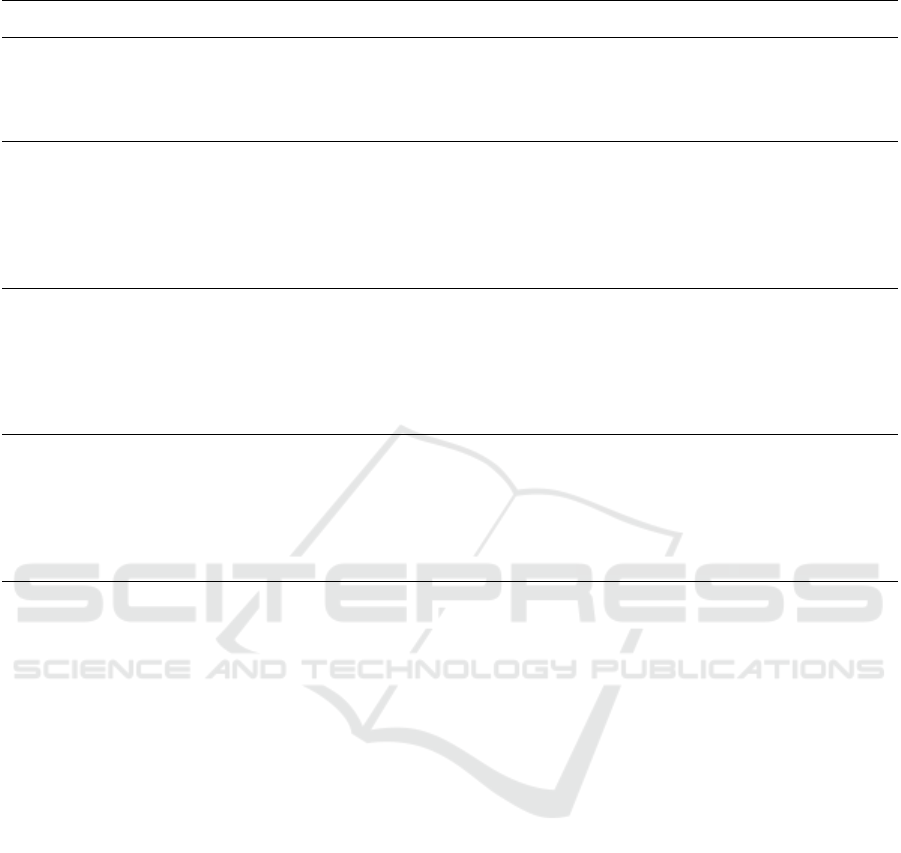
Table 3: Clustering results in terms of CSAI score and other indices on the four different datasets and algorithms.
Datasets
Validation
Indices
K-means
Clustering
K-medoid
Clustering
Agglomerative
Clustering
Gaussian
Mixture Model
MN-DS
Dataset
DB
5.7097 1.9122 1.1327 1.0005
RT 0.3466 0.4336 0.3512 0.3389
XB
1.1635 0.6474 0.75604 0.8325
S_Dbw
0.50631 0.5577 0.5672 0.4638
CSAI
0.4523 0.3489 0.2986 0.6269
GDELT Dataset
DB
1.2474 1.5868 1.0859 1.1474
RT 0.4594 1.6694 1.7936 0.4191
XB
2.5290 3.0951 2.4871 0.2862
S_Dbw
0.5377 0.6125 0.47813 0.53000
CSAI 0.4330
0.7327 0.2712 0.6619
ArXiv
Dataset
DB 1.1479
1.3917 1.2371 1.4070
RT 0.2205 1.7617 0.3645 0.2381
XB 0.6965
0.8889 0.8512 0.6040
S_Dbw 0.5415
0.6286 0.5129 0.6847
CSAI 0.6490
0.8025 0.2604 0.4113
20NG
Dataset
DB 0.9374 1.1159 0.9453 1.4071
RT 0.1934 1.9904 0.2259 0.23810
XB 0.9522
1.7111 1.2775 0.6040
S_Dbw 0.4320
0.5574 0.3426 0.6847
CSAI 0.6392 0.5499
0.3099 0.3084
clustering results, offering a more holistic evaluation
approach. CSAI, DB, RT, S_Dbw and XB have values
ranging between zero (0) and positive infinity (+∞),
where the lower values indicate better clustering
results. CH and DI are also bounded by (0, +∞), but
unlike CSAI, higher values indicate better clustering,
and lower values suggest poor clustering. SS score
takes values in the interval [-1, 1]. Negative values
represent the wrong placement of data points, while
positive values indicate better assignments. When
comparing and analysing the different clustering
indices, we observed that CSAI can be better compared
with DB, RT, S_Dbw, and XB as they share the same
value range and interpretation of index values. Table 3
presents the scores of these indices and CSAI involving
four clustering algorithms across four different
datasets, including MN-DS, GDELT, ArXiv, and
20NG datasets. For CSAI to be comparable across
different datasets and clustering structures,
normalization of the index scores was carried out,
following literature guidelines (J. Wu et al.,
2009);(Rezaei & Franti, 2016). On the MN-DS dataset,
agglomerative clustering yields the lowest CSAI score,
indicating that it provides the most stable and valid
clusters. K-means and K-medoids produce higher
CSAI values, suggesting less stability. The GMM, with
a CSAI of 0.6269, performs the worst on this dataset.
Agglomerative clustering consistently outperforms
other algorithms in terms of cluster quality, as indicated
by the lowest CSAI scores. On the same dataset, RT
exhibited slightly better scores in the cases of k- means
and GMM. On GDELT, CSAI achieved the best scores
on k-means and agglomerative hierarchical clustering,
S_Dbw favoured K-medoid, and the XB score was the
best on the Gaussian model.
In this context, the word “best” refers to the
clustering algorithm with the lowest CSAI score. On
the other hand, k-medoid clustering performs better
with the S_Dbw index on GDELT and ArXiv datasets.
Overall, the most notable observation from Table 3 is
that the CSAI index showed the best value on
agglomerative clustering indicating it produces more
stable and quality clustering results compared to other
algorithms across the four datasets. This indicates that
CSAI is best suited to hierarchical clustering while also
showcasing its effectiveness across various clustering
algorithms. Unlike indices such as RT, which favors
compact clusters, CSAI balances compactness and
stability, aligning closely with S_Dbw in terms of score
while diverging from RT and XB in certain cases. This
highlights CSAI's ability to provide a more holistic
evaluation of clustering quality.
ICPRAM 2025 - 14th International Conference on Pattern Recognition Applications and Methods
382

4 CONCLUSIONS
In this paper, we proposed CSAI, a new cluster
evaluation index for dealing with the validity and
robustness of clustering solutions. This approach is
used to assess the quality of clustering solutions and the
reproducibility of data clustering through the concept
of model stability. Building up on some of the
limitations in the literature, CSAI distinguishes itself
by fully leveraging aggregated feature structures
pertaining to clusters rather than focusing on cluster
centroids. For evaluation, we conducted extensive
experiments on four different publicly available
datasets to validate the generality and effectiveness of
the proposed algorithm. In our experiments, we
selected the widely used clustering algorithms,
including k-means, k-medoid, agglomerative
hierarchical clustering and Gaussian mixture model.
Our experimental results demonstrate that CSAI is a
promising unified solution that can effectively evaluate
the quality of clustering solutions and their stability.
More importantly, the CSAI index exhibited the
highest efficacy in agglomerative hierarchical
clustering, surpassing other indices, highlighting its
suitability for hierarchical clustering while also
highlighting its effectiveness on other clustering
algorithms.
As limitation of the study, CSAI’s efficacy has
been evaluated using only textual datasets, despite the
potential for the proposed method to work on other
domains and data modalities such as images and other
datasets. Thus, further research will be towards using
these diverse data types to validate the algorithm's
versatility and robustness across different domains.
ACKNOWLEDGEMENTS
This research work is funded by SFIMediaFutures
Partners and the Research Council of Norway (Grant
number 309339).
REFERENCES
Bandyopadhyay, S., & Saha, S. (2008). A point symmetry-
based clustering technique for automatic evolution of
clusters. IEEE Transactions on Knowledge and Data
Engineering, 20(11), 1441–1457. https://doi.org/10.11
09/TKDE.2008.79
Clement, C. B., Bierbaum, M., O’Keeffe, K. P., & Alemi,
A. A. (2019). On the Use of ArXiv as a Dataset.
http://arxiv.org/abs/1905.00075
Davies, D. L., & Bouldin, D. W. (1979). A Cluster
Separation Measure. IEEE Transactions on Pattern
Analysis and Machine Intelligence, PAMI-1(2), 224–
227. https://doi.org/10.1109/TPAMI.1979.4766909
Dharmarajan, A., & Velmurugan, T. (2013). Applications
of partition based clustering algorithms: A survey. 2013
IEEE International Conference on Computational
Intelligence and Computing Research, IEEE ICCIC
2013. https://doi.org/10.1109/ICCIC.2013.6724235
Duan, X., Ma, Y., Zhou, Y., Huang, H., & Wang, B. (2023).
A novel cluster validity index based on augmented non-
shared nearest neighbors. Expert Systems with
Applications, 223. https://doi.org/10.1016/j.eswa.202
3.119784
Dunn, J. C. (1974). Well-separated clusters and optimal
fuzzy partitions. Journal of Cybernetics, 4(1), 95–104.
https://doi.org/10.1080/01969727408546059
Ezugwu, A. E., Ikotun, A. M., Oyelade, O. O., Abualigah,
L., Agushaka, J. O., Eke, C. I., & Akinyelu, A. A.
(2022). A comprehensive survey of clustering
algorithms: State-of-the-art machine learning
applications, taxonomy, challenges, and future research
prospects. In Engineering Applications of Artificial
Intelligence (Vol. 110). https://doi.org/10.1016/j.enga
ppai.2022.104743
Gruppi, M., Horne, B. D., & Adalı, S. (2020). NELA-GT-
2019: A Large Multi-Labelled News Dataset for The
Study of Misinformation in News Articles.
http://arxiv.org/abs/2003.08444
Halim, Z., Waqas, M., & Hussain, S. F. (2015). Clustering
large probabilistic graphs using multi-population
evolutionary algorithm. Information Sciences, 317, 78–
95. https://doi.org/10.1016/j.ins.2015.04.043
Halkidi, M., & Vazirgiannis, M. (2001). Clustering validity
assessment: Finding the optimal partitioning of a data
set. Proceedings - IEEE International Conference on
Data Mining, ICDM. https://doi.org/10.1109/icdm.20
01.989517
Hutson, M. (2018). Artificial intelligence faces
reproducibility crisis Unpublished code and sensitivity
to training conditions make many claims hard to verify.
Science, 359(6377), 725–726. https://doi.org/10.1126/
science.359.6377.725
Jain, A. K., & Dubes, R. C. (1988). Clustering Methods and
Algorithms. In Algorithms for Clustering Data (pp. 55–
142). http://www.jstor.org/stable/1268876?origin=cros
sref
Jegatha Deborah, L., Baskaran, R., & Kannan, A. (2010). A
Survey on Internal Validity Measure for Cluster
Validation. International Journal of Computer Science
& Engineering Survey, 1(2), 85–102. https://doi.org/
10.5121/ijcses.2010.1207
Kaufman, L. (1990). Finding groups in data : an
introduction to cluster analysis - Partitioning Around
Medoids (Program PAM). Wiley, Hoboken, 68–125.
Kim, M., & Ramakrishna, R. S. (2005). New indices for
cluster validity assessment. Pattern Recognition
Letters, 26(15), 2353–2363. https://doi.org/10.1016/
j.patrec.2005.04.007
A New Cluster Validation Index Based on Stability Analysis
383

Li, Q., Li, B., Garibaldi, J. M., & Qiu, G. (2022). Clustering-
Based Representation Learning through Output
Translation and Its Application to Remote-Sensing
Images. Remote Sensing. https://doi.org/10.3390/
rs14143361
Lin, X., Yang, X., & Li, Y. (2019). A Deep Clustering
Algorithm based on Gaussian Mixture Model. Journal
of Physics: Conference Series, 1302(3).
https://doi.org/10.1088/1742-6596/1302/3/032012
Liu, T., Yu, H., & Blair, R. H. (2022). Stability estimation
for unsupervised clustering: A review. In Wiley
Interdisciplinary Reviews: Computational Statistics
(Vol. 14, Issue 6). https://doi.org/10.1002/wics.1575
McInnes, L., Healy, J., Saul, N., & Großberger, L. (2018).
UMAP: Uniform Manifold Approximation and
Projection. Journal of Open Source Software, 3(29),
861. https://doi.org/10.21105/joss.00861
Murtagh, F. (2015). Brief history of cluster analysis. In
Handbook of Cluster Analysis. https://doi.org/10.1201/
b19706
Nakshatri, N., Liu, S., Chen, S., Hopkins, D. J., Roth, D., &
Goldwasser, D. (2023). Using LLM for Improving Key
Event Discovery: Temporal-Guided News Stream
Clustering with Event Summaries. Findings of the
Association for Computational Linguistics: EMNLP
2023, 4162–4173. https://doi.org/10.18653/v1/2023.fin
dings-emnlp.274
Oyewole, G. J., & Thopil, G. A. (2023). Data clustering:
application and trends. Artificial Intelligence Review,
56(7), 6439–6475. https://doi.org/10.1007/s10462-022-
10325-y
Petukhova, A., & Fachada, N. (2023). MN-DS: A
Multilabeled News Dataset for News Articles
Hierarchical Classification. Data, 8(5). https://doi.org/
10.3390/data8050074
Ray, S., & Turi, R. H. (1999). Determination of number of
clusters in k-means clustering and application in colour
image segmentation. Proceedings of the 4th
International Conference on Advances in Pattern
Recognition and Digital Techniques, 137–143.
Reimers, N., & Gurevych, I. (2019). Sentence-BERT:
Sentence embeddings using siamese BERT-networks.
EMNLP-IJCNLP 2019 - 2019 Conference on Empirical
Methods in Natural Language Processing and 9th
International Joint Conference on Natural Language
Processing, Proceedings of the Conference, 3982–
3992. https://doi.org/10.18653/v1/d19-1410
Rennie, J. (2003). 20 Newsgroups data set, sorted by date.
MIT, CSAIL.
Rezaei, M., & Franti, P. (2016). Set matching measures for
external cluster validity. IEEE Transactions on
Knowledge and Data Engineering
, 28(8), 2173–2186.
https://doi.org/10.1109/TKDE.2016.2551240
Rousseeuw, P. J. (1987). Silhouettes: A graphical aid to the
interpretation and validation of cluster analysis. Journal
of Computational and Applied Mathematics, 20(C), 53–
65. https://doi.org/10.1016/0377-0427(87)90125-7
Tang, Y., Sun, F., & Sun, Z. (2005). Improved validation
index for fuzzy clustering. Proceedings of the American
Control Conference, 2, 1120–1125. https://doi.org/
10.1109/acc.2005.1470111
Tarekegn, A. N., Alemu, T. A., & Tegegne, A. K. (2021).
A cluster-genetic programming approach for detecting
pulmonary tuberculosis. Ethiopian Journal of Science
and Technology, 14(1), 71–88. https://doi.org/10.4314/
ejst.v14i1.5
Tarekegn, A. N., Michalak, K., & Giacobini, M. (2020).
Cross-Validation Approach to Evaluate Clustering
Algorithms: An Experimental Study Using Multi-Label
Datasets. SN Computer Science, 1(5). https://doi.org/
10.1007/s42979-020-00283-z
Tibshirani, R., & Walther, G. (2005). Cluster validation by
prediction strength. Journal of Computational and
Graphical Statistics, 14(3), 511–528. https://doi.org/
10.1198/106186005X59243
Wu, J., Chen, J., Xiong, H., & Xie, M. (2009). External
validation measures for K-means clustering: A data
distribution perspective. Expert Systems with
Applications, 36(3 PART 2), 6050–6061.
https://doi.org/10.1016/j.eswa.2008.06.093
Wu, W., Xu, Z., Kou, G., & Shi, Y. (2020). Decision-
Making Support for the Evaluation of Clustering
Algorithms Based on MCDM. Complexity, 2020.
https://doi.org/10.1155/2020/9602526
Xu, R., & Wunsch, D. (2005). Survey of clustering
algorithms. In IEEE Transactions on Neural Networks
(Vol. 16, Issue 3, pp. 645–678). https://doi.org/10.11
09/TNN.2005.845141
ICPRAM 2025 - 14th International Conference on Pattern Recognition Applications and Methods
384
