
Sensor Calibration and Data Analysis of the MuFoRa Dataset
Valentino Behret
1
, Regina Kushtanova
1
, Islam Fadl
2
, Simon Weber
1
, Thomas Helmer
2
and Frank Palme
1
1
Laboratory for 3D Measuring Systems and Computer Vision, Department of Mechanical, Automotive and Aeronautical
Engineering, Munich University of Applied Sciences (MUAS), Dachauer Straße 98b, Munich, Germany
2
Institute of Safety in Future Mobility (C-ISAFE), Technische Hochschule Ingolstadt, Esplanade 10, Ingolstadt, Germany
Keywords:
Dataset, Object Detection, ROS, Autonomous Driving, Adverse Weather Dataset, Computer Vision, Sensors,
Calibration.
Abstract:
Autonomous driving sensors face significant challenges under adverse weather conditions such as fog and rain,
which can seriously degrade their performance and reliability. Existing datasets often lack the reproducible
and measurable data needed to adequately quantify these effects. To address this gap, a new multimodal dataset
(MuFoRa
a
) has been collected under controlled adverse weather conditions at the CARISSMA facility, using
a stereo camera and two solid-state LiDAR sensors. This dataset is used to quantitatively assess sensor degra-
dation by measuring the entropy for images and the number of inliers for point clouds on a spherical target.
These metrics are used to evaluate the impact on performance under varying conditions of fog (5 to 150 m
visibility) and rain (20 to 100 mm/h intensity) at different distances (5 to 50 m). Additionally, two calibration
target detection approaches — Deep-learning and Hough-based — are evaluated to achieve accurate sensor
alignment. The contributions include the introduction of a new dataset focused on fog and rain, the evaluation
of sensor degradation, and an improved calibration approach. This dataset is intended to support the develop-
ment of more robust sensor fusion and object detection algorithms for autonomous driving.
a
MuFoRa – A Multimodal Dataset of Traffic Elements Under Controllable and Measured Conditions of
Fog and Rain
1 INTRODUCTION
The development of a multi-sensor object detection
system for autonomous driving requires the integra-
tion of multiple hardware and software components.
The software stack must contain sensor drivers, cal-
ibration routines, and an object detection algorithm.
The hardware includes a sensor subsystem that uses
at least two different types of sensors, including radar,
visual and thermal cameras, LiDAR (Light Detection
and Ranging) and ultrasonic sensors — each with dis-
tinct strengths and limitations.
Radar is highly robust under various weather and
lighting conditions, such as fog, rain, glare, and ex-
treme temperatures, but its low resolution limits its
ability to classify objects in detail. In contrast, cam-
eras are less effective in adverse weather conditions,
as shown in Zhang et al., 2023, but provide rich vi-
sual detail and excel in tasks requiring high resolution
and accuracy, such as localisation, object classifica-
tion, and detection. LiDAR offers precise depth per-
ception, though it struggles with distant objects and
lacks texture detail (Feng et al., 2020). Thermal cam-
eras are reliable in varied lighting but lack depth infor-
mation, and ultrasonic sensors are effective for short-
range applications like parking but are too sensitive to
environmental factors like humidity and dirt (Bengler
et al., 2014).
Given these limitations, no single sensor can pro-
vide a comprehensive representation of the environ-
ment or robust perception under all conditions. Con-
sequently, many studies and commercial systems em-
ploy a combination of sensors, leveraging sensor fu-
sion to improve performance (Ayala and Mohd, 2021;
Google, 2024; Juliussen, 2020).
Sensor fusion has been shown to enhance ob-
ject detection and perception accuracy, especially un-
der adverse weather conditions. By combining the
complementary strengths of different sensors, sensor
fusion achieves more reliable and robust perception
622
Behret, V., Kushtanova, R., Fadl, I., Weber, S., Helmer, T. and Palme, F.
Sensor Calibration and Data Analysis of the MuFoRa Dataset.
DOI: 10.5220/0013310400003912
In Proceedings of the 20th International Joint Conference on Computer Vision, Imaging and Computer Graphics Theory and Applications (VISIGRAPP 2025) - Volume 2: VISAPP, pages
622-631
ISBN: 978-989-758-728-3; ISSN: 2184-4321
Copyright © 2025 by Paper published under CC license (CC BY-NC-ND 4.0)

compared to single-sensor systems, thereby improv-
ing the stability and performance of autonomous vehi-
cles (Corral-Soto and Bingbing, 2020; Broedermann
et al., 2024).
Studies involving adverse weather scenarios com-
monly use cameras and LiDARs together (Diaz-Ruiz
et al., 2022; Matuszka et al., 2022; Maddern et al.,
2017). Thus, in the multi-sensor object detection sys-
tem described in this study, we also combine a stereo
camera and LiDARs.
The sensors’ ability to perceive objects can de-
crease under adverse weather conditions such as rain,
snow, fog and hail (Zhang et al., 2024; Bijelic et al.,
2020; Diaz-Ruiz et al., 2022). Evaluating sensors un-
der these conditions is critical for ensuring the reli-
ability of autonomous driving systems. Controlled
testing environments, such as rain and fog chambers,
provide repeatable conditions to systematically assess
sensor strengths and weaknesses (Bijelic et al., 2020;
Bijelic et al., ). Multimodal datasets gathered from
such environments are vital for effectively training,
validating, and testing perception systems, making
them more adaptable to changing conditions (Bijelic
et al., 2020).
In this work, a novel multimodal dataset has been
introduced to quantitatively evaluate the impact of
weather conditions, including fog and rain, on im-
age and LiDAR data. The dataset contains controlled,
measured and reproducible indoor data collected us-
ing a stereo camera and two LiDAR sensors at the
CARISSMA-THI indoor test facility (Fadl et al.,
2025). By employing controlled adverse weather sce-
narios, this dataset aims to improve understanding of
sensor performance and support the development of
more robust sensor fusion and object detection algo-
rithms.
The contributions of this study are as follows:
• A novel multimodal dataset
1
(MuFoRa) recorded
in a weather simulation chamber with a set of traf-
fic elements from ten distances ranging from 5 to
50 m. It contains five rain intensity I
R
levels (20
to 100 mm/h) and a fog visibility V
f
gradient be-
tween 5 and 150 m;
• Evaluation of camera and LiDAR sensor degra-
dation under measurable adverse weather condi-
tions;
• A detailed comparison of circle detection algo-
rithms used for calibration.
1
https://doi.org/10.5281/zenodo.14175611
2 PROBLEM STATEMENT
Quantifying the impact of the weather in a system-
atic approach on sensor data requires measurable and
controllable weather conditions. However, control-
ling the intensity of the weather is only possible in
specialised test facilities. A dataset recorded with
multiple types of sensors at a specialised test facility,
containing an incremental variation of distance and
weather intensity, provides the possibility to quantify
the impact of certain weather conditions on sensor
data in a systematical manner.
3 RELATED WORK
3.1 Adverse Weather Conditions
Datasets
To date, the number of datasets representing differ-
ent weather conditions is limited, primarily due to the
uncontrollability of weather events and the challenges
associated with outdoor data collection and measure-
ment (Burnett et al., 2023; Bijelic et al., 2020). Many
existing weather datasets consist of either online-
collected (Guerra et al., 2018; Kenk and Hassaballah,
2020) or synthetic data (Franchi et al., 2022; Marathe
et al., 2023; Karvat and Givigi, 2024), which may fail
to reflect real-world contexts accurately. This section
reviews existing datasets focused on adverse weather
scenarios, highlighting their key characteristics, con-
tributions, the set of sensors and calibration methods
used in the study. The Table 1 compares the main
characteristics of the proposed dataset with those of
the reviewed datasets.
Oxford RobotCar (Maddern et al., 2017): is a large-
scale dataset featuring nearly 20 million images and
multi-sensor data collected in different weather and
illumination conditions across a year in Oxford, us-
ing cameras, LiDAR, and GPS/INS. The dataset pro-
vides comprehensive calibration data for multi-sensor
fusion and 3D reconstruction, that utilises chessboard
extraction algorithm and automatic camera-laser cali-
bration from Kassir and Peynot, 2010.
Ithaca365 (Diaz-Ruiz et al., 2022): provides repeated
15 km route recordings with diverse weather, featur-
ing LiDAR, cameras, and GPS/INS, calibration of
the intrinsics by using checkerboards with OpenCV,
followed by extrinsic LiDAR-camera calibration by
matching checkerboard points.
RADIATE (Sheeny et al., 2021): focuses on adverse
weather scenarios like dense fog and heavy snow us-
ing radar, along with LiDAR, camera, and GPS data.
Sensor Calibration and Data Analysis of the MuFoRa Dataset
623
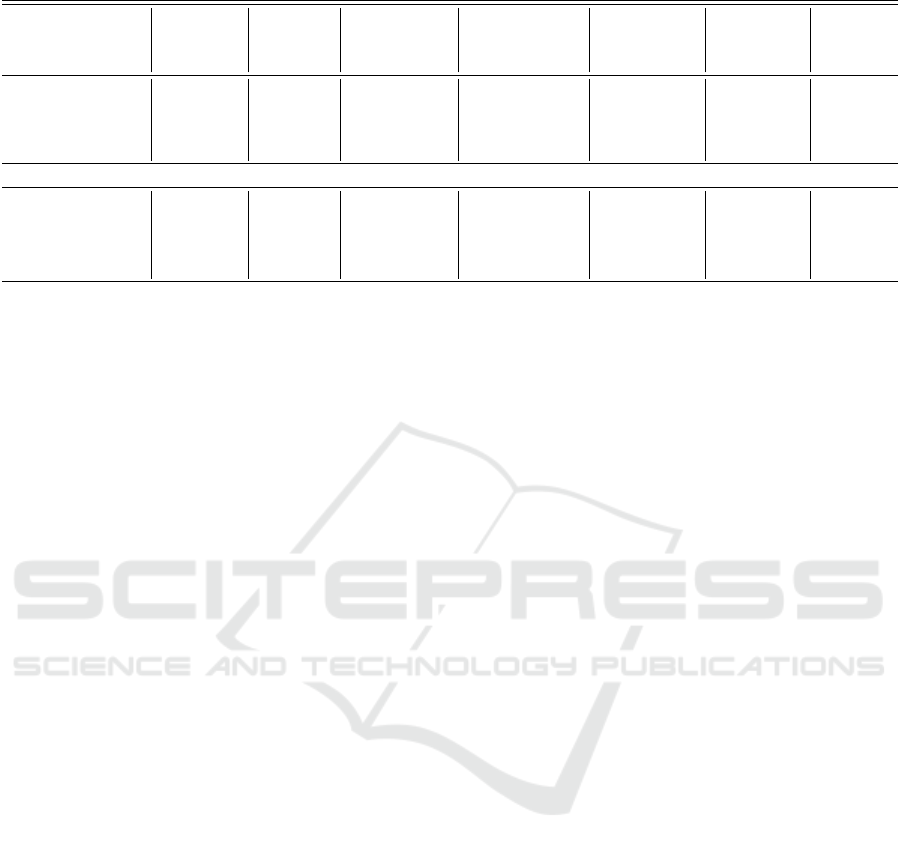
Table 1: Comparison of Dataset Characteristics.
Dataset Oxford RobotCar Ithaca365 RADIATE Boreas SeeingThroughFog PixelAccurate Our Dataset
Camera (#)
4 4 1 1 2 1 2
Resolution
1280 × 960 /
1024 × 1024
1928 × 1208 672 × 376 2448 × 2048 1920 × 1024 1920 × 1024 4416 × 1242
Frame Rate 16 Hz / 11.1 Hz
30 Hz 15 Hz 10 Hz 30 Hz 30 Hz 10 Hz
Lidar (#)
3 2 1 1 2 1 2
Lidar Type
Sick LMS-151 /
Sick LD-MRS
Velodyne Puck Velodyne HDL-32E Velodyne Alpha Prime
Velodyne HDL64 /
Velodyne VLP-32C
Velodyne HDL64 Blickfeld Qb2
Range
50 m 100 m 100 m 300 m
120 m / 200 m
120 m 100 m
Frequency
50 Hz / 12.5 Hz 10 Hz 10 Hz 10 Hz 10 Hz 10 Hz 5 Hz
Environmental Conditions
Climate Chamber ✗ ✗ ✗ ✗ ✓ ✓ ✓
Rain ✓ ✓ ✓ ✓ ✓ ✓ ✓
Fog ✗ ✗ ✓ ✓ ✓ ✓ ✓
Snow ✓ ✓ ✓ ✓ ✓ ✗ ✗
Night ✓ ✓ ✓ ✓ ✓ ✓ ✗
The camera intrinsic and distortion are calibrated us-
ing MATLAB camera calibration toolbox. Camera,
radar and LiDAR are calibrated by matching checker-
board points.
Boreas (Burnett et al., 2023): features multi-sensor
data from 350 km of driving across seasons. Cam-
era intrinsics and LiDAR-camera extrinsics were cal-
ibrated using MATLAB tools. LiDAR-radar calibra-
tion used correlative scan matching.
SeeingThroughFog (Bijelic et al., 2020): is a multi-
modal dataset of 12,000 scenes under diverse weather
and lighting, including 1,500 fog chamber measure-
ments. The setup includes LiDAR, cameras, radar,
and gated NIR/FIR sensors, targeting adaptive sensor
fusion and evaluating sensor degradation in adverse
conditions.
Pixel-Accurate Depth Benchmark dataset (Gruber
et al., 2019): provides 1,600 samples in controlled
adverse weather, featuring four realistic road scenar-
ios under clear, light, and heavy rain conditions, and
17 fog visibility levels from 20 to 100 m. The dataset
uses a camera and LiDAR setup, intrinsic camera
calibration via checkerboard and extrinsic calibration
with black-white targets, solving the perspective-n-
point problem with non-linear least-squares optimi-
sation.
Compared to Gruber et al., 2019, the dataset pre-
sented in this study contains five rain intensity levels
instead of two and a fog visibility gradient between
5 and 150 m. Instead of multiple traffic scenarios, a
set of traffic elements has been recorded from ten dis-
tances ranging from 5 to 50 m (Fadl et al., 2025).
3.2 LiDAR-Camera Calibration
Camera-LiDAR calibration can be divided into four
main categories: artificial object-based methods,
which use targets like checkerboards or spheres for
geometric alignment (Zhang and Pless, 2004); ge-
ometric feature-based methods, which use natural
structures like lines to align LiDAR and camera with-
out the need for special targets (Moghadam et al.,
2013); semantic feature-based methods, which
utilise the segmentation of objects, such as vehicles or
pedestrians, to perform calibration, relying on seman-
tic information rather than precise geometry, allowing
the usage in unstructured environments (Zhu et al.,
2020); and scene-independent methods, which use
techniques like mutual information, ego-motion esti-
mation, or deep learning to achieve flexible calibra-
tion without specific targets (Taylor et al., 2015). The
list of publications with novel methods keeps grow-
ing, illustrating how important the accurate alignment
of LiDAR and camera data is for sensor fusion.
This study uses Deep-learning and a RANSAC
based sphere fit to detect spherical targets for calibrat-
ing the camera-LiDAR setup, which are described and
compared in subsection 4.3.
4 METHODOLOGY
4.1 System Architecture and Sensor
Setup
Since the main focus of data collection is severe
weather conditions, the system must be waterproof.
The sensors used in the setup (see Table 2) both have
an ingress protection of at least IP66, which provides
protection against dust and strong splashes of wa-
ter (Comission, 2001). The stereo camera (Stereolabs,
2024) is connected with a waterproof USB-C cable to
the edge device (NVIDIA Jetson AGX Orin 32 GB),
that is placed inside the vehicle. The LiDAR sen-
sors (Blickfeld, 2023) are connected to a PoE switch,
mounted inside a waterproof housing on top of the
vehicle (see Figure 1). The edge device and the PoE
switch are connected to a router inside the vehicle.
VISAPP 2025 - 20th International Conference on Computer Vision Theory and Applications
624
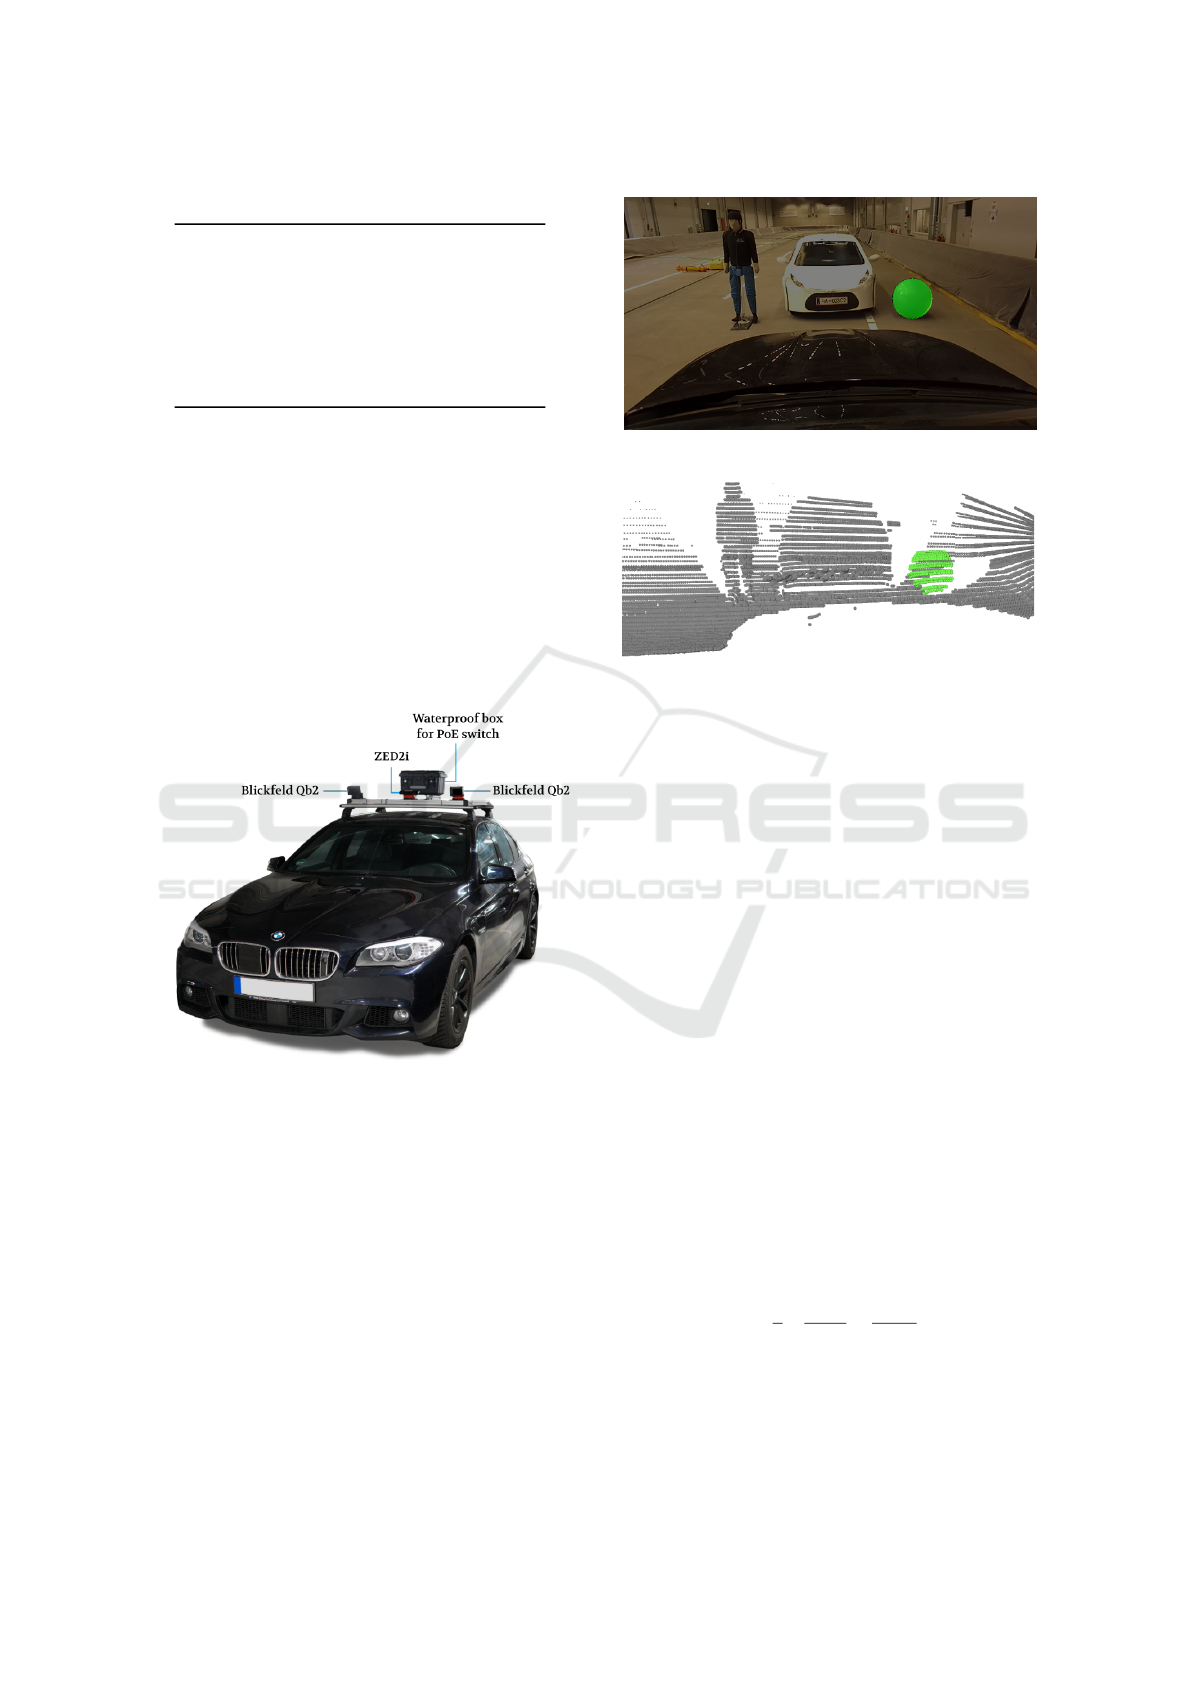
Table 2: Sensors used for the data recording.
Type Stereo Camera LiDAR
Model ZED2i (4 mm) Qb2
Range in m 1.5 to 35 1 to 100
FOV in
◦
72 × 44 90 × 45
Temperature
range in
◦
C
−10 to 45 −30 to 60
Protection IP66 IP67
Both sensors provide a ROS 2 wrapper, making
ROS 2 (Macenski et al., 2022) a suitable framework
for communication between the sensors and the edge
device. To streamline development and deployment,
the drivers and ROS 2 wrappers are pre-installed into
a multi-architecture (amd64 and arm64) Docker im-
age (Merkel, 2014). Since the ZED2i camera’s stereo
matching requires an NVIDIA GPU, both develop-
ment and deployment environments must have an
NVIDIA GPU with compatible drivers and the con-
tainer toolkit (NVIDIA, 2024) installed. By utilis-
ing the ROS 2 wrappers, sensor data, including times-
tamps can be recorded and saved as ROS bags.
Figure 1: Sensor setup on a test vehicle, featuring two
Blickfeld Qb2 LiDAR units, a ZED2i stereo camera, and
a waterproof box for PoE switch mounted on the roof.
4.2 Sensor Data Analysis
To analyse the impact of weather on the sensor data, a
spherical target is included in the dataset. This target,
with a known circumference, can be detected and lo-
cated in 3D using point cloud and image data. The tar-
get serves not only as a tool for analyzing image and
point cloud data but also for sensor calibration (Toth
et al., 2024 ). Figure 2 shows a camera image and a Li-
DAR point cloud displaying the setup with the sphere.
(a) Image from camera
(b) Point cloud from LiDAR
Figure 2: Visualization of the sphere detection for each sen-
sor.
4.2.1 Sphere Detection
The target can be detected in point clouds using a
RANSAC-based approach, as described in Toth et al.,
2020. However, since this approach attempts to fit
a sphere using four entirely random points, most fit-
ted spheres result in unreasonable outcomes, requir-
ing numerous iterations for reliable sphere detection.
This issue is addressed by first selecting a random
point q ∈ R
3
and using a k-d tree structure (Bentley,
1975) to restrict the selection of the remaining three
points by
P =
(
p
1
, p
2
, p
3
∈ R
3
|d(q, p
i
) ≤ 2 · r + t
I
for i = 1, 2, 3
)
(1)
where r ∈ R represents the radius of the sphere and
t
I
∈ R denotes the inlier threshold, a tunable param-
eter for sphere detection in point clouds. Addition-
ally, instead of using the number of inliers n
I
∈ N as
the cost function for the RANSAC algorithm, the de-
tected spheres are ranked based on a quality score that
combines the fitted radius ˆr ∈ R and the number of in-
liers
q
S
=
1
2
r − ˆr
i
r
+
n
I,i
n
max,i
(2)
and the detection with the highest quality score is con-
sidered, which contains a sufficient amount of inliers,
to be the spherical target. The required number of in-
liers is constrained by the inlier threshold t
i
, which
Sensor Calibration and Data Analysis of the MuFoRa Dataset
625

is determined during the parameter optimisation pro-
cess.
In total, the sphere detection process has three pa-
rameters that are tuned to increase the robustness of
the detection:
• Inlier threshold t
S
∈ R
• Maximum number of iterations i
max
∈ N
• Minimum number of inliers I
min
∈ N
whereas the following cost function is used for the op-
timisation process with the TPE sampler (Watanabe,
2023):
c
S
=
1
2
q
s
+
∥x −
ˆ
x∥
r
(3)
with the estimated centre of the sphere
ˆ
x ∈ R
3
, and
the manually annotated centre x ∈ R
3
.
4.2.2 Circle Detection
The approach described in Toth et al., 2020 for de-
tecting a sphere using RANSAC combined with a
Canny Edge Detector does not robustly detect circles
(spherical targets) in images. To address this issue,
two methods for sphere detection in images are de-
veloped. The first method is based on circle detec-
tion using the Hough transformation. However, the
HoughCircles() function from OpenCV (Bradski,
2000) has a total of seven parameters that need to be
fine-tuned or adjusted to the data for robust detection,
as shown by experiments on our dataset. These pa-
rameters are automatically fine-tuned, along with the
kernel sizes used for image blurring in the preprocess-
ing step, using Optuna (Akiba et al., 2019). For the
optimisation process, a total of four parameters are
considered:
• Kernel size median filter: k
M
= 2n + 1,
where n ∈ N
• Kernel size Gaussian filter: k
G
= 2n + 1,
where n ∈ N
• Threshold for Canny Edge detection: t
C
∈ N
• Accumulator threshold for circles: t
A
∈ N
By providing ground truth pixel locations ¯u, ¯v ∈ N for
the centre of the calibration target and the correspond-
ing images, the cost function c
H
for the optimization
process is defined by:
c
H
=
δ
xy
+ δ
r
2
, δ
xy
=
∥
x −
ˆ
x
∥
r
, δ
r
=
|
r − ˆr
|
r
(4)
In the second approach, a deep learning model is
used to detect the target. For this purpose, the object
detection variant of the DETR model (Carion et al.,
2020) is employed. When the model identifies an in-
stance in the image, it provides the pixel coordinates
of the top-left corner of the bounding box, along with
the width and height for each detected instance. These
values represent the smallest enclosing rectangle for
the calibration target.
To use this approach effectively, it is essential for
the model to provide precise bounding boxes with
edges that align with the target’s edges. For this rea-
son, a custom dataset is created to fine-tune the model.
The ground truth bounding boxes in this dataset con-
sistently align with the edges of the labelled ball, en-
suring the model is trained to place predicted bound-
ing boxes in the same way.
The dataset used is composed of two sources.
The first component is provided by the Ball finder
dataset (Dwyer et al., 2024), where the labels are
used as-is or adjusted as needed using Roboflow’s la-
belling tool (Dwyer et al., 2024) to meet the afore-
mentioned requirements. The second component is a
subset from the Sports balls - multiclass image classi-
fication dataset (Cortinhas, 2023), which features soc-
cer balls in various scenarios and designs, with differ-
ences in colour and pattern. To keep the dataset size
manageable for fine-tuning and to expedite training,
only a subset is selected. If the trained model’s pre-
cision proved insufficient, additional subsets could be
incorporated. The images from this dataset are also
annotated using Roboflow.
During manual data cleaning, images containing
balls that are less than 50% visible are removed. The
model should not be trained to recognise such par-
tially visible balls, as the subsequent calibration aims
to detect only clearly visible targets. Non-spherical
balls, such as rugby balls found in the Ball finder
dataset, are also excluded during this step, resulting in
a final dataset of 748 images. In preparation for model
training, the images are then converted to greyscale.
Following this, exposure adjustments, blurring, and
noise are applied as augmentations. The final dataset,
used for tuning and training — Accurate Ball Detec-
tion (Dwyer et al., 2024), contains 1,293 images di-
vided into training, validation, and test sets.
The TPE sampler from Optuna is used for this tun-
ing process (Akiba et al., 2019; Watanabe, 2023). The
Mean Average Precision (mAP) serves as a cost func-
tion, computed using Intersection over Union (IoU)
values that range from 0.50 to 0.95 in increments of
0.05, while accounting for all detection areas. The
calculation of the mAP is carried out on the test set
using the COCO evaluation tool (Lin et al., 2015).
4.3 Calibration
Since the vehicle was moved between recording days,
the extrinsic calibration between the sensors differs
VISAPP 2025 - 20th International Conference on Computer Vision Theory and Applications
626
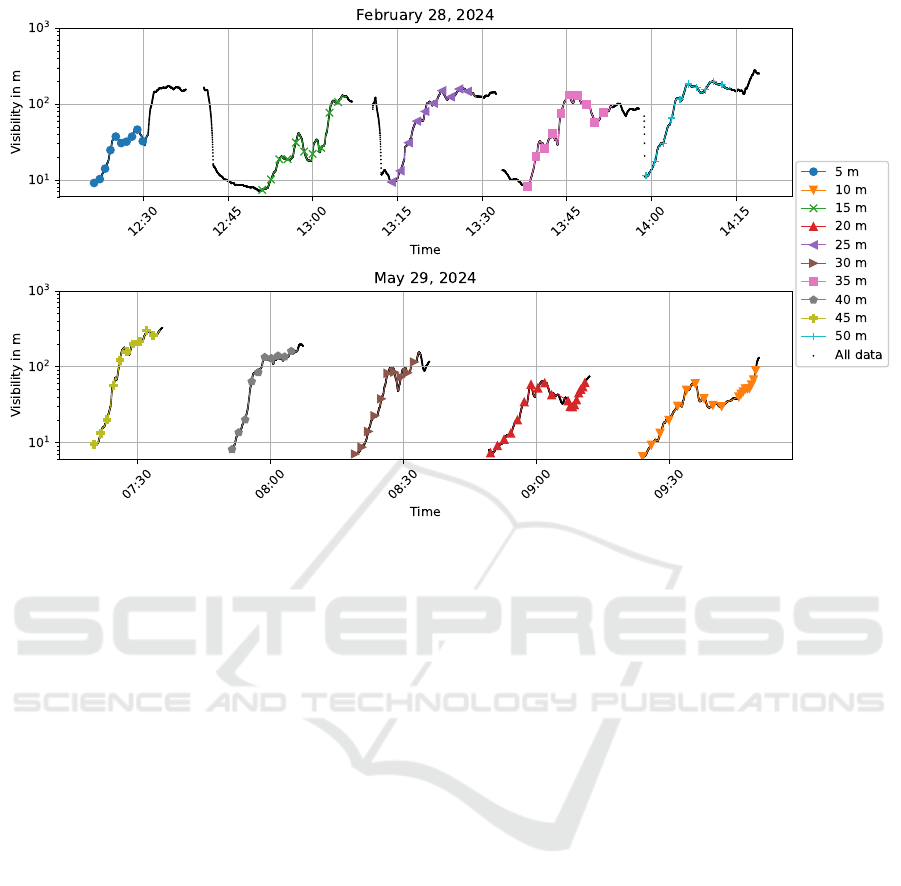
Figure 3: Measured fog visibility V
F
of recordings during two different recording days. The matched timestamps for the
evaluation of the sensor data are highlighted. The timestamps are depicted in UTC.
from day to day. Table 3 shows the date at which each
sequence was recorded, to map the corresponding
sensor extrinsics to each sequence. The calibration
files inside the dataset contain the extrinsics, which
can be used to transform the LiDAR point clouds into
the coordinate frame of the left camera. The calibra-
tion approach is based on Toth et al., 2020, which
requires at least four spatial sphere positions A =
{a
1
, a
2
, . . . , a
n
} in the image and the corresponding
point cloud B = {b
1
, b
2
, . . . , b
n
}, with a
i
, b
i
∈ R
3
. The
spatial coordinates of the spheres in the images can
be estimated if the radius of the sphere is known. The
corresponding images and point clouds are matched
using timestamps that are stored inside the recorded
ROS bags for each sensor snapshot. A rigid trans-
formation between pairs of spatial coordinates can be
determined by minimising the
f (R, t) =
n
∑
i=1
∥Ra
i
+ t − b
i
∥
2
(5)
Instead of relying solely on the approach described in
Toth et al., 2020, a RANSAC-based approach from
OpenCV (Bradski, 2000) is also used to sanity check
the results, as RANSAC-based methods are highly ro-
bust to noise.
5 CASE STUDY
5.1 Impact of Weather on Sensor Data
To investigate the impact of fog visibility V
F
on sen-
sor data, visibility must be measured during data
recording. Before recording begins, the fog measure-
ment device is time-synchronized with the edge de-
vice inside the car to ensure that the timestamps of
the recorded ROS bags align with the fog visibility
data. Figure 3 shows the complete measurement his-
tory in black, along with the matched timestamps for
the recorded sensor data at selected distances. The vi-
sualized measurements are a subset of the whole mea-
surements from (Fadl et al., 2025), since only a subset
is needed for the interpretation of the results.
To evaluate the impact of fog and rain on the sen-
sor data, the entropy (Shannon, 1948) S ∈ R of the
pixels on the calibration target for image data is com-
pared with the number of inliers of the detected sphere
for point cloud data. A point is considered an inlier if
the distance of the point from the surface of the de-
tected sphere is lower than d
S
< t
S
= 0.06 ∈ R. The
threshold was determined during the parameter tuning
process of the sphere detection.
Sensor Calibration and Data Analysis of the MuFoRa Dataset
627
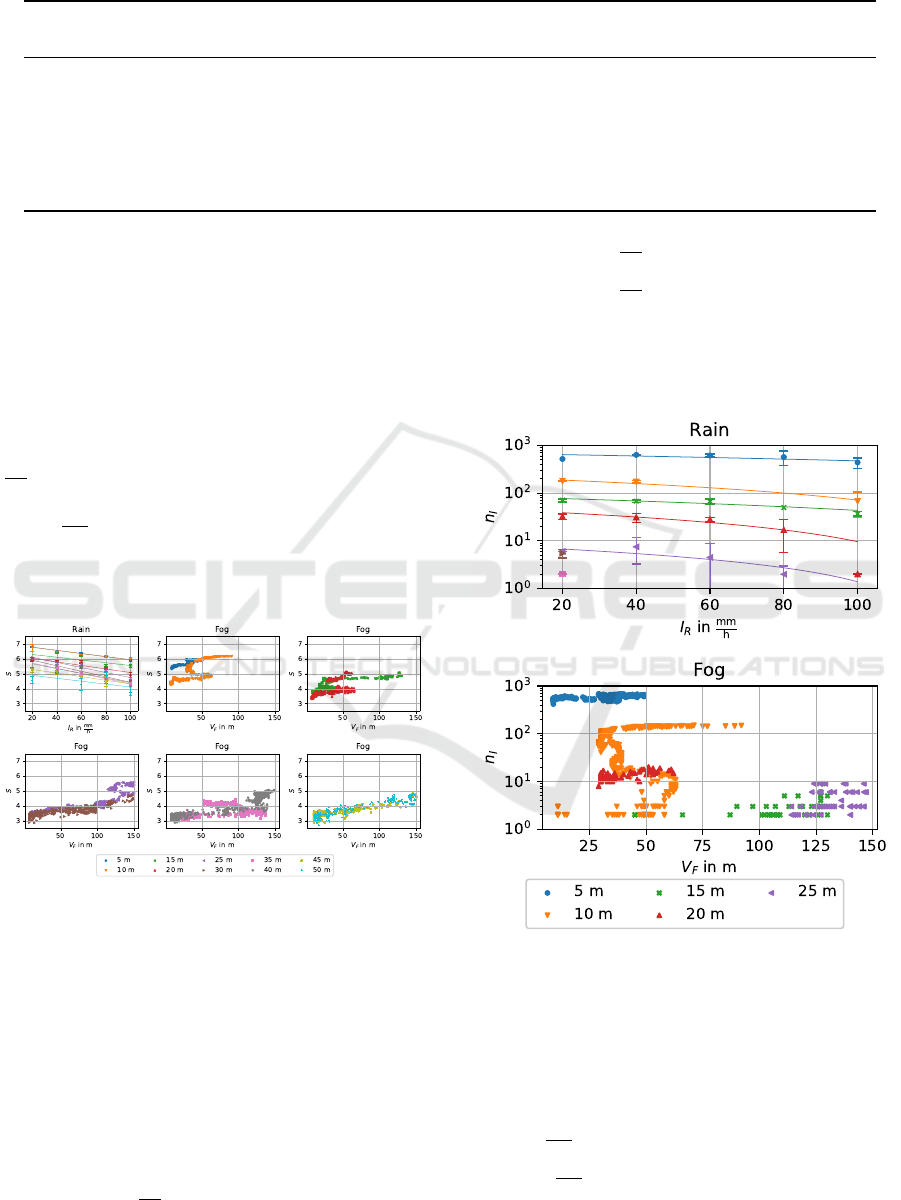
Table 3: Overview of recording dates for each sequence to map calibration data.
Distance in m 5 10 15 20 25 30 35 40 45 50
Weather
Fog 28.02 29.05 28.02 29.05 28.02 29.05 28.02 29.05 29.05 28.02
Rain 100 mmh
−1
28.05 27.02 28.05 28.05 28.05 28.05 27.02 27.02 27.02 28.05
Rain 20 mmh
−1
27.02 27.02 28.05 28.05 27.02 28.05 27.02 27.02 28.05 28.05
Rain 40 mmh
−1
28.05 27.02 28.05 28.05 27.02 28.05 27.02 27.02 27.02 28.05
Rain 60 mmh
−1
28.05 27.02 27.02 28.05 27.02 28.05 27.02 28.05 27.02 28.05
Rain 80 mmh
−1
28.05 27.02 28.05 28.05 27.02 28.05 27.02 27.02 27.02 27.02
5.1.1 Camera
The position of the sphere within the images is de-
termined using ground truth labels to avoid false de-
tections that could disrupt comparability among the
data recordings. This sphere position is used to cal-
culate the entropy exclusively for the pixels that de-
pict the sphere. Figure 4 shows that as rain inten-
sity increases, the entropy of the pixels decreases,
on average over all distances, at a slope of about
∆S
∆I
R
≈ −1.3 × 10
−2
hmm
−1
. A lower visibility due
to fog clearly leads to higher entropy at an average
rate of
∆S
∆V
F
≈ 1.1 × 10
−2
m
−1
. However, as Figure 4
shows, the entropy rises faster for smaller fog visibil-
ity levels, which suggest a non-linear increase of the
entropy over the fog visibility.
Figure 4: Impact of weather on camera sensor data, whereas
the error bar of the rain data depicts ±2σ.
5.1.2 LiDAR
Similar to providing ground truth labels for image
data, the region of interest (ROI) is labelled for each
data sequence. But instead of using the 3D bound-
ing box as a ground truth sphere position, each point
cloud is filtered, and the sphere detection described
in section 4.2.1 is applied. Figure 5 shows that with
an increasing distance, the slope at which the number
of inliers decreases is getting smaller:
• 5 m to 10 m:
∆n
I
∆I
R
≈ −1.3 hmm
−1
• 15 m to 20 m:
∆n
I
∆I
R
≈ −0.38 hmm
−1
• 25 m to 30 m:
∆n
I
∆I
R
≈ −0.11 hmm
−1
At distances larger than at least 35 m there are not
enough inliers detected, at any rain intensity I
R
level,
to estimate the impact of the rain on the number of
inliers.
Figure 5: Impact of weather on LiDAR sensor data, whereas
the error bar of the rain data depicts ±2σ.
As for rain, the combination of fog visibility and
distance has an impact on the number of detected in-
liers. As Figure 5 shows, the LiDAR can penetrate
the fog only at distances d < 10m while being able to
detect significantly more inliers at higher visibility:
• 5 m:
∆n
I
∆V
F
≈ −1.9 m
−1
• 10 m:
∆n
I
∆V
F
≈ −9.1 × 10
−1
m
−1
The remaining slopes are below 2 × 10
−2
m
−1
. In-
VISAPP 2025 - 20th International Conference on Computer Vision Theory and Applications
628
terestingly, at 15 m significantly fewer inliers are de-
tected than at 20 m. This could be attributed to the fog
for the measurement at 15 m, which results in reduced
visibility for an extended duration and is more erratic
than other measurements (see Figure 3).
5.2 Method Comparison Circle
Detection
To compare the two methods, images from a labelled
holdout dataset are used. In these images, the cali-
bration target is labelled, if visible. This results in a
total of 166 images selected to compute the evalua-
tion metric. The Hough circle detection is compared
with the deep circle detection, conducting tests using
both, a fine-tuned model and pretrained model based
on the COCO dataset. Table 4 shows the number of
successfully detected circles and the RMSE, since the
calibration target should not only be detected reliably
but also as accurate as possible. However, since en-
tirely wrong detections would skew the RMSE, pre-
dictions x
p
∈ Z that are further away from the ground
truth x
g
∈ Z than the radius r ∈ R of the circle are
discarded from the inlier set ι:
ι = {x
p
| ∥x
p
− x
g
∥
2
< r} (6)
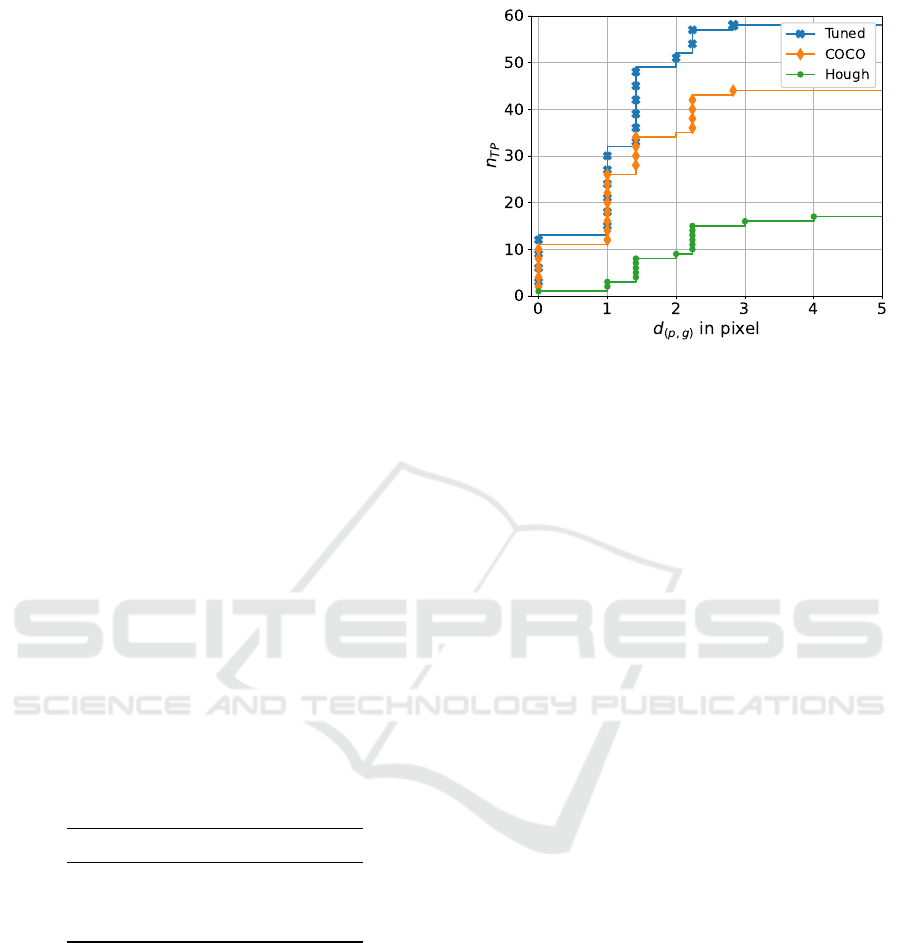
Overall Table 4 and Figure 6 show that the deep
learning-based approaches outperform the Hough cir-
cle detections, not only in the number of successful
predictions but also in accuracy. Additionally, the
fine-tuned model can detect significantly more circles
and is more accurate than the pre-trained model.
Table 4: Detection success and RMSE of deep and Hough
circle detection.
Detection method n
TP
RMSE
Tuned model 58 1.0
COCO model 44 1.14
Hough circles 17 1.73
6 CONCLUSION
In this paper, a new multimodal dataset under control-
lable weather conditions was introduced. The dataset
contains image data from an industrial stereo camera
and two solid-state LiDARS. The data was originally
recorded using a ROS bag, but converted into images
and point cloud data with corresponding timestamps
to ease the usage of the dataset.
Additionally, the impact of the weather conditions
on the sensor data was investigated by correlating the
Figure 6: Cumulative distribution of Euclidean distances
for successful detections using tuned model, COCO model,
and Hough circle detection.
entropy of pixels in images and the number of in-
liers of a spherical target in point clouds with different
weather conditions (rain and fog). With the incremen-
tal change in distance and weather intensity, we could
quantify the impact of weather at different distances
on sensor data and showed that rain and fog cause sig-
nificant sensor degradation at certain combinations of
intensity and distances. However, the sensor data for
the fog measurements at 15 m does not fit to the re-
maining observations and may require further investi-
gations or even a repetition of this particular measure-
ment.
Additionally, the circle detection shows that com-
bining calibration methods with deep learning can in-
crease calibration robustness, since the calibration tar-
gets can be detected more robustly, especially if the
model is fine-tuned utilising images from the calibra-
tion target.
7 FUTURE WORK
As Figure 4 shows, fog measurements show a non-
linear increase of the entropy over the fog visibil-
ity, however due to missing data points the entropy
can not be quantified for higher visibility values than
V
F
> 50 m for measurements recorded at a distance of
5 m. Additionally, most measurements show too few
data points to fit robustly a model into the increase
of the entropy and the number of inliers over the fog
visibility. By repeating the data recording, new data
points could be provided that would help to fit mod-
els into the data points, that potentially quantify the
non-linear increase.
Sensor Calibration and Data Analysis of the MuFoRa Dataset
629

ACKNOWLEDGEMENT
The authors thank the Bayerisches Verbund-
forschungsprogramm (BayVFP) of the Free State
of Bavaria for funding the research project BARCS
(DIK0351) in the funding line Digitization and the
research center CARISSMA.
REFERENCES
Akiba, T., Sano, S., Yanase, T., Ohta, T., and Koyama, M.
Optuna: A next-generation hyperparameter optimiza-
tion framework. https://doi.org/10.48550/arXiv.1907.
10902
Ayala, R. and Mohd, T. K. (2021). Sensors in autonomous
vehicles: A survey. Journal of Autonomous Vehicles
and Systems, 1(3):031003.
Bengler, K., Dietmayer, K., Farber, B., Maurer, M., Stiller,
C., and Winner, H. (2014). Three decades of driver
assistance systems: Review and future perspectives.
IEEE Intelligent transportation systems magazine,
6(4):6–22.
Bentley, J. L. Multidimensional binary search trees
used for associative searching. Communications
of the ACM, 18(9):509–517. https://doi.org/10.1145/
361002.361007
Bijelic, M., Gruber, T., Mannan, F., Kraus, F., Ritter, W.,
Dietmayer, K., and Heide, F. (2020). Seeing through
fog without seeing fog: Deep multimodal sensor fu-
sion in unseen adverse weather. Proceedings of the
IEEE/CVF Conference on Computer Vision and Pat-
tern Recognition, pages 11682–11692.
Bijelic, M., Gruber, T., and Ritter, W. A benchmark for
lidar sensors in fog: Is detection breaking down? 2018
IEEE Intelligent Vehicles Symposium (IV), pages 760–
767. https: //doi.org/10.1109/IVS.2018.8500543
Blickfeld. Qb2 quick start manual and safety infor-
mation. (Manual No. Rev1.1-20230801). Mu-
nich. Retrieved January 11, 2024, from https:
//www.blickfeld.com/wp-content/uploads/2023/09/
Qb2-Quick-start-manual-and-safetyinformation.pdf
Bradski, G. The OpenCV library. Dr. Dobb’s Journal of
Software Tools.
Broedermann, T., Sakaridis, C., Fu, Y., and Van Gool, L.
(2024). Condition-aware multimodal fusion for robust
semantic perception of driving scenes. arXiv preprint
arXiv:2410.10791.
Burnett, K., Yoon, D. J., Wu, Y., Li, A. Z., Zhang, H., Lu,
S., Qian, J., Tseng, W.-K., Lambert, A., Leung, K. Y.,
et al. (2023). Boreas: A multi-season autonomous
driving dataset. The International Journal of Robotics
Research, 42(1-2):33–42.
Carion, N., Massa, F., Synnaeve, G., Usunier, N., Kirillov,
A., and Zagoruyko, S. (2020). End-to-end object de-
tection with transformers. https://arxiv.org/abs/2005.
12872
Comission, I. E. CEI IEC 60529. Retrieved October
22, 2024, from https://webstore.iec.ch/en/publication/
2447
Corral-Soto, E. R. and Bingbing, L. (2020). Understand-
ing strengths and weaknesses of complementary sen-
sor modalities in early fusion for object detection.
2020 IEEE Intelligent Vehicles Symposium (IV), pages
1785–1792.
Cortinhas, S. (2023). Sports Balls - multiclass image
classification. Retrieved October 22, 2024, from
https://www.kaggle.com/datasets/samuelcortinhas/
sports-balls-multiclass-imageclassification/ data
Diaz-Ruiz, C. A., Xia, Y., You, Y., Nino, J., Chen, J., Mon-
ica, J., Chen, X., Luo, K., Wang, Y., Emond, M., et al.
(2022). Ithaca365: Dataset and driving perception un-
der repeated and challenging weather conditions. Pro-
ceedings of the IEEE/CVF Conference on Computer
Vision and Pattern Recognition, pages 21383–21392.
Dwyer, B., Nelson, J., Hansen, T., et al. (2024). Roboflow
(version 1.0). [Software]. https://roboflow.com
Fadl, I., Sch
¨
on, T., Behret, V., Brandmeier, T., Palme, F.,
and Helmer, T. (2025). Environment setup and model
benchmark of the mufora dataset. Accepted at VIS-
APP 2025.
Feng, D., Haase-Sch
¨
utz, C., Rosenbaum, L., Hertlein,
H., Glaeser, C., Timm, F., Wiesbeck, W., and Di-
etmayer, K. (2020). Deep multi-modal object de-
tection and semantic segmentation for autonomous
driving: Datasets, methods, and challenges. IEEE
Transactions on Intelligent Transportation Systems,
22(3):1341–1360.
Franchi, G., Yu, X., Bursuc, A., Tena, A., Kazmierczak,
R., Dubuisson, S., Aldea, E., and Filliat, D. (2022).
Muad: Multiple uncertainties for autonomous driving,
a benchmark for multiple uncertainty types and tasks.
arXiv preprint arXiv:2203.01437.
Google. How our cars drive - waymo one help. Retrieved
January 10, 2024, from https://support.google.com/
waymo/answer/9190838?hl=en
Gruber, T., Bijelic, M., Heide, F., Ritter, W., and Dietmayer,
K. (2019). Pixel-accurate depth evaluation in realistic
driving scenarios. 2019 International Conference on
3D Vision (3DV), pages 95–105.
Guerra, J. C. V., Khanam, Z., Ehsan, S., Stolkin, R.,
and McDonald-Maier, K. (2018). Weather classifi-
cation: A new multi-class dataset, data augmenta-
tion approach and comprehensive evaluations of con-
volutional neural networks. 2018 NASA/ESA Confer-
ence on Adaptive Hardware and Systems (AHS), pages
305–310.
Juliussen, E. Gadzooks! a worthy robo-taxi from zoox. Re-
trieved January 11, 2024, from https://www.eetimes.
com/gadzooks-a-worthy-robo-taxi-from-zoox/
Karvat, M. and Givigi, S. (2024). Adver-city: Open-
source multi-modal dataset for collaborative percep-
tion under adverse weather conditions. arXiv preprint
arXiv:2410.06380.
Kassir, A. and Peynot, T. (2010). Reliable automatic
camera-laser calibration. Proceedings of the 2010
VISAPP 2025 - 20th International Conference on Computer Vision Theory and Applications
630

Australasian Conference on Robotics & Automation,
pages 1–10.
Kenk, M. A. and Hassaballah, M. (2020). Dawn: vehi-
cle detection in adverse weather nature dataset. arXiv
preprint arXiv:2008.05402.
Lin, T.-Y., Maire, M., Belongie, S., Bourdev, L., Girshick,
R., Hays, J., Perona, P., Ramanan, D., Zitnick, C. L.,
and Doll
´
ar, P. (2015). Microsoft coco: Common ob-
jects in context. https://arxiv.org/abs/1405.0312
Macenski, S., Foote, T., Gerkey, B., Lalancette, C., and
Woodall, W. Robot operating system 2: Design, ar-
chitecture, and uses in the wild. Science Robotics,
7(66), eabm6074. https://doi.org/10.1126/scirobotics.
abm6074
Maddern, W., Pascoe, G., Linegar, C., and Newman, P.
(2017). 1 year, 1000 km: The oxford robotcar
dataset. The International Journal of Robotics Re-
search, 36(1):3–15.
Marathe, A., Ramanan, D., Walambe, R., and Kotecha,
K. (2023). Wedge: A multi-weather autonomous
driving dataset built from generative vision-language
models. Proceedings of the IEEE/CVF conference on
computer vision and pattern recognition, pages 3318–
3327.
Matuszka, T., Barton, I., Butykai,
´
A., Hajas, P., Kiss,
D., Kov
´
acs, D., Kuns
´
agi-M
´
at
´
e, S., Lengyel, P.,
N
´
emeth, G., Pet
˝
o, L., et al. (2022). aimotive
dataset: A multimodal dataset for robust autonomous
driving with long-range perception. arXiv preprint
arXiv:2211.09445.
Merkel, D. Docker: Lightweight linux containers for
consistent development and deployment. Linux
Journal, 2014, 2. Retrieved March 22, 2023, from
https://www.linuxjournal.com/content/docker-
lightweight-linux-containers-consistent-
development-and-deployment
Moghadam, P., Bosse, M., and Zlot, R. (2013). Line-based
extrinsic calibration of range and image sensors. 2013
IEEE International Conference on Robotics and Au-
tomation, pages 3685–3691.
NVIDIA. NVIDIA/nvidia-container-toolkit. original-
date: 2019-11-14T20:11:16Z. Nvidia Corporation.
Retrieved February 8, 2024, from https://github.com/
NVIDIA/nvidia-container-toolkit
Shannon, C. E. A mathematical theory of communication.
27(3):379–423. The Bell System Technical Journal,
27(3), 379–423. https://doi.org/10.1002/j.1538-7305.
1948.tb01338.x
Sheeny, M., De Pellegrin, E., Mukherjee, S., Ahrabian, A.,
Wang, S., and Wallace, A. (2021). Radiate: A radar
dataset for automotive perception in bad weather.
2021 IEEE International Conference on Robotics and
Automation (ICRA), pages 1–7.
Stereolabs. ZED 2i stereo camera. Stereolabs store]. Re-
trieved January 14, 2024, from https://store.stereolabs.
com/en-es/products/zed-2i
Taylor, Z., Nieto, J., and Johnson, D. (2015). Multi-modal
sensor calibration using a gradient orientation mea-
sure. Journal of Field Robotics, 32(5):675–695.
Toth, T., Pusztai, Z., and Hajder, L. Automatic
LiDAR-camera calibration of extrinsic pa-
rameters using a spherical target. 2020
IEEE International Conference on Robotics
and Automation (ICRA), pages 8580–8586.
https://doi.org/10.1109/ICRA40945.2020.9197316
Watanabe, S. Tree-structured parzen estimator: Under-
standing its algorithm components and their roles
for better empirical performance. https://doi.org/10.
48550/arXiv.2304.11127
Zhang, Q. and Pless, R. (2004). Extrinsic calibration of a
camera and laser range finder (improves camera cali-
bration). 2004 IEEE/RSJ International Conference on
Intelligent Robots and Systems (IROS)(IEEE Cat. No.
04CH37566), 3:2301–2306.
Zhang, Y., Carballo, A., Yang, H., and Takeda, K. (2023).
Perception and sensing for autonomous vehicles under
adverse weather conditions: A survey. ISPRS Journal
of Photogrammetry and Remote Sensing, 196:146–
177.
Zhang, Y., Ding, M., Yang, H., Niu, Y., Ge, M., Ohtani, K.,
Zhang, C., and Takeda, K. (2024). Lidar point cloud
augmentation for adverse conditions using conditional
generative model. Remote Sensing, 16(12):2247.
Zhu, Y., Li, C., and Zhang, Y. (2020). Online camera-lidar
calibration with sensor semantic information. 2020
IEEE International Conference on Robotics and Au-
tomation (ICRA), pages 4970–4976.
Sensor Calibration and Data Analysis of the MuFoRa Dataset
631
