Colorimetric Compensation in Video Mapping for Luggage Inspection
Ma
¨
elan Poyer
1,2
and Christophe Hurter
1
1
Ecole Nationale de l’Aviation Civile, Toulouse, France
2
Thales AVS, V
´
elizy-Villacoublay, France
Keywords:
Video Mapping, Colorimetric Compensation, Luggage Inspection, Interpolation.
Abstract:
Airport luggage inspection agents work under time pressure to identify and localize dangerous items using
three-dimensional scans. Video mapping can significantly enhance speed and efficiency by projecting real-
time information helping to localize threats to be removed. However, maintaining color fidelity is crucial, as
accurate color representation provides key information for decision-making. Previous research has explored
color correction techniques for complex surfaces, but these often require extensive calibration, limiting their
real-time applicability. Our approach addresses this limitation by using a pre-recorded database to maintain
color compensation without the need for frequent recalibration. We built this colorimetric database that records
how surfaces with similar textures reflect colors. Using Shepard’s interpolation, our algorithm generalizes the
color correction to new surfaces with similar textures, allowing for real-time adjustments without interrupting
workflow. This paper aims to lay the foundation for large-scale studies. The results show good performance for
hues such as orange but the method’s effectiveness varies across the color spectrum, with limited improvements
on blue hues due to predictable losses in luminance and saturation. This highlights the need for new techniques
to overcome the physical limitations of projectors.
1 INTRODUCTION
Luggage inspection is a safety-critical environment,
meaning that operations are carried out under signif-
icant pressure to achieve specific tasks within strict
time limits. These settings often involve high-stakes
decision-making. Delays or inefficiencies in such
contexts can have serious consequences, including
threats to security, safety, or operational efficiency.
Security checkpoint operators use three-dimensional
scans of luggage to identify and localize threats or
dangerous items. This highlights the need to clearly
differentiate the virtual representation of luggage, de-
rived from scans, from the physical luggage being
inspected. The transfer function renders the vir-
tual volume of the luggage based on its X-ray ab-
sorbance (Drebin et al., 1988; Metz and Doi, 1979;
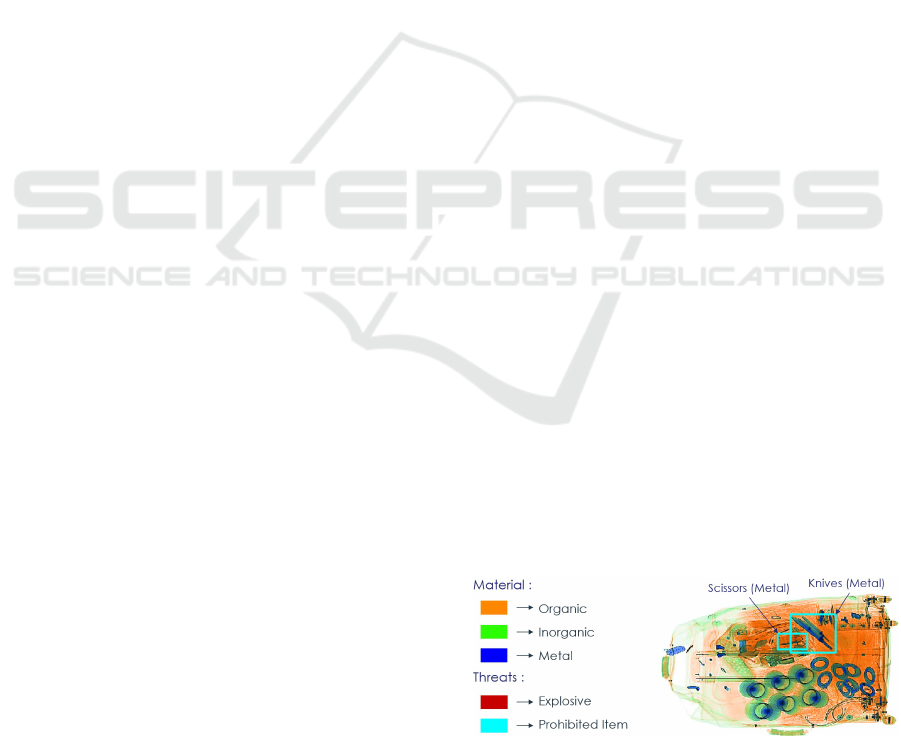
Kindlmann, 2002). Therefore, colors provide key in-
formation about the materials constituting the objects,
aiding in their recognition—Orange for organics,
green for inorganics and blue for metals (Figure 1).
Under these high-pressure conditions, the preattentive
processing (Treisman and Gelade, 1980) allows oper-
ators to instantly differentiate metal, which is often
the material constituting dangerous items, from other
materials. This ties into Bertin’s principles of semi-
ology of graphics (Bertin, 1983), where visual vari-
ables like color are essential for effective communi-
cation and interpretation of information in complex
visual environments. Furthermore, this also corre-
sponds to Gibson’s concept of ecological design (Gib-
son and Pick, 2000), which emphasizes that visual
cues should be clearly perceptible and aligned with
the task at hand to facilitate intuitive decision-making.
If the displayed colors are inaccurate, it can lead to
misinterpretation and slow the decision-making pro-
cess. Thus, maintaining precise color accuracy in crit-
ical applications is essential for ensuring effective and
reliable outcomes in these high-stakes environments.
Figure 1: Baggage Scanner Output with Color Mapping.
Colors represent different materials based on their density
and composition.
Poyer, M. and Hurter, C.
Colorimetric Compensation in Video Mapping for Luggage Inspection.
DOI: 10.5220/0013312200003912
Paper published under CC license (CC BY-NC-ND 4.0)
In Proceedings of the 20th International Joint Conference on Computer Vision, Imaging and Computer Graphics Theory and Applications (VISIGRAPP 2025) - Volume 1: GRAPP, HUCAPP
and IVAPP, pages 947-954
ISBN: 978-989-758-728-3; ISSN: 2184-4321
Proceedings Copyright © 2025 by SCITEPRESS – Science and Technology Publications, Lda.
947
In such environments, real-time processing, rapid
adaptability, and high accuracy are essential, as even
minor errors or small loss of concentration can have
cascading effects, potentially compromising the mis-
sion’s objectives or endangering lives (Ensley, 1995).
However, studies on luggage screening (Rieger et al.,
2021) highlight how factors like time pressure, au-
tomation aids, and target expectancy influence visual
search behavior and performance in security contexts.
For that reason, new visualization techniques (Klein,
2008; Hurter et al., 2014; Traor
´
e et al., 2018) need
to be find in order to improve efficiency and safety
of luggage inspection. According to Milgram, direct
viewing the virtual data allows the user to better un-
derstand the link with the real world (Milgram and
Kishino, 1994). Therefore, in these types of environ-
ments, video mapping technology has the potential to
significantly accelerate decision-making processes by
enhancing situational awareness and providing real-
time visual augmentations (Berard and Louis, 2017;
Wang et al., 2020; Sutherland et al., 2019; Douglas
et al., 2016). By projecting images or information di-
rectly onto complex surfaces, video mapping allows
for quick and precise visualization of critical data in
a way that is easily interpretable. For instance, Pana-
sonic’s Medical Imaging Projection System (Nishino
et al., 2018) enables surgeons to perform precise in-
terventions without needing to switch focus between
monitors and the patient, significantly improving sur-
gical efficiency and decision-making speed during
complex procedures. This approach can be extended
to other high-stakes environments, such as airport se-
curity, where the ability to quickly and accurately vi-
sualize objects can streamline inspections and reduce
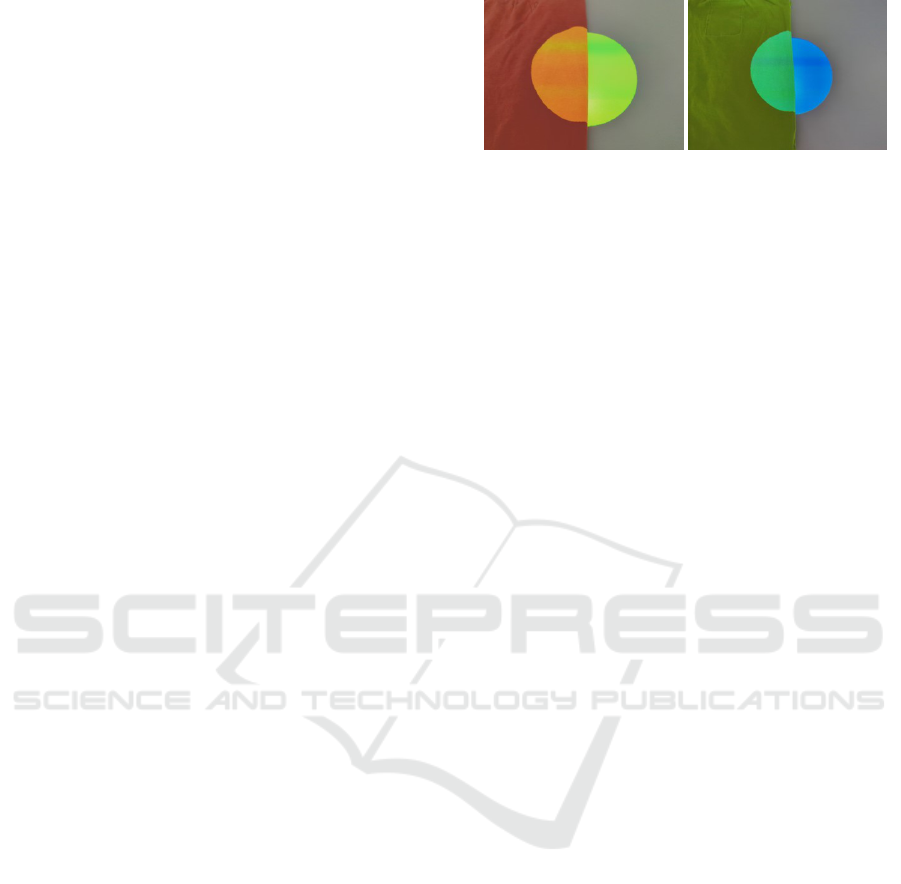
decision-making times. Nonetheless, as shown on
Figure 2, projection mapping can distort colors due to
the interaction between the projected light and the sur-
face properties, such as texture, color, and reflective
characteristics. These interactions cause color shifts
or accuracy loss in the projection. In critical environ-
ments, this distortion can lead to misleading informa-
tion. Indeed, the operator can misinterpret the ma-
terial information provided by the color and take the
wrong decisions.
This paper aims to be a fundation for larger-scale
studies on color correction algorithm for luggage in-
spection videomapping.
2 RELATED WORK
The issue of radiometric compensation in video map-
ping has been explored through various methods.
A notable contribution comes from Yoshida et al.
Figure 2: Projection on colored surfaces. Green reflected on
a red surface becomes orange and blue reflected on a green
surface becomes green. In luggage search, this means that,
on the left, a medium-density material (green), like plastic
explosives, would appear the same as a piece of clothe (or-
ange). On the right, a metal (blue), would appear the same
as medium-density materials (green).
(Yoshida et al., 2003), who proposed an approach
based on solving optical equations. Their method
provides precise control of color fidelity across dif-
ferent surfaces by compensating for variations in the
surface’s reflection and absorption properties. The
approach works by projecting four reference colors
onto the scene and calculating a transformation matrix
for real-time adjustments. Following the approach by
Yoshida et al., Matthew Post et al. (Post et al., 2018)
and Anselm Grundh
¨
ofer & Daisuke Iwai (Grundh
¨
ofer
and Iwai, 2015) developed two significant techniques
aimed at applying colorimetric compensation without
the need for prior radiometric calibration of the video
projector. This advancement reduced the setup time
traditionally required in video mapping applications,
making these techniques more practical in scenarios
where quick adaptations are needed.
However, while these methods are effective in
static environments, they proves less efficient in dy-
namic contexts where surfaces move or change shape,
as the calibration requires projecting these reference
colors whenever the scene changes, limiting its ap-
plicability in scenarios with frequent or rapid change.
In critical and time-sensitive contexts, such as airport
luggage inspections or medical surgeries, delays or
interruptions in the workflow can occur. These inter-
ruptions happen because the projection system must
readjust for each new item or surface condition. Thus,
while these methods significantly advanced the field,
they still do not fully address the challenge of main-
taining continuous, real-time color accuracy with-
out interruptions (Post et al., 2018; Grundh
¨
ofer and
Iwai, 2015). Nevertheless, Anselm Grundh
¨
ofer and
Oliver Bimber advanced colorimetric correction by
developing a technique that adapts to real-time vari-
ations in the scene (Grundh
¨
ofer and Bimber, 2006).
Their method allows the system to continuously ad-
just the projection as the surface properties, such as
texture and lighting, change. This real-time adapt-
ability made their approach highly effective for dy-
IVAPP 2025 - 16th International Conference on Information Visualization Theory and Applications
948

namic environments, ensuring the overall consistency
of the projected image. However, their technique re-
quires certain compromises regarding the brightness
and contrast of the image. These concessions arise be-
cause their primary objective is to maintain the global
integrity of the image rather than ensuring perfect
color fidelity. As a result, while the projection re-
mains stable and adaptable, the precise accuracy of
colors is sometimes sacrificed in favor of a broader
focus on maintaining image stability under variable
conditions.
Recent advances (Park et al., 2022; Bokaris et al.,
2015) have explored the use of optimization tech-
niques and artificial intelligence (AI) for surface
recognition and projection adjustments. These meth-
ods leverage machine learning algorithms to dynami-
cally detect surface properties and adapt the projected
content accordingly, enhancing the system’s ability
to deal with complex and varied surfaces. While
these approaches are promising in terms of increasing
adaptability and reducing the need for manual inter-
vention, they come with significant drawbacks. The
most notable issues are visual artifacts and loss of
detail, particularly when fine-grained accuracy is re-
quired. These artifacts can be highly problematic in
contexts where precise inspection of objects is cru-
cial, such as in security screening or medical surg-
eries, where even minor inaccuracies can lead to sig-
nificant errors or oversights. Nonetheless, their work
also highlighted the limitations of Digital Light Pro-
cessing projectors (DLP), which decompose colors
at high speeds, making it difficult to achieve flexible
and precise colorimetric correction in rapidly chang-
ing environments.
These existing techniques highlight both the
progress and limitations in the field of color correc-
tion for video mapping. While substantial improve-
ments have been made, existing methods often strug-
gle with accurate color reproduction when project-
ing onto surfaces with varying textures, materials,
and lighting conditions, which is crucial when colors
carry specific meanings, such as indicating threats in
luggage inspections or guiding surgical interventions.
Our contribution is a novel approach for im-
proving color fidelity in video mapping, particu-
larly in critical environments such as airport secu-
rity and medical settings. To address these chal-
lenges, our approach capitalizes on the specific con-
textual consistency of the materials used in projec-
tion environments, such as fabric in luggage inspec-
tions. Although the colors of these surfaces may
vary—depending on the objects within a bag—the
underlying material properties remain relatively con-
stant. This consistency allows us to develop a
color correction algorithm based on a pre-constructed
database. This avoids the need for recalibration
for every new surface or lighting change, making
our method usable in critical time-constrained en-
vironments. This method can easily be adapted to
other materials or use cases by simply expanding the
database.
3 MATERIALS AND METHODS
In this paper, we focus on the luggage inspection sce-
nario, where the goal is to identify and differenti-
ate between materials based on their projected col-
ors. In such environments, the surfaces being in-
spected are typically colored fabrics found in lug-
gage—representing various items of clothing, tex-
tiles, and other objects. The challenge is to main-
tain accurate color representation across these diverse
surfaces to properly identify the types of materials
present. To aid in this identification process, we
project three distinct colors onto the fabric surfaces,
each representing a different type of material: orange
for organics (e.g., food or leather), green for inorgan-
ics (e.g., plastics), and blue for metals. Therefore,
these are the colors and material categories that will
form the basis of our investigation. Our goal is to en-
sure that, regardless of the color or texture of the fab-
ric surfaces being projected onto, the system can ac-
curately represent these materials using the assigned
colors. Any deviation in color fidelity could result
in misidentifying the nature of the objects in the lug-
gage, affecting both security and efficiency.
This section is organized into three parts. The
first part details the construction of a colorimetric
database, which serves as the foundation for our al-
gorithm. The subsequent parts describe the algorithm
itself and the two user experiments conducted to vali-
date our hypotheses.
3.1 Construction of the Colorimetric
Database
With this context in mind, we proceed to build a
colorimetric database to support dynamic color cor-
rection during real-time baggage inspections. This
database included three key elements: ID, which
uniquely identifies each surface tested, Projected
Color (the color projected onto the surface), and Per-
ceived Color (the color as it is reflected and per-
ceived). We sampled RGB (Red, Green, Blue) values
ranging from 0 to 255, in increments of 5, generat-
ing a total of 52³ elements for each of the three pieces
of fabric. An example is represented on Table 1. To
Colorimetric Compensation in Video Mapping for Luggage Inspection
949
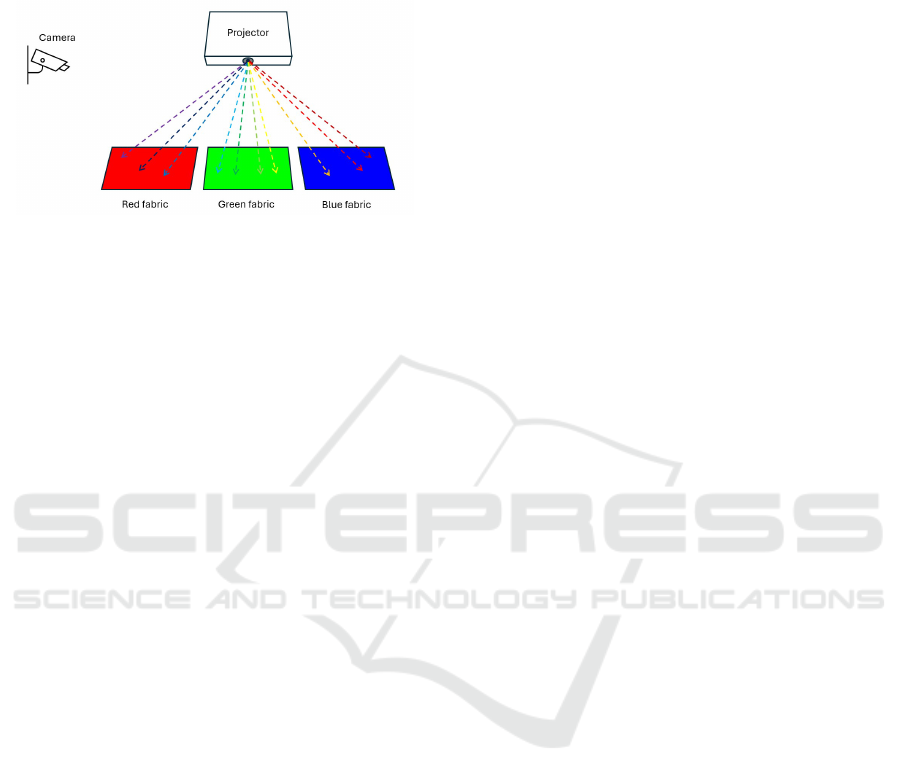
achieve this, as shown on Figure 3 we project the
complete range of colors that the projector can repro-
duce (known as the gamut) onto materials that share
similar textures and properties but differ in color.
Figure 3: Building of the colorimetric database. To build it,
the complete gamut of the projector has been projected onto
three pieces of fabrics.
By projecting the full spectrum of colors, we en-
sure that our database captures the entire set of pos-
sible interactions between the projected light and the
surface, providing a comprehensive reference for real-
time color correction. A lamp-based projector was
used to avoid DLP color deconstruction. The materi-
als chosen for this experiment consist of three pieces
of clothing in the colors red, green, and blue. We
chose them to cover a maximum range of the color
wheel with a minimum of colors. Each garment is
made from the same type of fabric to ensure that
only the color—not the texture or material proper-
ties—varies across the projection surfaces. This al-
lows us to isolate the effect of color on the projection,
ensuring that the colorimetric data recorded reflects
the response to different hues rather than surface vari-
ations. We measure the reflected color using a cam-
era with manual exposure and white balance settings.
Calibration of the projector and camera is not neces-
sary in this context, as the primary objective is to test
the method itself rather than to fully optimize the sys-
tem for practical applications like baggage inspection.
This approach allows us to focus on the method’s ef-
fectiveness without being constrained by hardware-
specific adjustments. (Figure 3)
3.2 First Experiment: Testing Color
Corrections for Surfaces in the
Database
The next step in our process is to determine the op-
timal color correction for each surface in the colori-
metric database. Since we have recorded a sample the
gamut of perceptible colors for the three selected sur-
faces, our task now is to select the best matching color
for each surface in real-time projections.
To ensure optimal color fidelity, we tested two
different selections for minimizing the difference be-
tween the expected color (the color intended for pro-
jection) and the reflected color (the color perceived
after projection on the surface). The industry standard
for measuring color differences is the DeltaE 2000
(CIEDE2000)(Sharma et al., 2005) in CIELab col-
ors space. We used it for our first correction method.
We called this method DeltaE Correction. However,
the presented scenario do not requires color accuracy
in the traditional sense but rather when the color re-
sults in a misclassification. Therefore, for our sec-
ond correction method, we used the HSL color space
and we selected the closest color from the colorimet-
ric database with a maximum deviation of 5 degrees
in the hue angle. This method ensures that the pro-
jected color maintains a perceptually close hue to the
intended color, while also ensuring that the saturation
and brightness remain within acceptable thresholds
to ensure the recognition of the hue. We called this
method Hue Correction.
To evaluate the performance of the proposed cor-
rections, we conducted an experiment designed to test
the system’s ability to maintain color fidelity across
various projection surfaces. The experiment involved
projecting different colors onto a range of materials
and asking participants to rank the accuracy of the
color reproduction against a reference color. The ex-
periment involved 17 participants (4 females and 13
males), aged between 25 and 38, all without color
blindness and from diverse research labs. Three types
of fabric were selected as projection surfaces, repre-
senting red, green, and blue base materials. For the
projections, three target colors—orange, green, and
blue—were chosen, along with their respective cor-
rections, as these correspond to key material cate-
gories in baggage inspection: organic, inorganic, and
metallic. During each trial, participants were shown
three variations of the projected colors on the same
surface: one without any color correction, one with
Hue Correction applied, and one with DeltaE Correc-
tion.
As shown on Figure 4, the participants were
tasked with ranking the three projected colors from
closest to farthest in relation to a reference color dis-
played alongside them. This ranking system allowed
us to gather data on which method produced the most
perceptually accurate colors on the different fabrics.
Each participant completed four trials for each color-
surface combination to account for variability in per-
ception and ensure the robustness of the results. This
means that in total, each of the participants completed
36 rankings (four trials for each of the three colors
projected on the three pieces of fabric). On aver-
IVAPP 2025 - 16th International Conference on Information Visualization Theory and Applications
950
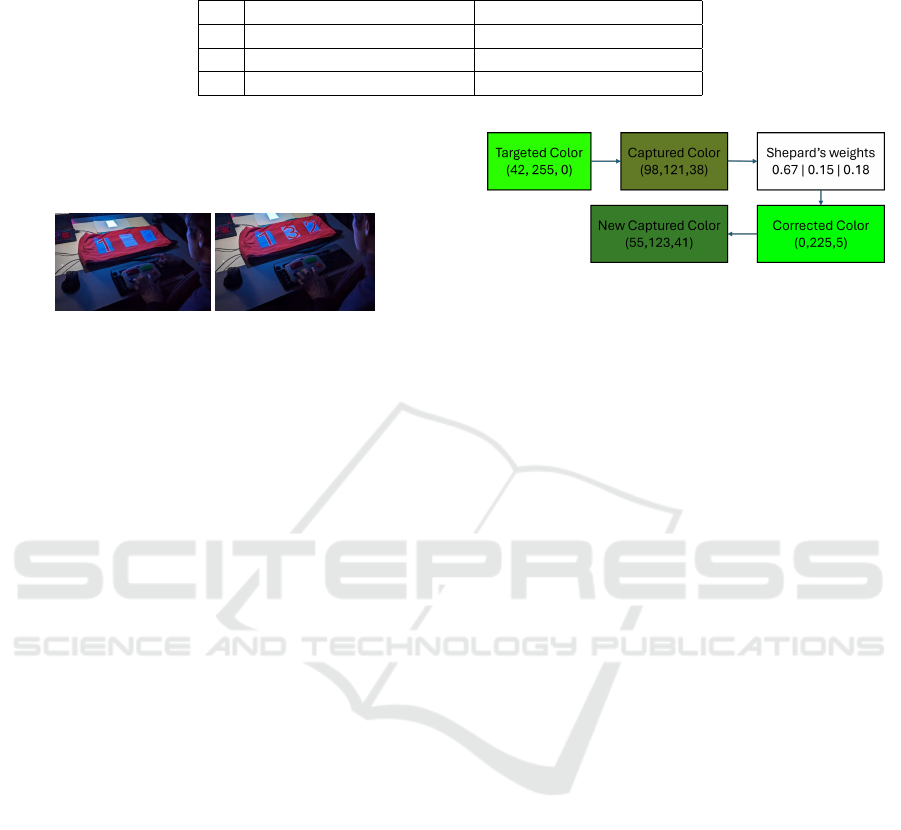
Table 1: An example of the colorimetric database, showing each surface’s ID, the projected color, and the perceived reflected
color. The data provided a reference for the system to apply color correction.
ID Projected Color (R,G,B) Reflected Color (R,G,B)
2 250,100,25 52,97,87
2 255,100,25 52,97,87
2 0,105,25 0,102,91
age, participants completed the task in fifteen min-
utes. Colors and pieces of fabric were presented in a
randomized order.
Figure 4: During the first experiment, participants were
asked to rank colors from the closer to the farthest to the
reference color projected above.
The results of this experiment are discussed in de-
tail in the following sections, where we analyze the
effectiveness of each correction method across differ-
ent materials. The generalization of the color correc-
tions to new surfaces has been tested throught a new
experiment.
3.3 Second Experiment: Testing the
Color Corrections on New Surfaces
Since it is impossible to have a database containing
all the possible colors, the purpose of our second ex-
periment is to test the generalization of our correction
methods to new surfaces made of the same material
but different colors. To generalize these two methods,
we implemented an interpolation method, which al-
lows the algorithm to estimate the appropriate color
correction for surfaces that were not part of the initial
database. As the colors have three components, we
needed a three dimensional linear interpolation. Thus,
we decided to use the generalization of Shepard’s in-
terpolation method(Shepard, 1968). This method al-
lowed us to compute a weighted average of the known
color values from the database. Shepard’s method as-
signs greater weight to the colors that are closer to the
current surface’s properties, ensuring that the final in-
terpolated color closely matches the surface’s behav-
ior. This minimized the color discrepancy between
the targeted color and the reflected color (Figure 5).
To test the generalized corrections, we proceeded
to repeat the previous experiment using new projec-
tion surfaces. Results are discussed in the next sec-
tions.
Figure 5: Pipeline of the color correction algorithm. The
camera-captured color is compared to the database using
Shepard’s interpolation, and the resulting weights are used
to compute the corrected color for projection.
4 RESULTS
This section presents the colorimetric database
recorded to compute the color correction methods and
the results of the two experiments which aimed at test-
ing the methods and their generalization.
4.1 The Colorimetric Database
The first phase of the experiment focused on con-
structing the colorimetric database, which served as
the foundation for the color correction process. In
typical color science, a color gamut is often repre-
sented using a chromaticity diagram, such as the CIE
1931 chromaticity diagram, which maps out colors
based on their hue and saturation. This 2D diagram
provides a clear way to visualize the range of colors
that can be produced by a device or material. How-
ever, while these diagrams are widely used, they have
an important limitation: they do not account for lu-
minance, which plays a crucial role in how colors are
perceived.
When representing the gamut reflected on pieces
of fabrics in the HSL color space (Hue, Saturation,
Luminance), it becomes evident that although we can
observe all hues, there is a loss of luminance in most
parts of the spectrum (Figure 6). In this space, while
hue and saturation are maintained, the luminance of
colors can vary significantly across the same hue,
leading to colors that appear darker or lighter depend-
ing on their positioning in the space. This loss of
brightness can affect the perception of colors, espe-
cially in real-world applications such as video map-
ping, where color fidelity across varying surfaces and
lighting conditions is critical.
Colorimetric Compensation in Video Mapping for Luggage Inspection
951
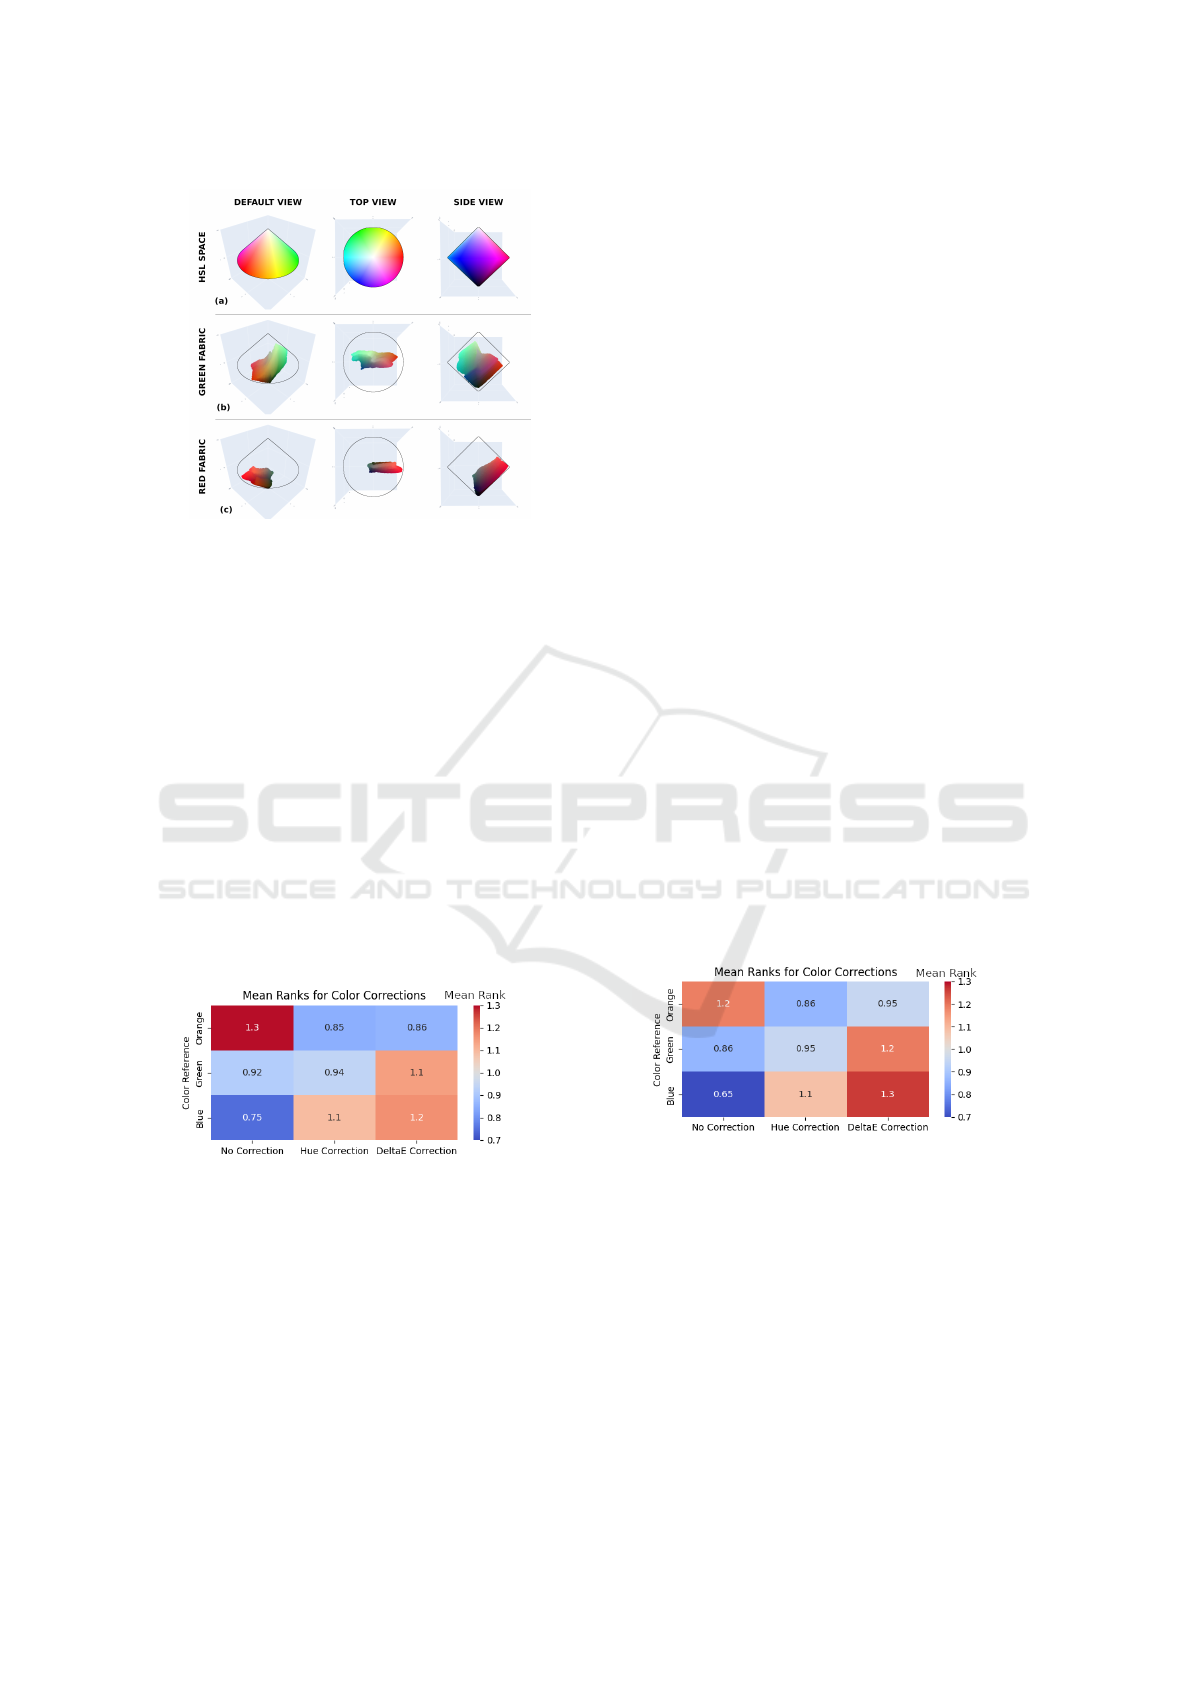
Figure 6: Representation of the projector’s color gamut in
the HSL space reflected on different surfaces. (a) The full
HSL space. (b) The gamut reflected on a green fabric sur-
face. (c) The gamut reflected on a red fabric surface.
4.2 The First Experiment
To compare the performance of the three color cor-
rection methods—without correction, Hue Correc-
tion, and DeltaE Correction—we applied the Fried-
man test (Sheldon et al., 1996), a non-parametric sta-
tistical test used to detect differences in participants’
rankings across repeated measures.
In order to highlight any differences between how
the corrections performed on various colors, we sepa-
rated the tests for the orange, green, and blue projec-
tions (Figure 7). This allowed us to evaluate whether
the performance of the color correction methods var-
ied depending on the color projected onto the sur-
faces.
Figure 7: Results of the first experiment. Both corrections
seem to perform better than the original color for the orange,
but not for the blue. For the green, the differences between
the methods are not significant.
• Orange: the results of the Friedman test indicated
a significant difference between the three color
correction methods, with a p-value less than 0.01,
demonstrating strong statistical evidence that the
correction methods impacted participants’ per-
ception of color accuracy. The mean ranks of the
three methods were as follows: 1.30 for no cor-
rection, 0.85 for the Hue Correction, and 0.86 for
the DeltaE Correction. These values indicate that
the corrected methods were ranked significantly
higher in terms of color accuracy compared to the
uncorrected condition.
• Green: the mean rankings were 0.92 for no cor-
rection, 0.94 for the Hue Correction, and 1.10
for the DeltaE Correction, with p-value less than
0.05, suggesting a moderate difference between
the methods.
• Blue: the Friedman test resulted in a p-value less
than 0.01, indicating a highly significant differ-
ence between the methods. The mean rankings
were 0.75 for no correction, and 1.2 for both
the Hue Correction and DeltaE Correction, with
uncorrected condition significantly outperforming
both methods.
The results show that the Hue Correction method
performed significantly better than the uncorrected
condition for the orange color, where it demonstrated
superior color fidelity. However, this same method
proved ineffective for the blue color. This suggests
that while the Hue Correction excels in certain con-
texts, it struggles with colors like blue, where the
reflected color loses too much saturation and lumi-
nance.
4.3 The Second Experiment
The second experiment was conducted with the same
parameters as the first one, allowing us to use the
same analytical tools to evaluate the results (Figure 8).
Figure 8: Results of the second experiment. They are sim-
ilar to the previous result, which confirms the efficiency of
Shepard’s Distance to compare similar textures.
• Orange: the p-value less than 0.01 indicated a
significant difference, with mean rankings of 1.20
for no correction, 0.86 for Hue Correction, and
0.95 for DeltaE, confirming the superiority of the
Hue Correction for maintaining color fidelity.
• Green: the mean rankings were 0.86 for no cor-
rection, 0.95 for Hue Correction, and 1.20 for
DeltaE, suggesting that the corrections were not
able to do better than the original color.
IVAPP 2025 - 16th International Conference on Information Visualization Theory and Applications
952

• Blue: the p-value less than 0.01 indicates an ex-
tremely significant difference between the meth-
ods. The mean rankings were 0.65 for no cor-
rection, 1.10 for Hue Correction, and 1.30 for
DeltaE, confirming that the corrections methods
struggle to accurately reproduce blue hues.
The use of Shepard’s interpolation to compare
similar projection surfaces appears to be effective,
as evidenced by the results of the second experi-
ment, which closely align with the findings from the
first. The consistency in performance across both
experiments suggests that this approach successfully
maintains color fidelity across different projection
surfaces. The results were similar, confirming that
the Hue Correction method worked well for orange,
while the uncorrected provided better results for blue
hue.
5 DISCUSSION
In this paper, we conducted a series of experiments
to have a fundation for large-scale study on our color
correction algorithm. Using a colorimetric database
and Shepard’s interpolation, we compensated color
variations across different surfaces with similar tex-
tures in video mapping. The goal was to maintain
color fidelity in real-time projections without frequent
recalibration, ensuring smooth and accurate color re-
production across varied projection surfaces. The re-
sults demonstrate that our color correction method
significantly outperforms the uncorrected condition
for colors close to orange. Within this range, the
hue of the light tends to shift slightly upon reflection,
which is why the algorithm can effectively compen-
sate for these deviations.
However, both correction methods struggled with
blue hues, as indicated by consistently poor results in
both trials. This result could have been predicted from
the database as the Figure 6 already showed that sur-
faces tend to do not reflect blue hues. This suggests
that the reflected blue color experiences a significant
loss in luminance and saturation, making it difficult
for the human eye to correctly identify the hue. The
loss of brightness causes the blue to appear too dark,
while the reduction in saturation diminishes its vivid-
ness, leading to a misinterpretation of the color. This
highlights a fundamental limitation of projectors, par-
ticularly when handling colors like blue. The pro-
jector’s inability to maintain sufficient luminance and
saturation in the reflected light significantly hampers
the accurate reproduction of blue hues.
One potential solution to address the limitations
of projector color accuracy, particularly for blue hues,
could be to explore the concept of simultaneous con-
trast(Mittelst
¨
adt et al., 2014). This phenomenon oc-
curs when the perception of a color is influenced
by the surrounding colors, potentially enhancing the
brightness and saturation of colors that might other-
wise appear too dark or muted. By adjusting the con-
trast of the surrounding colors in the projected scene,
it may be possible to counterbalance the loss of lumi-
nance and saturation in the blue hues, making them
appear more vivid and recognizable. Integrating si-
multaneous contrast adjustments into the color cor-
rection algorithm could help overcome the projector’s
inherent limitations (Akiyama et al., 2018). However,
this approach would require modifying the colors in
the projected image. In critical environments, where
the accurate representation of colors plays a crucial
role in decision-making, altering the surrounding col-
ors to improve the perception of blue could potentially
compromise the clarity or meaning of the projected
information. Therefore, while simultaneous contrast
is a promising solution, further research is necessary
to explore its applicability in contexts where color fi-
delity is essential and must remain consistent.
The algorithm could be easily adapted to other en-
vironments by adding additional projection surfaces
to the colorimetric database. As more surfaces are in-
corporated, the system becomes capable of handling a
wider range of materials and lighting conditions, fur-
ther enhancing its versatility. This flexibility allows
the algorithm to remain effective in environments be-
yond those initially tested. This makes the algorithm
suitable for critical environments where hues within
this spectrum are crucial for decision-making.
Being able to project any desired color not only
enhances color fidelity of the interface, but it also
allows for dynamic alterations in the appearance of
physical objects (Amano et al., 2012; Iwai and Sato,
2011). This capability opens up the potential for new
interactions by changing how objects are perceived.
For instance, it would be possible to diminish reality
(Mori et al., 2017) to help the user focusing on his
task.
ACKNOWLEDGEMENTS
We acknowledge the use of GPT-4o to correct the
grammar and syntax.
REFERENCES
Akiyama, R., Yamamoto, G., Amano, T., Taketomi,
T., Plopski, A., Sandor, C., and Kato, H. (2018).
Colorimetric Compensation in Video Mapping for Luggage Inspection
953

Light projection-induced illusion for controlling ob-
ject color. In 2018 IEEE Conference on Virtual Reality
and 3D User Interfaces (VR), pages 499–500. IEEE.
Amano, T., Komura, K., Sasabuchi, T., Nakano, S., and
Yamashita, S. (2012). Appearance control for human
material perception manipulation. In Proceedings of
the 21st international conference on pattern recogni-
tion (ICPR2012), pages 13–16. IEEE.
Berard, F. and Louis, T. (2017). The object inside: As-
sessing 3d examination with a spherical handheld
perspective-corrected display. In Proceedings of the
2017 CHI Conference on Human Factors in Comput-
ing Systems, pages 4396–4404.
Bertin, J. (1983). Semiology of graphics.
Bokaris, P.-A., Gouiff
`
es, M., Jacquemin, C., Chomaz, J.-
M., and Tr
´
emeau, A. (2015). One-frame delay for
dynamic photometric compensation in a projector-
camera system. In 2015 IEEE International Confer-
ence on Image Processing (ICIP), pages 2675–2679.
IEEE.
Douglas, D. B., Petricoin, E. F., Liotta, L., and Wilson, E.
(2016). D3d augmented reality imaging system: proof
of concept in mammography. Medical Devices: Evi-
dence and Research, pages 277–283.
Drebin, R. A., Carpenter, L., and Hanrahan, P. (1988). Vol-
ume rendering. ACM Siggraph Computer Graphics,
22(4):65–74.
Ensley, M. (1995). Toward a theory of situation awareness
in dynamic systems. Human factors, 37:85–104.
Gibson, E. J. and Pick, A. D. (2000). An ecological ap-
proach to perceptual learning and development. Ox-
ford University Press, USA.
Grundh
¨
ofer, A. and Bimber, O. (2006). Real-time adaptive
radiometric compensation. In ACM SIGGRAPH 2006
Research posters, pages 56–es.
Grundh
¨
ofer, A. and Iwai, D. (2015). Robust, error-tolerant
photometric projector compensation. IEEE Transac-
tions on Image Processing, 24(12):5086–5099.
Hurter, C., Taylor, R., Carpendale, S., and Telea, A. (2014).
Color tunneling: Interactive exploration and selection
in volumetric datasets. In 2014 IEEE Pacific Visual-
ization Symposium, pages 225–232. IEEE.
Iwai, D. and Sato, K. (2011). Document search support by
making physical documents transparent in projection-
based mixed reality. Virtual reality, 15:147–160.
Kindlmann, G. (2002). Transfer functions in direct vol-
ume rendering: Design, interface, interaction. Course
notes of ACM SIGGRAPH, 3.
Klein, G. (2008). Naturalistic decision making. Human
factors, 50(3):456–460.
Metz, C. E. and Doi, K. (1979). Transfer function analysis
of radiographic imaging systems. Physics in Medicine
& Biology, 24(6):1079.
Milgram, P. and Kishino, F. (1994). A taxonomy of mixed
reality visual displays. IEICE TRANSACTIONS on In-
formation and Systems, 77(12):1321–1329.
Mittelst
¨
adt, S., Stoffel, A., and Keim, D. A. (2014). Meth-
ods for compensating contrast effects in information
visualization. In Computer Graphics Forum, vol-
ume 33, pages 231–240. Wiley Online Library.
Mori, S., Ikeda, S., and Saito, H. (2017). A survey of di-
minished reality: Techniques for visually concealing,
eliminating, and seeing through real objects. IPSJ
Transactions on Computer Vision and Applications,
9:1–14.
Nishino, H., Hatano, E., Seo, S., Nitta, T., Saito, T., Naka-
mura, M., Hattori, K., Takatani, M., Fuji, H., Taura,
K., et al. (2018). Real-time navigation for liver surgery
using projection mapping with indocyanine green flu-
orescence: development of the novel medical imaging
projection system. Annals of surgery, 267(6):1134–
1140.
Park, J., Jung, D., and Moon, B. (2022). Projector com-
pensation framework using differentiable rendering.
IEEE Access, 10:44461–44470.
Post, M., Fieguth, P., Naiel, M. A., Azimifar, Z., and Lamm,
M. (2018). Fast radiometric compensation for nonlin-
ear projectors. Journal of Computational Vision and
Imaging Systems, 4(1):3–3.
Rieger, T., Heilmann, L., and Manzey, D. (2021). Visual
search behavior and performance in luggage screen-
ing: effects of time pressure, automation aid, and tar-
get expectancy. Cognitive Research: Principles and
Implications, 6:1–12.
Sharma, G., Wu, W., and Dalal, E. N. (2005). The
ciede2000 color-difference formula: Implementation
notes, supplementary test data, and mathematical ob-
servations. Color Research & Application, 30(1):21–
30.
Sheldon, M. R., Fillyaw, M. J., and Thompson, W. D.
(1996). The use and interpretation of the friedman test
in the analysis of ordinal-scale data in repeated mea-
sures designs. Physiotherapy Research International,
1(4):221–228.
Shepard, D. (1968). A two-dimensional interpolation func-
tion for irregularly-spaced data. In Proceedings of the
1968 23rd ACM national conference, pages 517–524.
Sutherland, J., Belec, J., Sheikh, A., Chepelev, L., Al-
thobaity, W., Chow, B. J., Mitsouras, D., Christensen,
A., Rybicki, F. J., and La Russa, D. J. (2019). Apply-
ing modern virtual and augmented reality technolo-
gies to medical images and models. Journal of digital
imaging, 32:38–53.
Traor
´
e, M., Hurter, C., and Telea, A. (2018). Interactive
obstruction-free lensing for volumetric data visualiza-
tion. IEEE transactions on visualization and computer
graphics, 25(1):1029–1039.
Treisman, A. M. and Gelade, G. (1980). A feature-
integration theory of attention. Cognitive psychology,
12(1):97–136.
Wang, X., Besanc¸on, L., Rousseau, D., Sereno, M., Ammi,
M., and Isenberg, T. (2020). Towards an understand-
ing of augmented reality extensions for existing 3d
data analysis tools. In Proceedings of the 2020 CHI
Conference on Human Factors in Computing Systems,
pages 1–13.
Yoshida, T., Horii, C., and Sato, K. (2003). A virtual color
reconstruction system for real heritage with light pro-
jection. In Proceedings of VSMM, volume 3, pages
1–7. Citeseer.
IVAPP 2025 - 16th International Conference on Information Visualization Theory and Applications
954
