
Uncertainty and Feature-Based Weighted Loss for 3D Wheat Part
Segmentation
R. Reena
1 a
, John H. Doonan
2 b
, Kevin Williams
2
, Fiona M. K. Corke
2
, Huaizhong Zhang
1
and
Yonghuai Liu
1
1
Edge Hill University, Lancashire, U.K.
2
National Plant Phenomics Centre, Aberystwyth University, U.K.
Keywords:
Plant Phenotyping, 3D Point Cloud, Wheat, Part Segmentation.
Abstract:
Deep learning techniques and point clouds have proved their efficacy in 3D segmentation tasks of objects.
Nevertheless, the accurate plant organ segmentation is a formidable challenge due to their complex structure
and variability. Furthermore, presence of over-represented and under-represented parts, occlusion, and uneven
distribution complicates the 3D part segmentation tasks. Even though deep learning techniques often exhibit
exceptional performance, they also face challenges in applications where accurate trait estimation is required.
To handle these issues, we propose a novel uncertainty and feature based weighted loss that incorporates un-
certainty metrics and features of the plant or crop. We use Gradient Attention Module (GAM) with PointNet++
baseline to validate our approach. By dynamically introducing uncertainty and feature scores into the training
process, it promotes more balanced learning. Through comprehensive evaluation, we illustrate the advantages
of UFL (Uncertainty and Feature based Loss) as compared to standard CE (Cross entropy loss) with our own
constructed real Wheat dataset. The outcomes demonstrate consistent improvements in Accuracy (ranging
from 0.9% to 4.2%) and Ear mIoU (ranging from 1.8% to 15.3%) over the standard Cross-Entropy (CE) loss
function. As a result, our work contributes to the development of more robust and reliable segmentation mod-
els. This approach not only pushes forward the boundaries of precision agriculture but also has the potential
to influence related areas where accurate segmentation is pivotal.
1 INTRODUCTION
Component phenotyping refers to the measurements
of different plant organs i.e., leaf and stem length, leaf
width, leaf area etc. These measurements are essen-
tial markers for tracking plant development and fore-
casting yield (Shen et al., 2024). The extraction of
morphological and architectural traits are critical for
high throughput plant phenotyping, which requires
precise segmentation of plant organs. Manual meth-
ods are dominant, quite labor intensive, and unable
to meet the requirements of analysis of large pop-
ulations (Minervini et al., 2015). In the past few
years, computer vision and deep learning techniques
have facilitated plant phenotyping (Mochida et al.,
2018). With the development of point cloud based
deep learning networks i.e., PointNet (Qi et al., 2016)
and its enhanced variant PointNet++ (Qi et al., 2017),
a
https://orcid.org/0009-0007-9642-4607
b
https://orcid.org/0000-0001-6027-1919
remarkable progress has been made in 3D point-based
deep neural networks. Besides its proliferation, cur-
rent deep learning approaches on point cloud data
are usually limited to synthetic datasets i.e. Mod-
elNet40 and ShapeNet (Chang et al., 2015), S3DIS
(Armeni et al., 2016) and their application of 3D real
world data for plant segmentation tasks is at its in-
fancy. One of the underlying reasons for their lim-
ited application in plant domain is the lack of rich
annotated datasets and their labeling process takes a
lot of manual power (Chaudhury et al., 2020). Real
datasets, particularly those concerning plants, exhibit
significant differences from their synthetic counter-
parts. In response, different architectures have been
developed for plant segmentation tasks (Turgut et al.,
2022), (Ghahremani et al., 2021), (Li et al., 2022).
These efforts highlight the ongoing advances in tai-
loring segmentation models to the unique challenges
presented by real agricultural data. Despite these in-
novations, achieving precise estimations remains a
challenge. Incorrect classification leads to erroneous
632
Reena, R., Doonan, J. H., Williams, K., Corke, F. M. K., Zhang, H. and Liu, Y.
Uncertainty and Feature-Based Weighted Loss for 3D Wheat Part Segmentation.
DOI: 10.5220/0013312300003912
Paper published under CC license (CC BY-NC-ND 4.0)
In Proceedings of the 20th International Joint Conference on Computer Vision, Imaging and Computer Graphics Theory and Applications (VISIGRAPP 2025) - Volume 2: VISAPP, pages
632-641
ISBN: 978-989-758-728-3; ISSN: 2184-4321
Proceedings Copyright © 2025 by SCITEPRESS – Science and Technology Publications, Lda.

estimates of the traits, which could significantly influ-
ence agricultural strategies and outcomes.
Previous research studies (Leibig et al., 2016;
Mukhoti et al., 2021; Kong et al., 2023) demonstrate
the significance of uncertainty quantification in im-
proving the robustness of model predictions. For in-
stance, (Wang et al., 2020) discusses incorporation of
uncertainty measure into their technique significantly
enhances both the accuracy and effectiveness of their
approach. Similarly, uncertainty quantification con-
cept is employed to enhance segmentation tasks in au-
tonomous driving applications, ensuring both safety
and reliability (Sun et al., 2024; Landgraf et al.,
2024). The uncertainty estimates are distinct from
softmax probabilities, by revealing the model’s con-
fidence in its predictions. These estimates help iden-
tify potential uncertainties within the data that could
lead to incorrect outcomes. Though utilization of un-
certainty is explored in segmentation tasks, it is under
explored in the agricultural domain as compared to
its frequent application in medical and automotive do-
mains. In this work we propose a novel UFL (Uncer-
tainty and Feature based Loss) to bridge this gap that
utilizes uncertainty estimation during training and in-
tegrate features of the wheat crop into the loss func-
tion to enhance the segmentation of the models. Pri-
marily, we leverage the model’s uncertainty estimates
to quantify the confidence levels of its predictions and
then incorporate important features. By integrating
feature importance analysis with uncertainty quantifi-
cation into a hybrid scoring mechanism within our
loss function, our approach adeptly identifies critical
features, such as wheat ear (spike) counts, that influ-
ence model predictions, while simultaneously quanti-
fying the associated uncertainties. We conduct exten-
sive experiments with our constructed Wheat dataset
that has three different varieties i.e. Paragon, Gladius
and Apogee to exhibit the effectiveness of our tech-
nique using GAM (Hu et al., 2023). The motivation is
that plants have quite complex structures and they var-
ied according to their environmental conditions. Our
findings demonstrate that innovative integration of the
loss function and the critical features significantly en-
hances the robustness of segmentation tasks. Precise
and accurate segmentation is quite crucial in plants
to make estimates about yield and making different
agricultural decisions. Lastly, we exemplify ablation
studies, limitations and future work of our study.
2 RELATED WORK
In the domain of segmentation and 3D object detec-
tion, numerous research studies have employed the
concept of uncertainty. We offer a summary of sig-
nificant studies that utilize uncertainty aware tech-
niques for computer vision tasks across different do-
mains. Over past few decades uncertainty estimation
has been prevailing topic of researchers in image pro-
cessing tasks. (Blundell et al., 2015) introduced the
use of a Gaussian distribution over network weights,
characterizing each weight with a mean and variance.
However, the discussed technique was not optimal
for deep learning architectures due to a large number
of model parameters. With similar motivation, (Gal
and Ghahramani, 2016) suggested using Monte Carlo
(MC) dropout to apply dropout techniques for vari-
ational inference. During training, neurons are ran-
domly dropped, creating a Bernoulli distribution over
the network weights. While testing, the same image is
fed through the network multiple times with dropout,
allowing for estimation of uncertainty from these out-
puts. Quantification of uncertainty is exercised in seg-
mentation and object detection tasks. This approach
is especially critical in autonomous driving scenarios,
where safety is a critical issue, as incorrect predictions
can result in severe consequences.
(Landgraf et al., 2024) has addressed this issue
with proposition of uncertainty aware segmentation
that will make estimates about the uncertainty dur-
ing training. On the basis of measures of uncertainty,
pixel-wise weight is attached to the regular cross en-
tropy loss to improve the segmentation performance.
With similar aim, panoptic segmentation is achieved
based on calibration of per pixel uncertainty estimates
(Sirohi et al., 2022). This study has covered seman-
tic and instance segmentation. In another study, un-
certainty estimation and segmentation module is pro-
posed to boost the segmentation performance in un-
certain regions by exploiting the uncertainty maps
(Bian et al., 2020). To handle imbalance issue in
segmentation tasks, (Bischke et al., 2018) has sug-
gested adaptive uncertainty weighted class loss to im-
prove the outcomes of neural network architectures.
A fuzzy uncertainty based method has been proposed
to expose out of distribution data samples for se-
mantic segmentation (Lin et al., 2023). The above
discussed technique integrates test-time augmentation
and Monte Carlo dropout with a trained segmenta-
tion model to generate multiple predictions, capturing
both data and model uncertainties. These predictions
form interval fuzzy sets, which are used to calculate
an image-level uncertainty score for identifying out-
of-distribution (OOD) samples. (Sun et al., 2024) has
explored label uncertainty or annotated uncertainty
information, for precise object detection in 3D data.
In the field of healthcare, (Leibig et al., 2016) has
utilized uncertainty information for disease detection.
Uncertainty and Feature-Based Weighted Loss for 3D Wheat Part Segmentation
633
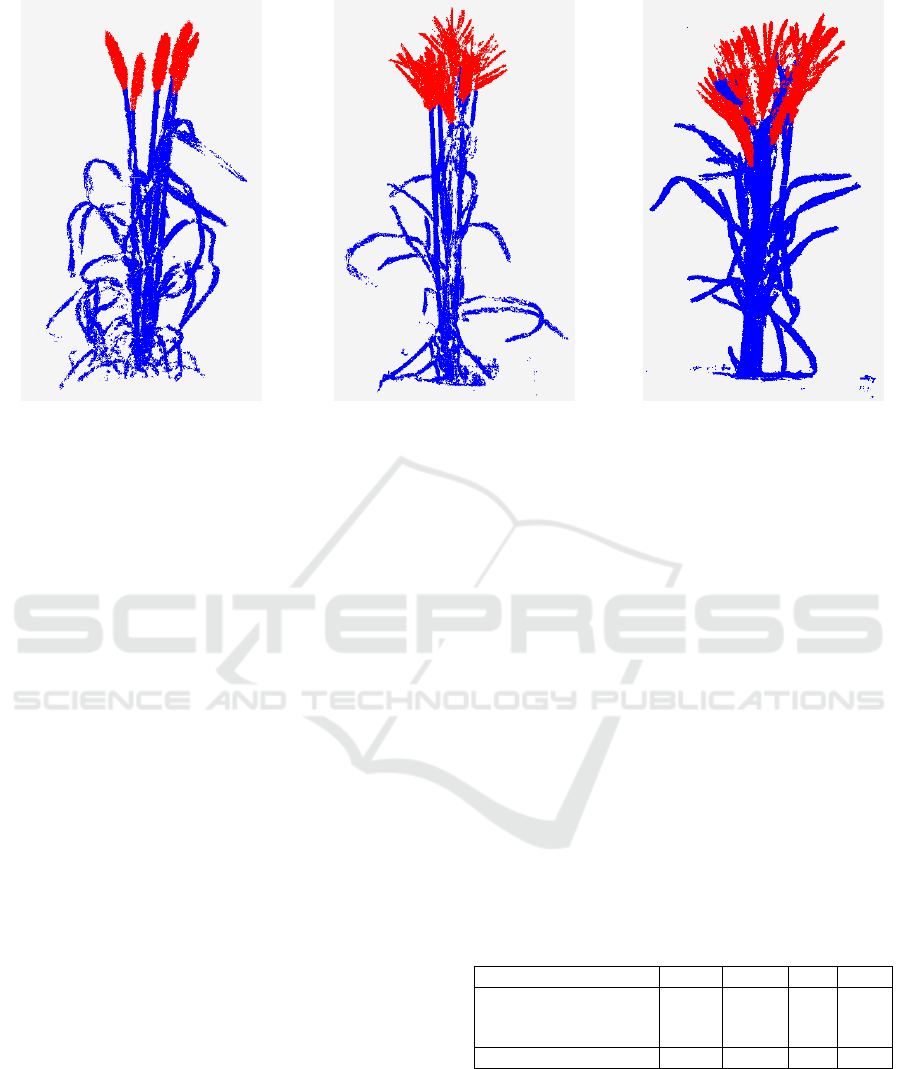
Paragon Gladius Apogee
Figure 1: Annotated 3D models of three wheat cultivars.
Authors have employed the concept of Bayesian un-
certainty that works better than other alternatives. The
findings indicate that incorporating uncertainty data
into decision-making processes can enhance diagnos-
tic accuracy. Another study has employed uncertainty
map to address the issue of unreliable segmentation
(Tang et al., 2022). To effectively extract meaningful
features and harness the potential of uncertainty, the
researchers introduced an uncertainty-guided module.
This module improves the model’s ability to discern
subtle features that are often overlooked in standard
segmentation approaches. In addition to autonomous
driving and medical imaging, research has also been
conducted in synthetic aperture radar (SAR) applica-
tions (Haas and Rabus, 2021). This study evaluates
uncertainty measurements to assess real-world quality
control performance. It utilizes softmax scores for un-
certainty estimation, which have been shown to offer
more practical insights compared to Bayesian meth-
ods.
3 METHODOLOGY
3.1 Dataset Description
The three wheat varieties—Paragon, Gladius, and
Apogee were grown in an ecologically controlled
Smarthouse at the National Plant Phenomics Cen-
tre (NPPC), Aberystwyth University, under experi-
ment reference W048. The plants were cultivated
on a conveyor system that was computer controlled,
and the soil water levels were changed to sustain
either a moderate drought or well-watered circum-
stances. Every plant was given a unique barcode that
was connected to all of the data it had gathered and
put on an RFID-tagged carriage. Over the course of
44 days, a 360-degree imaging strategy obtained 74
multi-view photos per plant every day. The 3D mod-
els were reconstructed using open source photogram-
metry software COLMAP (Sch
¨
onberger and Frahm,
2016; Sch
¨
onberger et al., 2016). After 3D reconstruc-
tion, the point cloud data was labelled using package
CloudCompare (Girardeau-Montaut, 2012). The seg-
ment function in the package was employed to divide
the plant into two parts and then the parts were anno-
tated using the Scalar function. Figure 1 depicts the
labelled point clouds. The red color is labelled with
’1’ that represents ear part (spikes) and the blue part
is labelled with ’0’ representing non-ear (leaves and
stems) part. We have downsampled each sample to
2048 points for the sake of computational feasibility.
Table 1: Dataset descriptions for different wheat categories.
Variety Total Train Val Test
Paragon 385 308 24 53
Gladius 371 296 25 50
Apogee 547 436 32 79
Wheat (All cultivars) 1303 1040 81 182
Despite the fact that they belong to the Wheat cat-
egory, the three cultivars show quite different charac-
teristics and architectures:
• Paragon: Mostly made up of leaves with a few tall
ears rising above them.
• Gladius: The species distinguished by having
more ears that are partly hidden beneath the fo-
VISAPP 2025 - 20th International Conference on Computer Vision Theory and Applications
634
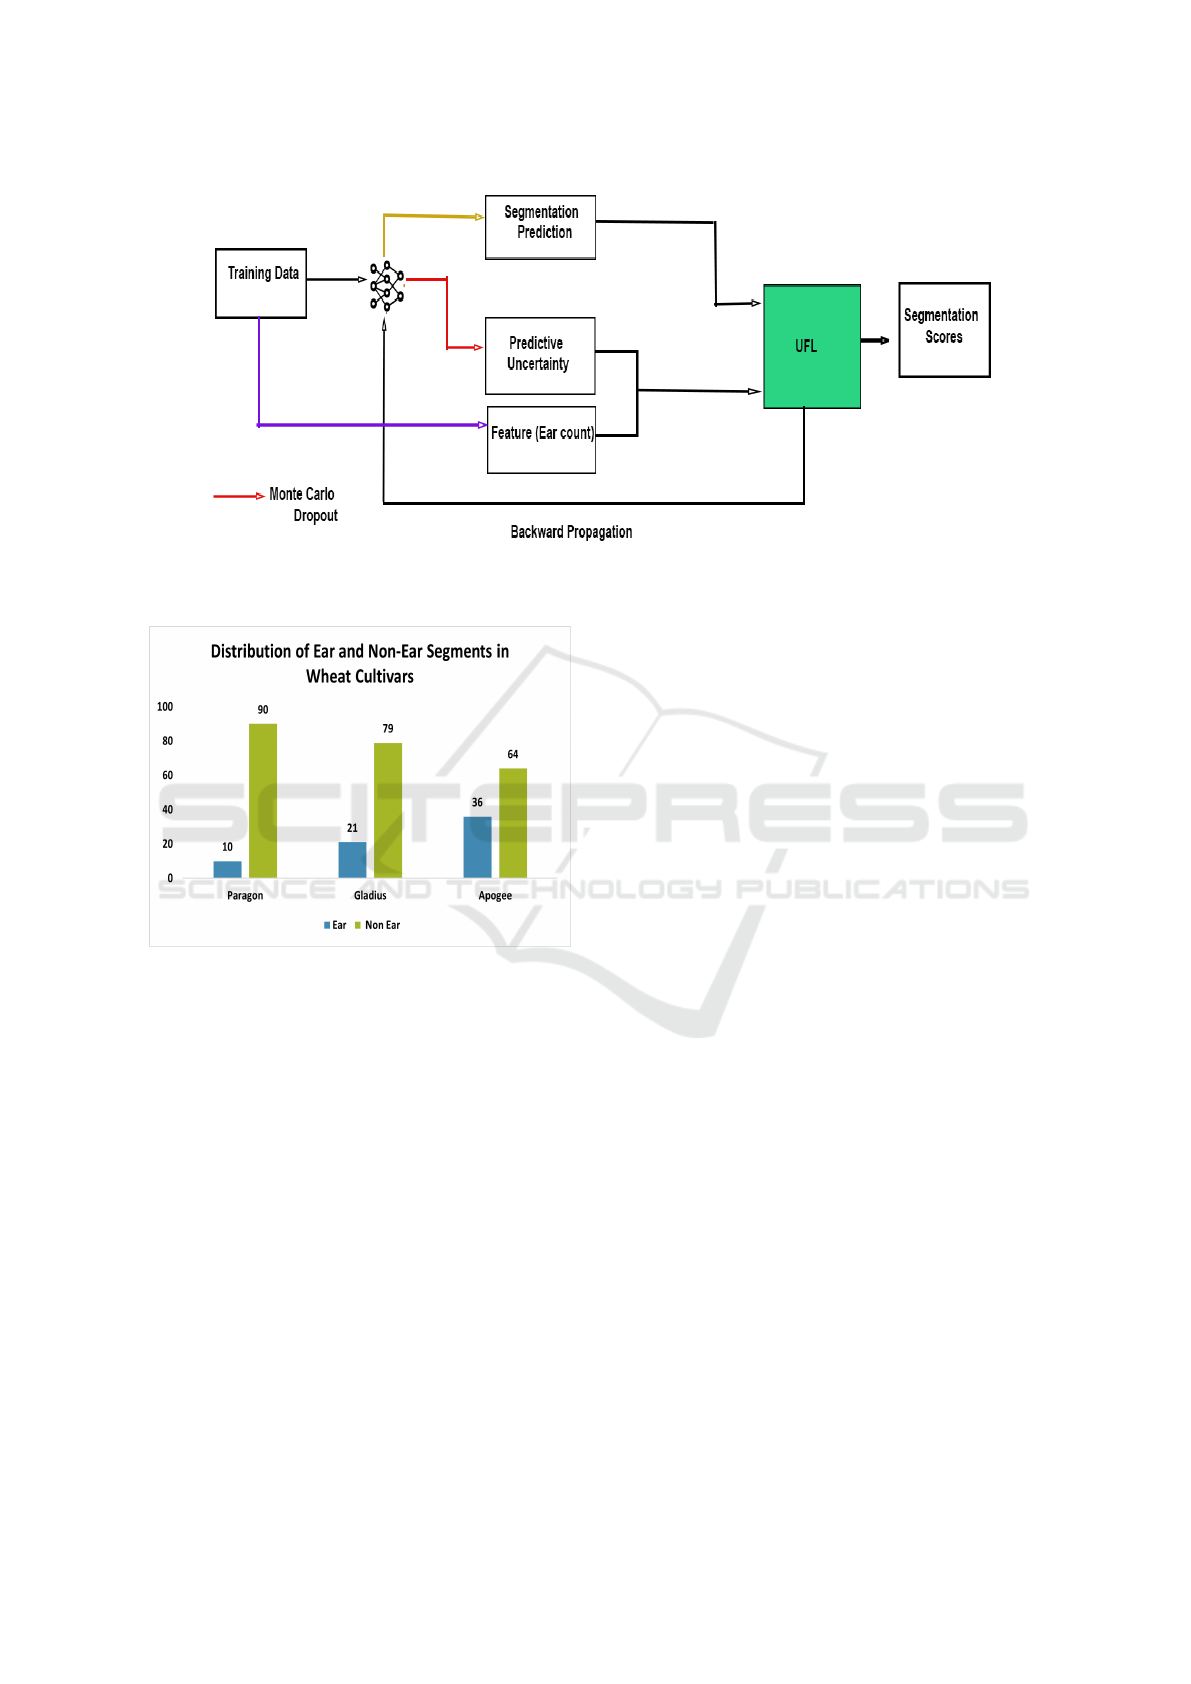
Figure 2: A schematic overview of the UFL training process, which incorporates predictive uncertainties from a Monte Carlo
Dropout (MC-Dropout) and Features of plant to improve segmentation performance.
Figure 3: Distribution of Ear and Non-Ear parts in three
wheat cultivars.
liage.
• Apogee: A super dwarf with a high ear-to-leaf ra-
tio that is known for its quick cycling.
Table 1 illustrates the wheat dataset with all train-
ing, validation, and test samples used in this research
study. Figure 3 illustrates the proportion of ear points
and non-ear points of each wheat variety. Paragon ex-
hibits a notably smaller proportion of ear points com-
pared to those of Gladius and Apogee. Gladius has a
reasonable number of ear points, while Apogee shows
a significantly larger proportion, highlighting the vari-
ability and imbalance in ear point distribution across
these varieties.
3.2 Proposed Approach
The core idea of our approach is to incorporate predic-
tive uncertainties and plant specific feature together
into the training process to enhance the accuracy of
part segmentation of crops or plants. The method in-
troduces an uncertainty and feature based loss func-
tion, which enhances the deep learning architecture’s
ability to prioritize learning from samples with high
uncertainty or significant features. The proposed ap-
proach allows the model to focus on more challenging
data, improving overall learning efficiency and model
robustness. This approach introduces two primary en-
hancements into the training process:
1. Hybrid Score Calculation: During training,
Monte Carlo Dropout is exploited that measures
the uncertainty (u
i
) in prediction of the samples.
A hybrid score is calculated that integrates fea-
ture (e
i
) i.e. ear count (wheat spikes) in our case.
This score ensures that samples with both high
uncertainty and significant feature attributes are
weighted appropriately.
2. Weighted Loss: We employ hybrid score as
weights in the loss function so that the model is
encouraged to focus on more uncertain and fea-
ture rich samples to facilitate effective learning.
Figure 2 represents the UFL computation process.
3.2.1 Architecture
We have adopted Gradient Attention module (GAM)
(Hu et al., 2023) with baseline PointNet++ for point
cloud analysis for our proposed technique. We inte-
grate the Gradient Attention Module (GAM), which
is designed to focus the network’s attention on cru-
cial features within the data, potentially improving
the accuracy and efficiency of segmentation. The
incorporation of GAM with PointNet++ aims to ex-
plore whether this attention mechanism can refine the
Uncertainty and Feature-Based Weighted Loss for 3D Wheat Part Segmentation
635

model’s output by providing more focused and rel-
evant feature analysis, especially for complex plant
structures. The network utilizes gradient informa-
tion in the neighborhood and converts that informa-
tion into explicit representation. It is the first to incor-
porate gradient data into the vector of locally aggre-
gated descriptors for point cloud neighborhood fea-
tures. The results show that the module has effec-
tively boost performance of the different state-of-the-
art methods.
3.2.2 Uncertainty and Feature Based Weighted
Loss
In contrast to the conventional utilization of Monte
Carlo Dropout, our proposed approach extends its ap-
plicability to the training phase. During each batch of
the training phase, we execute λ iterations to produce
λ segmentation samples in order to measure uncer-
tainties of the samples. The essential idea is that the
differences between the model’s successive predic-
tions reflect its confidence level, which is a measure of
epistemic uncertainty. The high variation in these pre-
dictions indicates a reduced confidence in the model’s
outputs, implying that the data poses challenges for
accurate identification by the model. This variability
acts as a direct signal of uncertainty, making it pos-
sible to identify samples with significant uncertainty.
Gradients are deactivated during this computational
phase to prevent them from affecting the backward
propagation process. The ultimate goal of UFL is to
enhance the standard categorical cross-entropy loss,
which is articulated as follows:
The modified uncertainty feature weighted loss
function can be expressed as:
L
UFL
= −
1
M
M
∑
i=1
w
i
K
∑
j=1
y
i, j
log(q
i, j
),
where:
• M is the total number of samples,
• K is the number of classes,
• w
i
represents the weight for the i-th sample,
• y
i, j
is the ground truth probability for the i-th sam-
ple and j-th class,
• q
i, j
is the predicted probability for the i-th sample
and j-th class.
Sample Wise Weight:
In our technique, the sample weight w
i
is influenced
by uncertainty scores and the plant features, notably
the ’ear’ count of wheat. The weight for each sample
is formulated as follows:
w
i
= α · e
i
+ β · u
i
,
where:
• α and β are parameters that modulate the contri-
butions of the ’ear’ feature importance (e
i
) and un-
certainty (u
i
) respectively.
• e
i
represents the ’ear’ feature importance for sam-
ple i
• u
i
denotes the uncertainty associated with sample
i, reflecting the confidence level of the measure-
ments or predictions.
e
i
and u
i
have quite disparity in the scale so we have
chosen min-max normalization to ensure that these in-
puts are comparable and can contribute appropriately
to the model’s decision making process. This step will
enhance the network’s ability to integrate these met-
rics effectively, leading to more accurate and reliable
segmentation predictions. α and β control the weights
of the loss function. We have presented experiments
to investigate the impact of these parameters on the
performance of deep learning neural network archi-
tecture in the next section.
3.3 Experiments
In this section, we undertake a comprehensive series
of experiments to validate the effectiveness of inte-
grating predictive uncertainties into the training pro-
cess.
3.3.1 Experimental Set up
Training: The network is trained for 150 epochs
with a batch size of 8 with 2048 points in each point
cloud. All the experiments are conducted utilizing
the PyTorch deep learning framework, leveraging the
computational power of an NVIDIA GPU with 12
GB VRAM. For all training procedures, we utilize a
Stochastic Gradient Descent (SGD) (Robbins, 1951)
optimizer configured with an initial base learning rate
of 0.001, a momentum of 0.9, and a weight decay
of 0.0001. The number of segmentation sample λ is
set to 5 by default. All experiments are evaluated on
Paragon, Gladius and Apogee i.e. Wheat varieties.
For quantitative evaluations, we primarily report the
mean Intersection over Union (mIoU), and Accuracy.
3.3.2 Quantitative Results
We have employed GAM module with PointNet++
(Qi et al., 2017) as baseline.
Table 2 shows a notable improvement in segmen-
tation accuracy and mean Intersection over Union
(mIoU) when we apply our Uncertainty and feature
VISAPP 2025 - 20th International Conference on Computer Vision Theory and Applications
636
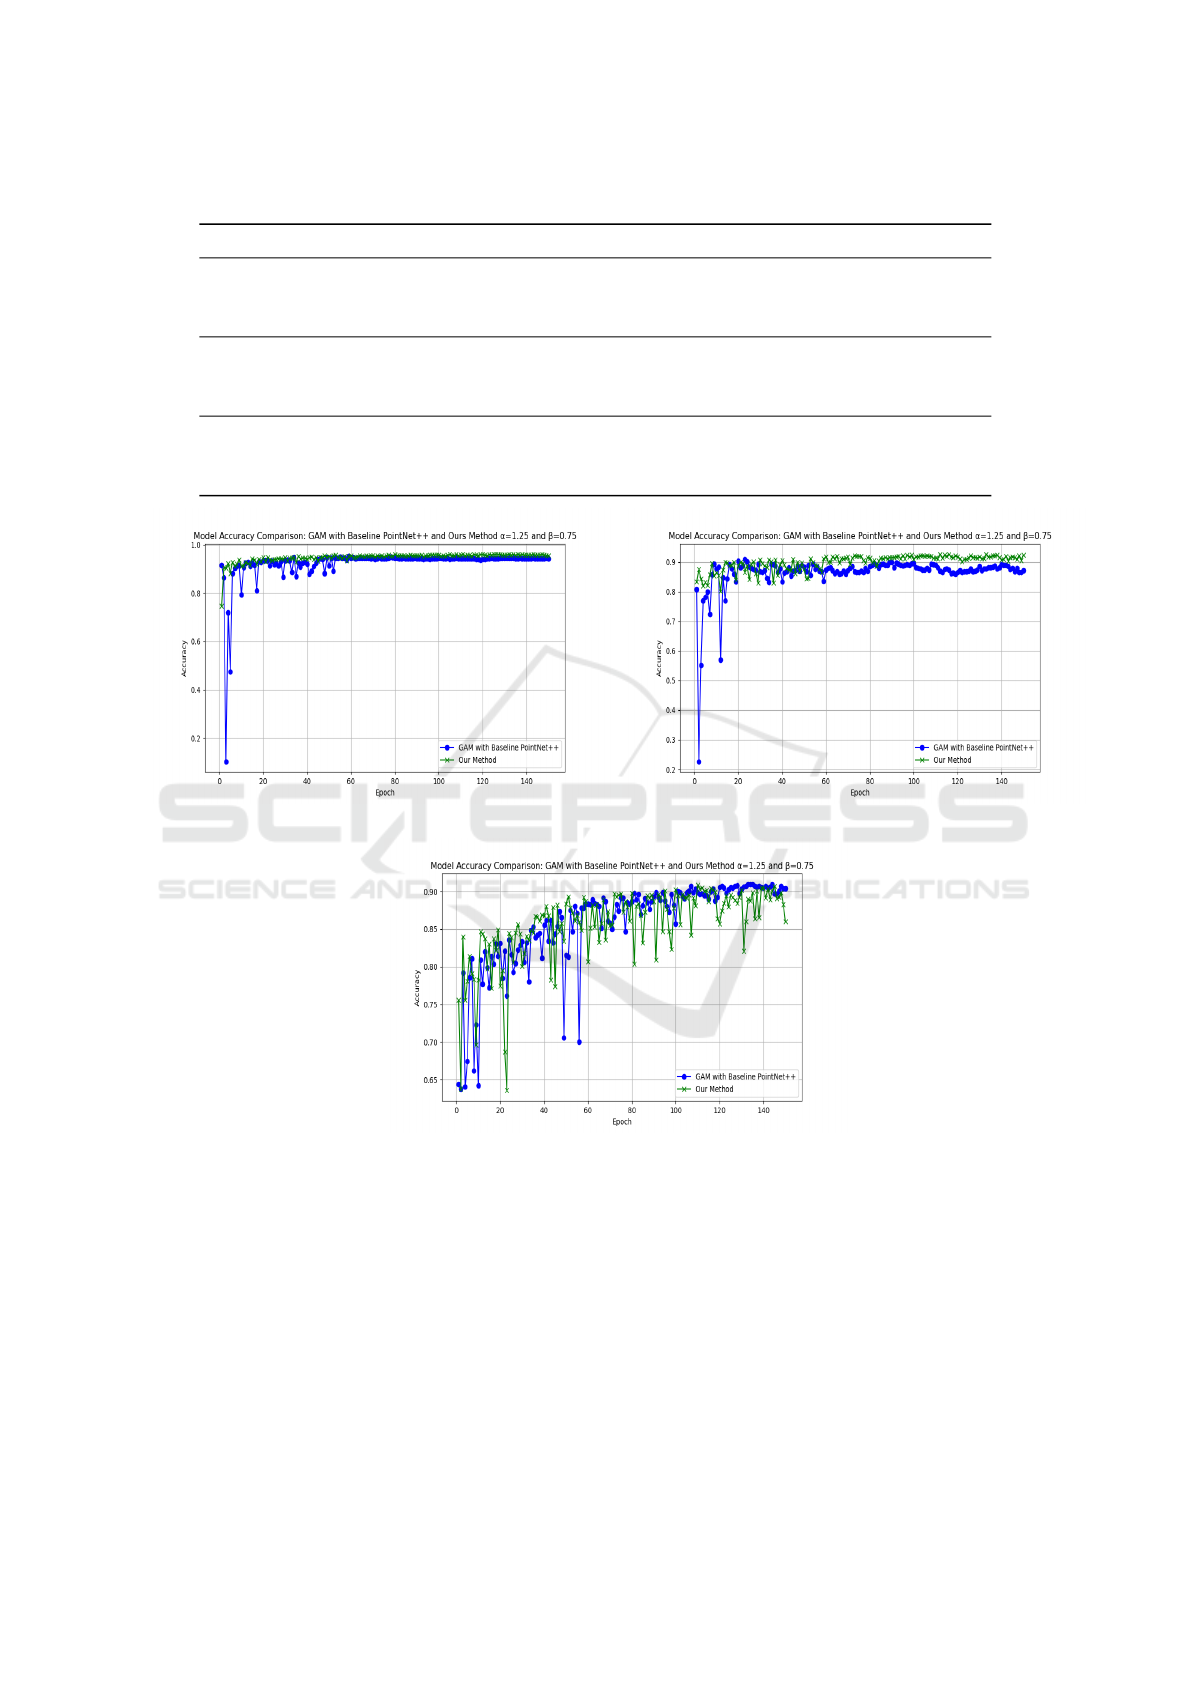
Table 2: Comparative Study of Segmentation Methods Across Three Datasets.
Dataset GAM (Baseline PointNet++) Accuracy mIoU Non-Ear mIoU Ear mIoU
Paragon
CE 0.917 0.650 0.907 0.392
UFL α = 1.25, β = 0.75 0.959 0.750 0.956 0.545
UFL α = 1.5, β = 1 0.951 0.685 0.942 0.422
Gladius
CE 0.892 0.712 0.870 0.554
UFL α = 1.25, β = 0.75 0.919 0.771 0.904 0.637
UFL α = 1.5, β = 1 0.898 0.741 0.880 0.603
Apogee
CE 0.908 0.818 0.869 0.768
UFL α = 1.25, β = 0.75 0.917 0.831 0.884 0.782
UFL α = 1.5, β = 1 0.915 0.830 0.879 0.783
(a) Paragon Dataset (b) Gladius Dataset
(c) Apogee Dataset
Figure 4: Model Accuracy Comparison: GAM with baseline PointNet++ vs. Our Method for three different datasets (Paragon,
Gladius, Apogee). Each graph shows the segmentation accuracy across the training epochs.
based loss (UFL) as compared to traditional Cross En-
tropy (CE) loss across all the datasets. Particularly α
= 1.25 and β = 0.75 consistently outperforms other
configurations, suggesting that optimal balance be-
tween uncertainty and feature values assist in model
learning. This configuration leads to substantial gains
in both Ear mIoU and Non-Ear mIoU, underlining
its effectiveness in differentiating between more and
less challenging segmentation areas. Paragon accu-
racy rose from 0.917 to 0.959 and mIoU witnessed a
jump of 10% in the figures. Gladius saw slight im-
provements in Accuracy but there is rise of 6% in
mIoU. Although Apogee is the one wheat variety that
is quite complex and the results refined from 0.908
accuracy to 0.917 but the Ear mIoU has a slight de-
cline as compared to the scenario when α = 1.5 and
β = 1, highlighting the trade-offs involved in optimiz-
ing these parameters. Figure 4 presents the training
Uncertainty and Feature-Based Weighted Loss for 3D Wheat Part Segmentation
637
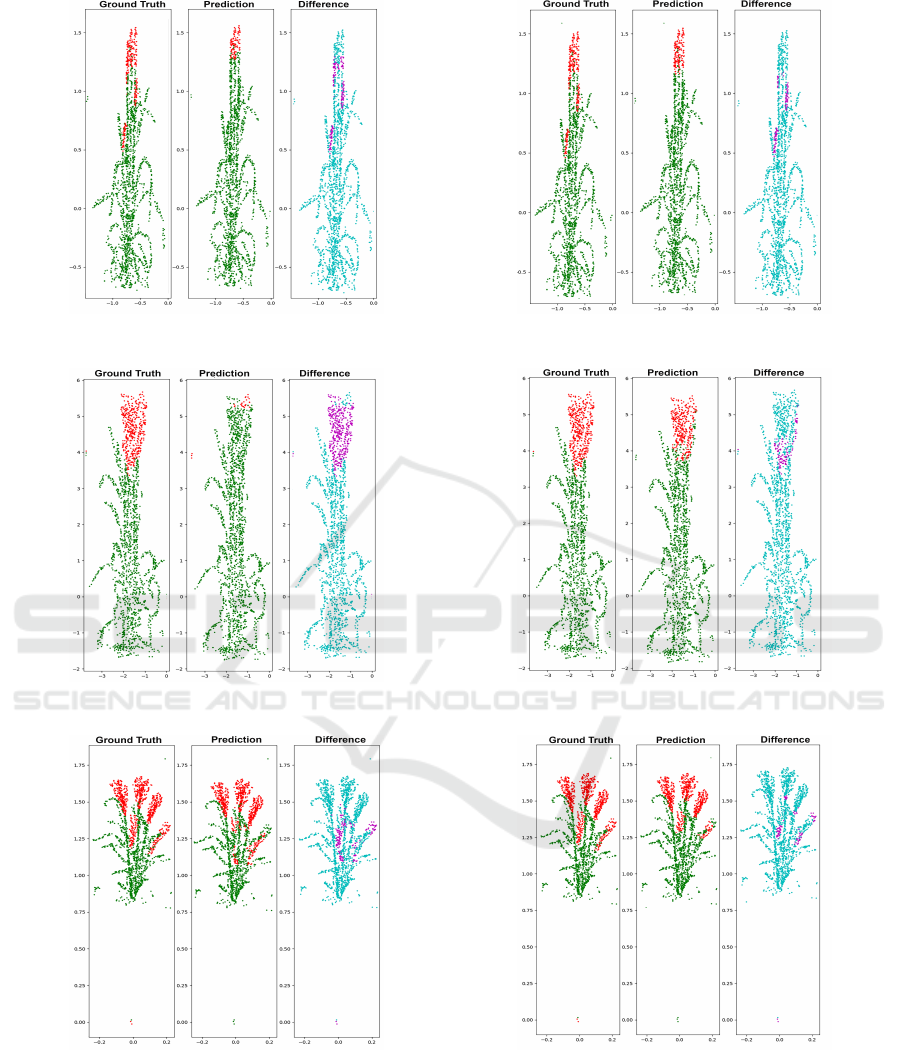
(a) Paragon (Base Method) (b) Paragon (Ours Method , α = 1.25, β = 0.75)
(c) Gladius (Base Method) (d) Gladius (Ours Method, α = 1.25, β = 0.75)
(e) Apogee (Base Method) (f) Apogee (Ours Method, α = 1.25, β = 0.75)
Figure 5: Comparison of segmentation results on the Paragon, Gladius, and Apogee datasets. Each dataset shows a baseline
and our method view to illustrate the effectiveness of the proposed strategy. In the visual representations, the ear part is
marked in red, while the non-ear part is depicted in green for both the Ground Truth and Prediction columns. Correct
predictions are highlighted in cyan, whereas magenta is used to indicate misclassifications. This color-coded approach helps
to clearly delineate the improvements our method brings in accurately segmenting the ear and non-ear components across
different wheat varieties.
VISAPP 2025 - 20th International Conference on Computer Vision Theory and Applications
638

Table 3: Segmentation Methods Across Three Datasets with GTNet.
Dataset GTNet Accuracy mIoU Non-Ear mIoU Ear mIoU
Paragon
CE 0.927 0.662 0.923 0.400
UFL α = 1.5, β = 1 0.932 0.676 0.929 0.425
UFL α = 1.25, β = 0.75 0.931 0.658 0.929 0.388
Gladius
CE 0.886 0.667 0.873 0.460
UFL α = 1.5, β = 1 0.881 0.721 0.854 0.588
UFL α = 1.25, β = 0.75 0.862 0.660 0.839 0.481
Apogee
CE 0.811 0.668 0.751 0.584
UFL α = 1.5, β = 1 0.817 0.688 0.742 0.633
UFL α = 1.25, β = 0.75 0.819 0.686 0.748 0.628
accuracy of our method with each variety. The fig-
ures demonstrate that our proposed approach yields
a marked improvement in accuracy over the baseline
method. This enhancement is evident across vari-
ous metrics and scenarios, highlighting the effective-
ness of integrating feature importance and uncertainty
quantification into the segmentation process.
Furthermore, an increase in values of α =1.5 and
β = 1 leads to decline in certain performance met-
rics as compared to previous discussed parameter set-
tings but the overall results consistently surpass those
achieved using the traditional Cross-Entropy (CE)
loss. This trend is particularly evident across multiple
datasets, where even with higher parameter values,
the UFL method demonstrates superior capability in
handling complex segmentation tasks. This suggests
that careful tuning of these parameters can lead to op-
timized model performance enabling more accurate
segmentation.
3.3.3 Qualitative Results
Figure 5 presents qualitative results of baseline and
our proposed approach. We have chosen the best re-
sults of our technique. It is clear from the results for
Paragon and Gladius that the number of misclassifi-
cations has decreased. Although it is more challeng-
ing to assess the impact for Apogee due to its com-
plex wheat variety, quantitative data indicate substan-
tial improvements for Apogee as well.
3.3.4 Comparative Study with GTNet
To further demonstrate its potential, we carry out a
comparative study between our proposed technique
with our deep learning network architecture with GT-
Net (Zhou et al., 2024), which is another network ar-
chitecture that integrates the Transformer and Graphs
based approaches. It features a Local Transformer,
which utilizes intra-domain cross-attention, and a
Global Transformer that employs global self-attention
to extract local and global features efficiently. We
have opted this model due to its strength in segmen-
tation tasks. Table 3 illustrates the impact of our loss
function as compared to the basic CE loss function.
Performance in Paragon has improved with α =1.5
and β = 1 with the average mIoU experiencing a slight
increase from 0.662 to 0.667 but the Ear mIoU saw
a slight dip. Similarly, Gladius has shown enhanced
performance under the same settings, with its mIoU
rising from 0.667 to 0.721. Apogee also displays a
similar trend in performance, with its mIoU improv-
ing from 0.668 to 0.688 as compared to the baseline
loss function. However the segmentation accuracy in
each variety has a slight improvement. For instance,
Paragon accuracy have a rise from 0.927 to 0.932 but
this is not the same with Gladius which has seen a
certain drop in this metric. Apogee is one variety that
has seen enhancement in the results of segmentation
accuracy from 0.811 to 0.817. We have observed that
while both parameter settings are effective, they do
not achieve results as impressive as those obtained
with GAM under similar conditions.
3.4 Ablation Studies
In addition to the quantitative and qualitative results
above, we also perform multiple ablation studies be-
low.
Impact of α and β : The α controls uncertainty
scores and β have an impact on feature i.e. ear count
in our case. In this section we have evaluated the im-
pact of α and β with varied values to explore their im-
pact on the model’s performance. These parameters
are crucial to understand the sensitivity of our deep
learning architecture to these adjustments. Interest-
ingly, some parameter settings may lead to decrease in
performance. Table 4 presents the performance of the
architecture with our proposed technique. α =1 and β
=1 consistently outperformed the CE baseline across
all datasets. But with another setting ( α =1.4 and β
Uncertainty and Feature-Based Weighted Loss for 3D Wheat Part Segmentation
639

Table 4: Ablation studies of Segmentation Methods Across Three Datasets.
Dataset GAM (Baseline PointNet++ Accuracy mIoU Non-Ear mIoU Ear mIoU
Paragon
CE 0.917 0.650 0.907 0.392
UFL α = 1, β = 1 0.954 0.714 0.951 0.477
UFL α = 1.4, β = 0.9 0.949 0.699 0.946 0.453
Gladius
CE 0.892 0.712 0.870 0.554
UFL α = 1, β = 1 0.911 0.764 0.895 0.634
UFL α = 1.4, β = 0.9 0.888 0.706 0.873 0.539
Apogee
CE 0.908 0.818 0.869 0.768
UFL α = 1, β = 1 0.910 0.830 0.883 0.776
UFL α = 1.4, β = 0.9 0.910 0.818 0.876 0.761
= 0.9) of optimized parameters the performances face
a slight decrease especially in case of Apogee. These
findings highlight a critical balance in the parameter
settings within our UFL framework.
Increasing each parameter beyond threshold can
impact model’s performance. So an optimal parame-
ter setting is pivotal that provides substantial improve-
ments over baseline without compromising model’s
robustness. In this ablation a small change in param-
eters have an influence on segmentation accuracy and
mIoU. To exemplify this, when α has an increase of
0.4 and β has very small change of 0.1 the perfor-
mance of the model decreases in each wheat variety.
Paragon saw a decline of 5% in segmentation accu-
racy and a similar trend is followed in Gladius where
accuracy dropped from 0.892 to 0.888. Though all
varieties have surpassed the baseline values but there
is small fall in the Ear mIoU of Apogee from 0.768 to
0.761 in comparison to the baseline CE loss.
4 DISCUSSION
In this research study, we have observed noteworthy
enhancements in segmentation accuracy and mIoU
following specific adjustments to parameters α and
β across different wheat cultivars datasets. These
improvements strengthen our hypothesis that uncer-
tainty and feature based loss with fine tuning of α
and β can enhance model performance, illustrating
a complex interplay between model robustness and
data specificity. Particularly, the difference in mag-
nitude of performance across datasets underscores
the influence of dataset-specific characteristics on
model efficacy, challenging the viability of a uniform
parameter-tuning approach across different scenarios.
Limitations: The suggested approach might not be
as effective for different crops that exhibit varying
structures and densities. Furthermore, there is a
risk that elevated values of α and β could lead to
overfitting, compromising the model’s generalization
across diverse agricultural scenarios. The general-
izabiltity of this approach needs to be yet explored
with different plant and crop species. Moreover, we
rely only on ear count as sole feature in this study.
We can consider different features i.e. ear ratio,
ear height, ear weight so they can also contribute to
better learning.
5 CONCLUSIONS
In conclusion, our study has demonstrated that un-
certainty and features scores are contributing with the
fine tuning of parameters α and β in our UFL frame-
work that show notable performance enhancement of
segmentation tasks with different wheat varieties. We
have discerned marked improvements in segmenta-
tion accuracy and mIoU, which underscores the po-
tential of our proposed technique. The results exhibit
that a uniform parameter setting might be less effec-
tive across diverse crop species and the parameters
tuning needs to be adjusted on specific data character-
istics can lead to substantial improvements. This not
only highlights the adaptability of our model but also
points to the importance of dataset-specific strategies
in agricultural applications. With the precise consid-
eration of α and β the risk of overfitting can also be
mitigated. This paves the way for more robust, ac-
curate, and efficient models that can be pivotal in ad-
vancing precision agriculture.
REFERENCES
Armeni, I., Sener, O., Zamir, A. R., Jiang, H., Brilakis, I.,
Fischer, M., and Savarese, S. (2016). 3d semantic
parsing of large-scale indoor spaces. In 2016 IEEE
VISAPP 2025 - 20th International Conference on Computer Vision Theory and Applications
640

Conference on Computer Vision and Pattern Recogni-
tion (CVPR), pages 1534–1543.
Bian, C., Yuan, C., Wang, J., Li, M., Yang, X., and and,
S. Y. (2020). Uncertainty-aware domain alignment
for anatomical structure segmentation. Medical Im-
age Analysis, 64:101732.
Bischke, B., Helber, P., Borth, D., and Dengel, A. (2018).
Segmentation of imbalanced classes in satellite im-
agery using adaptive uncertainty weighted class loss.
In IGARSS 2018 - 2018 IEEE International Geo-
science and Remote Sensing Symposium, pages 6191–
6194.
Blundell, C., Cornebise, J., Kavukcuoglu, K., and Wierstra,
D. (2015). Weight uncertainty in neural networks.
Chang, A. X., Funkhouser, T., Guibas, L., Hanrahan, P.,
Huang, Q., Li, Z., Savarese, S., Savva, M., Song, S.,
Su, H., Xiao, J., Yi, L., and Yu, F. (2015). Shapenet:
An information-rich 3d model repository.
Chaudhury, A., Boudon, F., and Godin, C. (2020). 3d plant
phenotyping: All you need is labelled point cloud
data. In Workshop on Computer Vision Problems in
Plant Phenotyping, pages 244–260.
Gal, Y. and Ghahramani, Z. (2016). Dropout as a bayesian
approximation: Representing model uncertainty in
deep learning.
Ghahremani, M., Williams, K., Corke, F. M. K., Tiddeman,
B., Liu, Y., and Doonan, J. H. (2021). Deep segmen-
tation of point clouds of wheat. Frontiers in Plant
Science, 12.
Girardeau-Montaut, D. (2012). CloudCompare - Open
Source project — cloudcompare.org. https://www.
cloudcompare.org/. [Accessed 17-11-2023].
Haas, J. and Rabus, B. (2021). Uncertainty estimation
for deep learning-based segmentation of roads in syn-
thetic aperture radar imagery. Remote Sensing, 13(8).
Hu, H., Wang, F., Su, J., Zhou, H., Wang, Y., Hu, L., Zhang,
Y., and Zhang, Z. (2023). Gam : Gradient attention
module of optimization for point clouds analysis. In
AAAI Conference on Artificial Intelligence.
Kong, L., Kamarthi, H., Chen, P., Prakash, B. A., and
Zhang, C. (2023). Uncertainty quantification in deep
learning. In Proceedings of the 29th ACM SIGKDD
Conference on Knowledge Discovery and Data Min-
ing, KDD ’23, page 5809–5810, New York, NY, USA.
Association for Computing Machinery.
Landgraf, S., Wursthorn, K., Hillemann, M., and Ulrich,
M. (2024). Dudes: Deep uncertainty distillation using
ensembles for semantic segmentation. PFG – Journal
of Photogrammetry, Remote Sensing and Geoinforma-
tion Science, 92(2):101–114.
Leibig, C., Allken, V., Ayhan, M. S., Berens, P., and Wahl,
S. (2016). Leveraging uncertainty information from
deep neural networks for disease detection. Scientific
Reports, 7.
Li, D., Shi, G., Li, J., Chen, Y., Zhang, S., Xiang, S., and
Jin, S. (2022). Plantnet: A dual-function point cloud
segmentation network for multiple plant species. IS-
PRS Journal of Photogrammetry and Remote Sensing,
184:243–263.
Lin, Q., Chen, X., Chen, C., Pekaslan, D., and Garibaldi,
J. M. (2023). Fuzzy uncertainty-based out-of-
distribution detection algorithm for semantic segmen-
tation. In 2023 IEEE International Conference on
Fuzzy Systems (FUZZ), pages 1–6.
Minervini, M., Scharr, H., and Tsaftaris, S. (2015). Im-
age analysis: The new bottleneck in plant phenotyping
[applications corner]. IEEE Signal Processing Maga-
zine, 32:126–131.
Mochida, K., Koda, S., Inoue, K., Hirayama, T., Tanaka, S.,
Nishii, R., and Melgani, F. (2018). Computer vision-
based phenotyping for improvement of plant produc-
tivity: a machine learning perspective. GigaScience,
8(1):giy153.
Mukhoti, J., Kirsch, A., van Amersfoort, J. R., Torr, P. H. S.,
and Gal, Y. (2021). Deep deterministic uncertainty:
A new simple baseline. 2023 IEEE/CVF Conference
on Computer Vision and Pattern Recognition (CVPR),
pages 24384–24394.
Qi, C., Yi, L., Su, H., and Guibas, L. J. (2017). Pointnet++:
Deep hierarchical feature learning on point sets in a
metric space. In NIPS, page 5105–5114.
Qi, C. R., Su, H., Mo, K., and Guibas, L. J. (2016). Pointnet:
Deep learning on point sets for 3d classification and
segmentation. arXiv preprint arXiv:1612.00593.
Robbins, H. E. (1951). A stochastic approximation method.
Annals of Mathematical Statistics, 22:400–407.
Sch
¨
onberger, J. and Frahm, J.-M. (2016). Structure-from-
motion revisited.
Sch
¨
onberger, J., Zheng, E., Pollefeys, M., and Frahm, J.-
M. (2016). Pixelwise view selection for unstructured
multi-view stereo. volume 9907.
Shen, J., Wu, T., Zhao, J., Wu, Z., Huang, Y., Gao, P., and
Zhang, L. (2024). Organ segmentation and phenotypic
trait extraction of cotton seedling point clouds based
on a 3d lightweight network. Agronomy, 14(5).
Sirohi, K., Marvi, S., B
¨
uscher, D., and Burgard, W. (2022).
Uncertainty-aware panoptic segmentation.
Sun, Y., Lu, B., Liu, Y., Yang, Z., Behera, A., Song, R.,
Yuan, H., and Jiang, H. (2024). Exploiting label un-
certainty for enhanced 3d object detection from point
clouds. IEEE Transactions on Intelligent Transporta-
tion Systems, 25(6):6074–6089.
Tang, P., Yang, P., Nie, D., Wu, X., Zhou, J., and Wang,
Y. (2022). Unified medical image segmentation by
learning from uncertainty in an end-to-end manner.
Knowledge-Based Systems, 241:108215.
Turgut, K., Dutagaci, H., and Rousseau, D. (2022). Ros-
esegnet: An attention-based deep learning architec-
ture for organ segmentation of plants. Biosystems En-
gineering, 221:138–153.
Wang, J., Ancha, S., Chen, Y.-T., and Held, D. (2020).
Uncertainty-aware self-supervised 3d data associa-
tion. In 2020 IEEE/RSJ International Conference on
Intelligent Robots and Systems (IROS), pages 8125–
8132.
Zhou, W., Wang, Q., Jin, W., Shi, X., and He, Y. (2024).
Graph transformer for 3d point clouds classification
and semantic segmentation. Computers & Graphics,
124:104050.
Uncertainty and Feature-Based Weighted Loss for 3D Wheat Part Segmentation
641
