
Assessing Electrocardiogram Quality: A Deep Learning Framework For
Noise Detection And Classification
M
´
arcia Monteiro, Mariana Dias
a
and Hugo Gamboa
b
LIBPhys (Laboratory for Instrumentation, Biomedical Engineering and Radiation Physics),
NOVA School of Science and Technology, Campus de Caparica, 2829-516, Portugal
{mia.monteiro, mag.dias}@campus.fct.unl.pt, hgamboa@fct.unl.pt
Keywords:
Electrocardiogram, Signal Quality Assessment, Deep Learning, Noise, Classification, Gated Recurrent Units,
Wearables.
Abstract:
The electrocardiogram (ECG) is an essential tool in the diagnosis of cardiovascular conditions. A common
obstacle to readability and reliability is the vulnerability of ECG signals to noise, especially in wearable
devices and long-term monitoring. Traditional methods have limited accuracy in noise detection, and, while
deep learning (DL) shows promise, current models primarily focus on binary classification, lacking detailed
quality analysis. This study proposes a DL model that assesses ECG signal quality, detecting and classifying
specific noise types, with random-length noise segments added to clean 10-second signals to simulate real-
world scenarios. The model, using gated recurrent units (GRUs), identifies three common noise types: baseline
wander (BW), muscle artifacts (MA), and electrode motion (EM), achieving 98.09 % accuracy for BW, 92.62
% for MA, and 90.71 % for EM with F1 scores of 88.89 % for BW, 82.19 % for EM and 64.62 % for MA. It
also surpasses existing DL methods, reaching 99.86 % accuracy for binary classification, with high recall and
precision.
1 INTRODUCTION
Cardiovascular diseases are the leading cause of mor-
tality globally, claiming around 17.9 million lives
each year (World Health Organization, 2024). This
statistic underscores the critical need for effective
diagnostic tools, with the electrocardiogram (ECG)
serving as a key tool by providing real-time monitor-
ing of heart activity. However, ECG signals are highly
susceptible to noise, which can degrade recording
quality and limit usability, even in controlled environ-
ments (Kher, 2019). Noise can still arise in clinical
settings such as 12-lead resting or stress tests, fre-
quently requiring repeated exams.
In long-term monitoring, the impact of noise is
even more pronounced. Diagnosing arrhythmias,
characterized by sporadic, irregular episodes, often
requires extended observation periods (Carrington
et al., 2022). Devices such as Holter monitors (Amer-
ican Heart Association, 2024) facilitate home moni-
toring, although users are cautioned to avoid strenu-
ous activities or water exposure, as such conditions
may interfere with device performance and reduce
a
https://orcid.org/0000-0002-0172-4559
b
https://orcid.org/0000-0002-4022-7424
data reliability. In sports settings, wearable ECG
patches (Liu et al., 2018) enable real-time monitor-
ing for performance tracking and cardiovascular risk
reduction (Pingitore et al., 2023). Wearables also sup-
port occupational health by allowing worker monitor-
ing to optimize schedules and tasks for safer work
environments (Baldassarre et al., 2020), while self-
monitoring (Dahiya et al., 2024) grows as a valuable
tool for personal health. However, this flexibility in-
creases noise levels, distorting the accuracy and con-
sistency of the signals.
Enhanced noise identification systems are, there-
fore, critical for effective signal quality assessment
(SQA). Traditional methods rely on global thresholds,
limiting their accuracy (Rahman et al., 2022), (Zhao
and Zhang, 2018). Although rule-based approaches
address some variability, they still depend on fixed
values, reducing generalization. Deep learning (DL)
approaches offer improvements by learning relevant
ECG features to achieve high accuracy in distinguish-
ing clean (physiological signal) from noisy (artifact
filled signals). However, many DL methods are lim-
ited to binary classification (van der Bijl et al., 2022),
which may be insufficient for localized noise or cases
requiring noise-specific filtering.
The need for robust ECG noise assessment moti-
Monteiro, M., Dias, M. and Gamboa, H.
Assessing Electrocardiogram Quality: A Deep Learning Framework For Noise Detection And Classification.
DOI: 10.5220/0013313800003911
Paper published under CC license (CC BY-NC-ND 4.0)
In Proceedings of the 18th International Joint Conference on Biomedical Engineering Systems and Technologies (BIOSTEC 2025) - Volume 1, pages 793-804
ISBN: 978-989-758-731-3; ISSN: 2184-4305
Proceedings Copyright © 2025 by SCITEPRESS – Science and Technology Publications, Lda.
793

vates this research. This paper presents a DL clas-
sifier capable of detecting noisy ECG segments and
identifying specific noise types, going beyond binary
classification. It has significant potential for various
applications, particularly in self-monitoring and long-
term ECG monitoring. By identifying and classifying
different types of noise, the model enhances the ro-
bustness of monitoring systems in clinical or research
contexts, by allowing the selection of appropriate de-
noising methods based on the specific type of noise
present. Additionally, through the identification of the
noise sources, the model allows users to avoid these
types of noise by taking proactive measures, such as
choosing the right environment or adjusting equip-
ment settings, ultimately improving signal quality.
2 LITERATURE REVIEW
Traditional methods for assessing ECG signal quality
employ a variety of techniques aimed at evaluating
noise levels in ECG recordings, each with its focus
on distinct signal characteristics. These approaches
fall into several fundamental categories: statistical,
feature-based, frequency-based, and morphology-
based. Statistical methods rely on specific metrics
to determine if a signal’s distribution aligns with
noise-free characteristics. For instance, Sungho Oh’s
method (Oh, 2004) utilizes variance, zero-crossing
rates, and turn counts, where higher values in these
metrics indicate potential noise presence. Other key
metrics include kurtosis and skewness (Rio et al.,
2011), (Zhao and Zhang, 2018), which detect distri-
bution anomalies like sharpness or asymmetry. How-
ever, these approaches depend on threshold values
that may vary across different settings, limiting their
flexibility.
Zhao’s 2018 rule-based classification method
(Zhao and Zhang, 2018) combines traditional feature
extraction with fuzzy logic to evaluate ECG quality
by deriving signal quality indices (SQIs) from fea-
tures like R peak detection, power spectral distribu-
tion, and R-R interval variability, integrating them
through heuristic fusion. Fuzzy logic provides a nu-
anced assessment by assigning varying degrees to cat-
egories like ‘excellent’, ‘acceptable’, or ‘poor’. How-
ever, this method’s dependence on subjective heuris-
tics and parameter tuning may limit its adaptability,
increasing misclassification risks in complex cases.
Feature-based methods evaluate specific ECG
characteristics, such as the adaptive threshold QRS
detection method by Chiarugi et al. (Chiarugi et al.,
2007), which calculates a noise index based on base-
line levels and QRS variability. Although effective, it
faces challenges in accurately estimating the baseline
and QRS variability. Similarly, Sungho Oh’s use of
PCA (Oh, 2004) reduces dimensionality by isolating
significant features like heartbeats from noise, but its
effectiveness depends on selecting the right compo-
nents for accurate noise separation.
Frequency-based approaches analyze characteris-
tic ECG frequency bands, as seen in Liping Li’s work
(Li, 2016), which focuses on the power spectrum
within 0.05 to 30 Hz (for ECG features) compared
to the 30 to 60 Hz range (associated with noise). This
method provides a quantitative noise measure but is
mainly effective for specific noise types like power-
line interference and EM noise and relies on static
thresholds.
Morphology-based approaches, such as Wang’s
method (Wang, 2002), assess ECG quality by ex-
amining discrepancies between successive QRS com-
plexes, recording mismatches in a histogram. This
technique, though effective, depends on accurate QRS
detection, which may be impaired by noise, and as-
sumes a standard QRS morphology, potentially over-
looking pathological variations. Another example
is Iravanian’s approach (Iravanian and Tung, 2002),
which isolates noise by averaging the ECG signal and
subtracting it from the original signal, assuming the
average is a clean signal. Rio et al. (Rio et al.,
2011) further enhance this by creating a template us-
ing LMS adaptive filtering, but this too depends on a
high-quality template for accuracy.
Deep learning (DL) methods for ECG signal qual-
ity assessment (SQA) have advanced significantly,
providing more sophisticated techniques for evaluat-
ing signal quality. Unlike traditional methods that
rely on handcrafted features and predefined rules, DL
models can learn high-level features directly from
ECG signals, enabling adaptive and scalable solu-
tions. These advancements are evident in various ar-
chitectures, datasets, and performance metrics.
Zhou et al. presented an early example of a 1D
CNN model (Zhou et al., 2018) trained on the Phy-
sioNet/CinC 2011 and 2017 datasets (Silva et al.,
2011), (Clifford et al., 2017), (Goldberger et al.,
2000), achieving 94.30 % accuracy by classifying
single-lead ECG signals as either acceptable or un-
acceptable. This architecture, with two convolutional
layers followed by a fully connected layer, demon-
strated that even simple CNNs can outperform tradi-
tional methods.
Expanding on Zhou’s work, Huerta et al. (Huerta
et al., 2019), (Huerta et al., 2020) employed scalo-
grams and transfer learning with advanced image
classification models to handle noisy signals, test-
ing AlexNet, VGG16, and GoogLeNet. AlexNet
BIOSIGNALS 2025 - 18th International Conference on Bio-inspired Systems and Signal Processing
794

achieved the highest accuracy at 91.20 %, followed
by GoogLeNet at 90.75 % and VGG16 at 89.65
%, showcasing CNNs’ effectiveness in frequency-
domain noise detection.
Mondal (Mondal et al., 2022) further explored
CNN-based models for binary classification of ECG
quality using synthetically added noise. This architec-
ture, consisting of three 1D CNN layers, pooling lay-
ers, and a dense layer, used the first-order derivative
of the ECG to emphasize high-frequency noise com-
ponents. The model achieved 91.77 % accuracy on
the PhysioNet Challenge 2017 dataset (Clifford et al.,
2017), (Goldberger et al., 2000).
Liu et al. (Liu et al., 2021) introduced a dual-input
approach, where one input was a scalogram, and the
other comprised handcrafted statistical features like
baseline drift and R-peak count. The CNN, with three
convolutional layers, fused CNN-extracted features
with handcrafted ones, effectively distinguishing be-
tween acceptable and unacceptable signals. However,
the reliance on scalograms limits this model’s appli-
cability to raw ECG signals, where time-series archi-
tectures like LSTM models may be more appropriate.
J. Zhang et al. (Zhang et al., 2018) addressed
temporal dependencies in ECG signals using LSTM
structures. Developing one of the largest datasets in
this field, they achieved 93.50 % accuracy by merging
LSTM-extracted features with domain-specific fea-
tures, such as spectral distribution and waveform vari-
ation. Without these domain-specific features, preci-
sion dropped to 91.10 %, underscoring the dual-input
method’s utility.
DL approaches are often data-dependent, and the
limited size of public ECG databases can lead to mis-
leading performance outcomes, prompting a need for
data augmentation. Zhou et al. (Zhou et al., 2021)
tackled this by introducing a CGAN for both data
augmentation and quality assessment. The CGAN’s
generator, consisting of two LSTM layers, and the
discriminator, composed of two CNN layers, gener-
ated artificial ECG segments to balance datasets and
improve training. The CGAN-based system achieved
accuracies of 97.10 % and 96.40 % on two datasets,
underscoring data augmentation’s role in enhancing
model performance.
More recent innovations include attention mecha-
nisms. Jin et al. (Jin et al., 2023) introduced the DAC-
LSTM model, which combined CNNs and bidirec-
tional LSTMs with attention to enhance feature selec-
tion from 12-lead ECGs. This approach used CNNs
and LSTMs to extract features, followed by a time-
based attention mechanism to select important seg-
ments, concluding with a softmax classifier. Achiev-
ing 94.00 % accuracy, this model is applicable in real-
world clinical settings, like triage. Similarly, Zhong et
al. (Zhong et al., 2023) incorporated attention through
Squeeze-and-Excitation modules within a DenseNet,
achieving 96.02 % accuracy. Although these mod-
els improve feature selection and classification per-
formance, they still lack the capacity to detail specific
noise sources.
Chen et al. (Chen et al., 2023) proposed Swin-
DAE, a model combining a denoising autoencoder
with a 1D Swin Transformer to handle long ECG
recordings while reducing computational complexity.
The encoder, using the Swin Transformer, segmented
the ECG into patches to extract essential features, fil-
tering out noise. This model, trained with three loss
functions, achieved an F1 score of 83.58 %, with pre-
cision at 97.62 % and sensitivity at 95.38 %, proving
effective in distinguishing signal quality levels.
X. Zhang et al. (Zhang et al., 2022) developed
a model for wearable ECGs using residual recurrent
modules (RRMs), combining CNNs and RNNs with
residual connections. Tested on data from cardio-
vascular patients and the China Physiological Signal
Challenge 2020 dataset (Cai et al., 2020), the model
achieved 98.72 % accuracy for two-category classifi-
cation and 92.31 % for three-category classification
(“good”, “medium”, “poor”). However, reduced sen-
sitivity to electrode motion artifacts remains a chal-
lenge.
Traditional ECG quality assessment methods of-
ten rely on fixed empirical thresholds or statistical
criteria tailored to specific datasets. While effective
within their original contexts, these approaches fre-
quently exhibit inconsistent performance when ap-
plied to different datasets, limiting their generaliz-
ability and practical utility. Despite recent advances,
current DL models, although highly effective in dis-
tinguishing noise from clean signals, often involve
complex architectures that are challenging to imple-
ment. Furthermore, these models predominantly fo-
cus on binary classification, overlooking opportuni-
ties to provide detailed insights, such as identifying
and categorizing specific types of noise.
3 METHODS
3.1 Data
In the present study, a supervised multi-label classifi-
cation DL model was developed. To achieve that, the
execution of this project involved the generation of a
custom dataset of ECG signals with controlled injec-
tions of typical ECG noise, so that the location and
type of noise was known.
Assessing Electrocardiogram Quality: A Deep Learning Framework For Noise Detection And Classification
795

To generate the custom dataset, two public
datasets were used: the PTB-XL (Patrick et al., 2022),
(Wagner et al., 2020) and the MIT-BIH (GB et al.,
1984). Both of them are available in PhysioNet
(Goldberger et al., 2000), a public repository of phys-
iological data.
The PTB-XL ECG dataset (Wagner et al., 2020),
(Patrick et al., 2022) is a large-scale collection of
21,837 12-lead clinical ECG recordings, each 10 sec-
onds in duration, sourced from 18,885 patients. The
dataset is stored in a 16-bit binary format with a reso-
lution of 1 µV/LSB and is available in two formats:
the original high-resolution version with a 500 Hz
sampling frequency and a down-sampled version at
100 Hz. It includes metadata on signal quality, ad-
dressing issues like noise, baseline drifts, and elec-
trode problems.
Notably diverse, PTB-XL includes ECG record-
ings from various diagnostic categories, such as nor-
mal, conduction disturbance, hypertrophy, myocar-
dial infarction, and ST/T changes. The dataset con-
sists of 56.36 % normal ECG and 43.64 % pathologi-
cal ECG, with annotations performed by cardiologists
and peer-reviewed to ensure high precision.
To create noisy ECG signals, noise from the MIT-
BIH Noise Stress Test Database was overlaid on clean
signals, including EM, BW, and MA types (GB et al.,
1984), (Patrick et al., 2022). These noise types were
selected for their prevalence in ECG recordings and
significant impact on signal quality. The noise dataset
includes three half-hour recordings captured during
physical activity with standard ECG equipment, sam-
pled at 360 Hz with two channels. The three noise
records represent EM, BW, and MA noise, typically
encountered in ambulatory ECG recordings.
3.1.1 Custom Dataset
The initial step in creating the custom dataset involved
curating records from the PTB-XL dataset. Metadata
was utilized to exclude records with noise annota-
tions, filtering out compromised ECGs.
Subsequently, a series of pre-processing steps
were applied: the ECG records were resampled from
500 Hz to 360 Hz, normalized (z-score normalization)
and filtered. The filtering method combined a band-
pass filter with a range of 1 to 45 Hz with a moving
average using sliding window of size 7, preserving the
signal’s integrity. Posteriorly, the cleanest leads were
selected by analyzing R-peaks and total peaks (in-
cluding non-cardiac-related peaks). Leads with fewer
than 8 R-peaks are excluded to remove empty signals.
Among the remaining leads, the three with the fewest
total peaks were chosen, as a higher number of non-
fiducial peaks suggests greater noise. This approach
was based on a previous study that employed a similar
methodology to generate an ECG dataset with con-
trolled noise injections, aimed at developing a model
for ECG signal denoising (Dias et al., 2024).
The dataset was divided in train, validation, and
test sets by patient IDs to prevent data leakage. 70
% of patient IDs were allocated to training, 15 %
to validation, and 15 % to testing, as seen in Table
1,resulting in varying ECG totals across subsets. This
split was also applied to normalized noise records.
To simulate realistic noisy ECG signals, noise was
added to clean signals based on specific criteria. To
mimic real-world variability, a random number of
noise intervals was selected, ranging from zero to a
maximum of four intervals, given the 10-second dura-
tion of each ECG segment. Each interval follows spe-
cific rules: BW noise requires a minimum duration of
5 seconds to reflect the prolonged disturbances typical
of this noise type, while other types are capped at 5.6
seconds to avoid dominating the entire signal. To pre-
vent abrupt transitions and create more realistic noise
patterns, smooth transitions are applied at the start
and end of each interval using a moving average. The
noise is scaled using random factor between 0.2 and
1 to comprise different amounts of noise. The noise
information is also annotated and it includes starting
and ending samples of the noise addition, along side
with the one-hot encoding of the noise types present
per interval. This information was used to generate
the true labels (the output of the model).
The model’s output is a one-hot encoded vector
with the same length as the input signal. Each po-
sition of the one-hot encoded array represents a type
of noise, in this case MA, EM and BW. The genera-
tion of the true labels handles overlapping intervals,
allowing multiple types of noise to be present simul-
taneously. The structure of the output and its relation
to the noisy signals is illustrated in Figure 1.
3.2 Model Architecture
The neural network was designed to detect and clas-
sify noise types in ECG signals, outputting a one-hot
encoded vector that identifies the noise type at each
timestep. The model processes input sequences of
size [batch size, 3600, 1], where each time step cor-
responds to a single ECG value.
Table 1: Number of records in train, validation, and testing
sets.
Set Number of Records
Training 45689
Validation 13976
Testing 14340
BIOSIGNALS 2025 - 18th International Conference on Bio-inspired Systems and Signal Processing
796

Legend: MA: Muscle Activation, EM: Electrode Motion,
BW: Baseline Wander.
Figure 1: Example of the model’s output.
The architecture includes three stacked GRU lay-
ers, effective for handling temporal sequences, with
bidirectional processing. A dropout layer follows
each GRU layer to prevent overfitting by temporarily
deactivating units across the feature space. The fully
connected (FC) layer transforms the GRU output into
a [batch size, 3600, 3] tensor, classifying each time
step into one of three states [MA, EM, BW].
The model outputs a sequence of vectors with di-
mensions [batch size, 3600, 3], providing raw logit
scores for each noise type at each time step.
3.3 Training, Validation, and Testing
Processes
The loss function used for training was Binary Cross-
Entropy with Logits Loss, which is well-suited for bi-
nary classification tasks where the model outputs raw
logits for each class. The forward pass was optimized
using the Adam optimizer, that adjusts learning rates
based on the gradients.
This structure supports training, validation, and
testing, with an early stopping criterion during train-
ing to prevent overfitting and improve generalization
on unseen data. Validation uses the same criterion to
evaluate generalization without affecting the model’s
parameters, while the best-performing model is saved
based on validation loss improvements.
The hyperparameter optimization was achieved
through a grid search, shown in Table 2, identifying
the optimal values to minimize validation loss, and
the model’s testing involves loading this best model
and converting raw logits to binary predictions for
each noise type using an adaptive threshold optimized
via class-specific ROC (Receiver operating character-
istic) curve analysis, which maximizes the geometric
mean to balance sensitivity and specificity for each
class.
The model was trained using an NVIDIA RTX
6000 ADA Generation Graphics Processing Units
(GPU) (NVIDIA Corporation, 2024), with the project
implemented in PyTorch (Ansel et al., 2024).
3.4 Performance Metrics
Evaluation metrics provide a balanced assessment of
the model’s performance across all noise classes.
An individual confusion matrix was computed for
each noise type to evaluate the model’s ability to cor-
rectly predict whether each class (MA, EM, BW)
is ’Present’ or ’Absent’. The matrix shows the
counts of True Negatives (TN), False Positives (FP),
False Negatives (FN) and True Positives (TP).
Additionally, a general multi-label confusion ma-
trix was calculated to evaluate the model’s ability to
detect each of the four categories: MA [1, , ], EM
[ , 1, ], BW [ , , 1], and None [0, 0, 0]. This ma-
trix summarizes the frequency of noise misclassifica-
tion and helps to identify which classes are most com-
monly confused. It is important to note that None is
not a distinct class but rather a result of no noise being
present.
• TP: Correct predictions where the true labels
match the predicted labels. In the matrix, the TP
values can be found along the diagonal for each
class.
• FN: Instances where the model fails to predict a
class when it is present. It is the sum of the values
in the row corresponding to the true class, exclud-
ing the diagonal value.
• FP: Instances where the model predicts the class,
when it is not present. It is the sum of the values in
the column corresponding to the predicted class,
excluding the diagonal value.
• TN: Instances where the model correctly identi-
fies the absence of the class. It is the sum of all
values in the matrix minus the sum of the row and
column for that class, plus the diagonal value (TP)
for that class.
• None Category: Indicates how well the model rec-
ognizes instances where no noise is present. This
is the case where both the predicted and true la-
bels are ‘None‘.
The evaluation metrics used to assess the model’s
performance include accuracy, precision, recall, and
the F1 score.
Table 2: Hyperparameter values explored during grid
search.
Hyperparameters Values
Type of layers GRU
Number of layers 3
Bidirectional True/False
Batch size 128
Hidden size 64, 128, 256
Dropout rate 0, 0.3, 0.5
Assessing Electrocardiogram Quality: A Deep Learning Framework For Noise Detection And Classification
797

Figure 2: Global Matrix.
Table 3: Thresholds for clean ECG signals for kurtosis
(kurt), power spectral density (psd), baseline relative power
(bas) (Zhao and Zhang, 2018), skewness (skew), and signal-
to-noise ratio (SNR) (Rahman et al., 2022).
Metric Range
kurt > 5
psd > 0.9
bas > 0.95
skew > -0.8 ∩ ≤ 0.8
SNR > 10 dB
3.5 Comparison with Traditional
Methods
The model was compared against noise detection tra-
ditional methods, by assessing the effectiveness of
traditional Signal Quality Indicators (SQI) on the test
set. To perform this test, both the original and the
customized signals were used: the signals with added
noise were classified as noisy (regardless of the the
magnitude) and the original signals as clean. To verify
its effectiveness, the number of correct and incorrect
classifications by the SQI were counted. Given the
thresholds available in literature for Kurtosis (kurt),
Skewness (skew), Power Spectral Density (psd) and
Baseline Relative Power (bas), the percentages of
correct and incorrect classifcations were computed.
For the Signal-to-Noise Ratio (SNR), both clean and
noisy pairs were used. The thresholds used are pre-
sented in Table 3 .
3.6 Binary Classification
From the output of the developed model, a second
output was generated with the purpose of also per-
forming a binary classification per signal. This ap-
proach was included in order to make it possible to
compare the present model with the results found in
the literature. The one-hot encoded array (original
output) was converted to a binary output: one if there
was any type of noise active (noisy) and zero if no
noise was present (clean).
Table 4: Model hyperparameters and best validation loss.
Hyperparameters Values
Number of GRU layers 3
Hidden Size 128
Bidirectional True
Dropout Rate 0.3
Learning Rate 0.001
Batch Size 128
Best Validation Loss 0.34
4 RESULTS
4.1 Final Architecture
The architecture of the model that lead to the low-
est loss in the validation set is detailed in Table 4
and depicted in Figure 3. It has 3 bidirectional lay-
ers with a hidden size of 128, a dropout rate of 0.3, a
learning rate of 0.001, and a batch size of 128. The
model reached its lowest validation loss of 0.34 at
epoch 43. Figure 4 presents the training and valida-
tion loss curves over the epochs. While the training
loss steadily decreases across all epochs, the valida-
tion loss begins to rise after the 43rd epoch, indicating
that the model starts to overfit to the training data at
this point. The weights used correspond to those from
the 43rd epoch.
4.2 Performance Metrics on the Test Set
The model performance was evaluated using accu-
racy, precision, recall, and F1-scores for three noise
types. These results are summarized in Table 5. Ac-
curacy was highest for EM noise at 92.86 %, followed
by BW noise at 92.05 %, with the lowest accuracy for
MA noise at 81.55 %. In precision, BW noise scored
highest at 82.36 %, indicating fewer false positives,
while EM and MA noise scored 79.35 % and 50.37 %,
respectively. Recall was consistently high, with BW
noise achieving 96.56 %, followed by MA at 90.14 %
and EM at 85.26 %. The F1 score, balancing preci-
sion and recall, reflected these trends, with BW noise
scoring 88.89 %, EM 82.19 %, and MA 64.62 %.
The confusion matrices for each noise type in Fig-
ure 5 reveal distinct patterns in distinguishing noise
Table 5: Performance Metrics
Metric MA EM BW
Accuracy (%) 81.55 92.86 92.05
Precision (%) 50.37 79.35 82.36
Recall (%) 90.14 85.26 96.56
F1 Score (%) 64.62 82.19 88.89
BIOSIGNALS 2025 - 18th International Conference on Bio-inspired Systems and Signal Processing
798
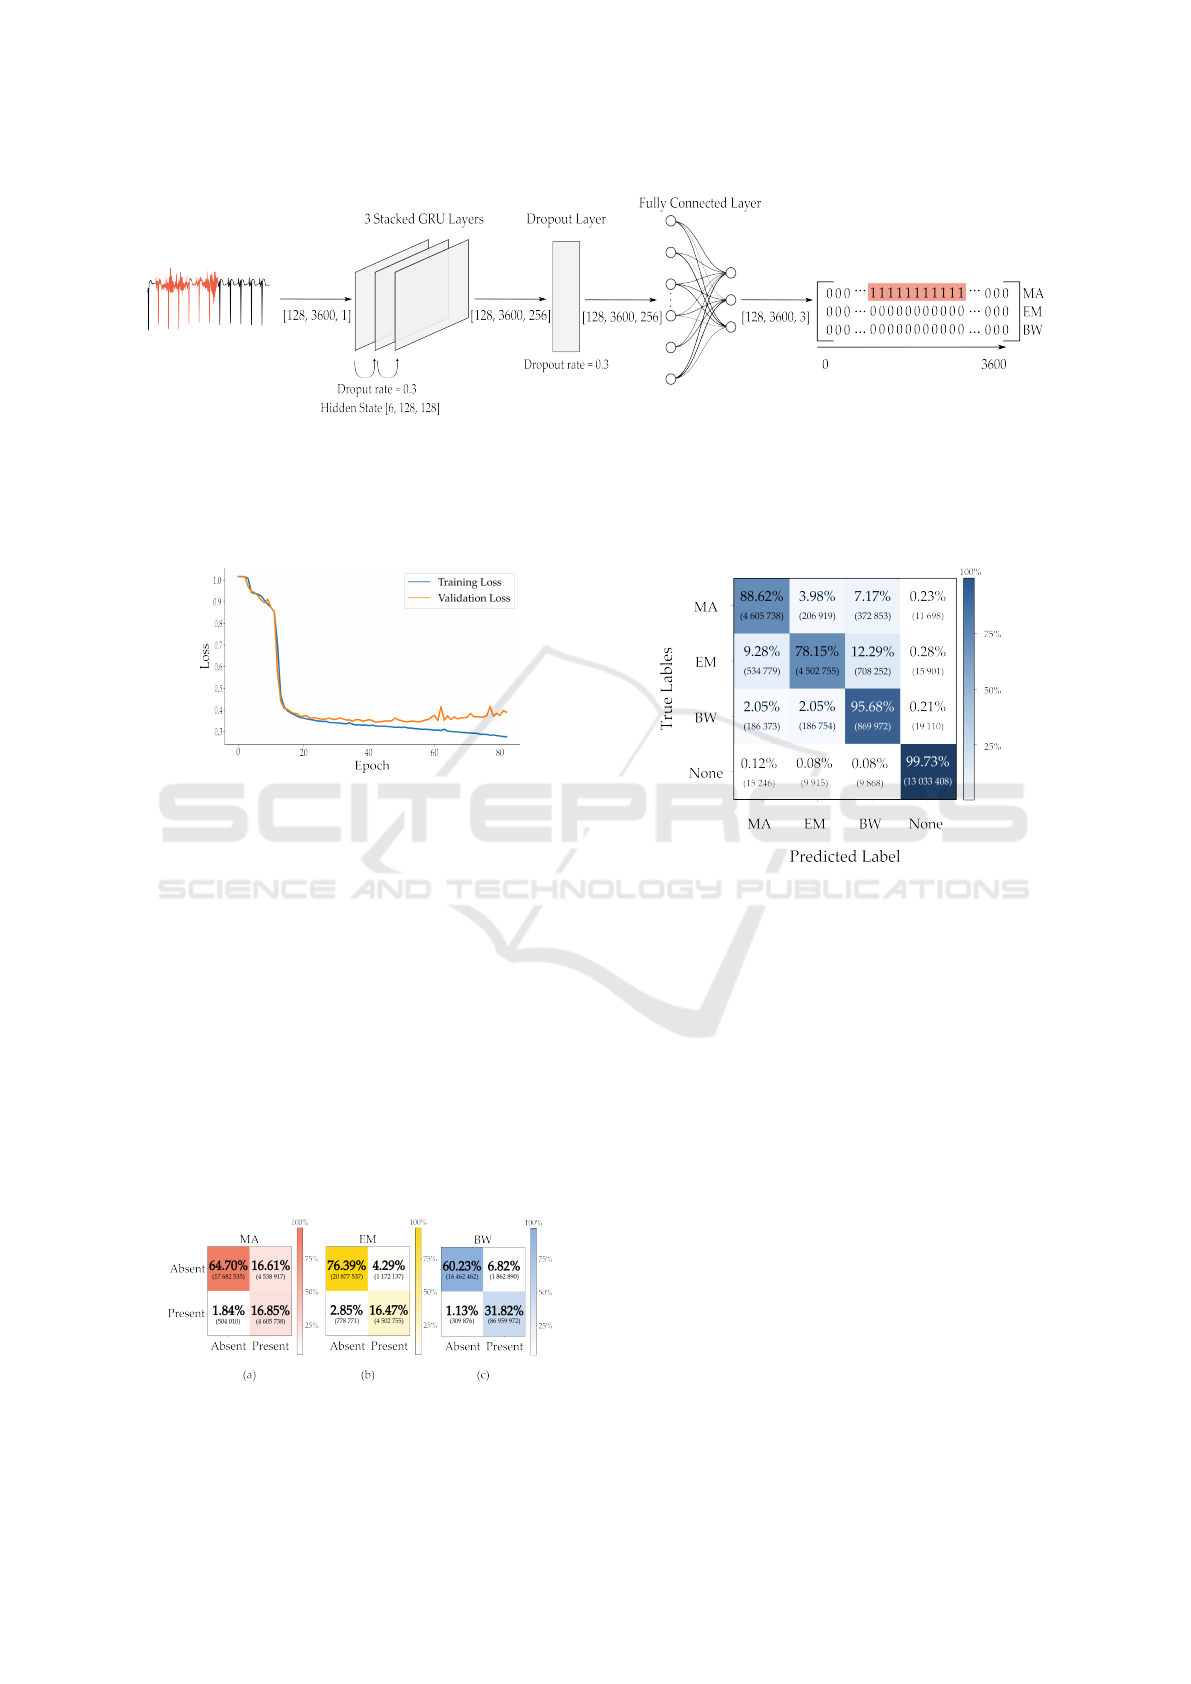
Figure 3: Schematic representation of the proposed model. The input tensor has a shape of [128, 3600, 1], where 128 is the
batch size, 3600 is the sequence length, and 1 represents the input size (number of features per time step). The hidden state
in the GRU is [6, 128, 128], reflecting 3 stacked layers with bidirectional processing (3 × 2 directions), where the first 128 is
the batch size and the second 128 is the hidden size (number of neurons). After processing through the GRU, the output has a
shape of [128, 3600, 256] (due to being a bidirectional stack), which is passed a dropout layer and through a fully connected
layer, reducing the dimensions to [128, 3600, 3] to classify each time step into one of 3 possible states.
Figure 4: Training and validation loss curves per epoch,
during training.
presence. The ’Absent’ category has a higher count,
reflecting the predominance of clean ECG samples.
For MA noise (Figure 5 (a)), 81.55 % of cases were
correctly classified for noise presence: 64.70 % as
noise-free and 16.85 % correctly identified as noisy.
Misclassifications included 1.84 % false positives and
16.61 % false negatives. In the case of EM noise
(Figure 5 (b)), 92.86 % of cases were classified ac-
curately: 76.39 % as noise-free and 16.47 % as noisy.
There were 2.85 % false positives and 4.29 % false
negatives. For BW noise (Figure 5 (c)), 92.05 % of
instances were correctly classified: 60.23 % as noise-
free and 31.82 % as noisy. False positives accounted
for 1.13 % and false negatives for 6.82 %.
The overview matrix in Figure 6 evaluates the
model’s performance across noise categories and
Figure 5: Confusion matrices for each type of noise: (a)
MA, (b) EM, (c) BW.
Figure 6: Multi-label confusion matrix.
clean intervals. The None category, representing
noise-free periods, shows a high correct identification
rate of 99.73 %, with minimal misclassifications: 0.12
% as MA, 0.08 % as EM and 0.08 % as BW. For BW
noise, the model achieves a correct classification rate
of 95.68 %, though some confusion occurs, with 2.05
% of BW instances misclassified as EM and 2.05 %
as MA. EM noise shows a correct classification rate
of 78.15 %, with higher misclassifications: 12.29 %
misidentified as BW and 9.28 % as EM. MA noise
has a correct classification rate of 88.62 %, with mis-
classifications at 7.17 % confused with BW and 3.98
% with EM.
Figures 7a and 7b illustrate examples where the
model was able to classify isolated noise types where
there is no overlap, the model successfully distin-
guishes between separate BW, EM and MA noise seg-
ments.
Figures 8a and 8b, show an example of the
model’s performance in more complex cases where
there are distinct noise types overlapping. In Figure
8a, it accurately identifies combinations of BW with
MA and BW with EM, and similarly, in 8b, over-
Assessing Electrocardiogram Quality: A Deep Learning Framework For Noise Detection And Classification
799
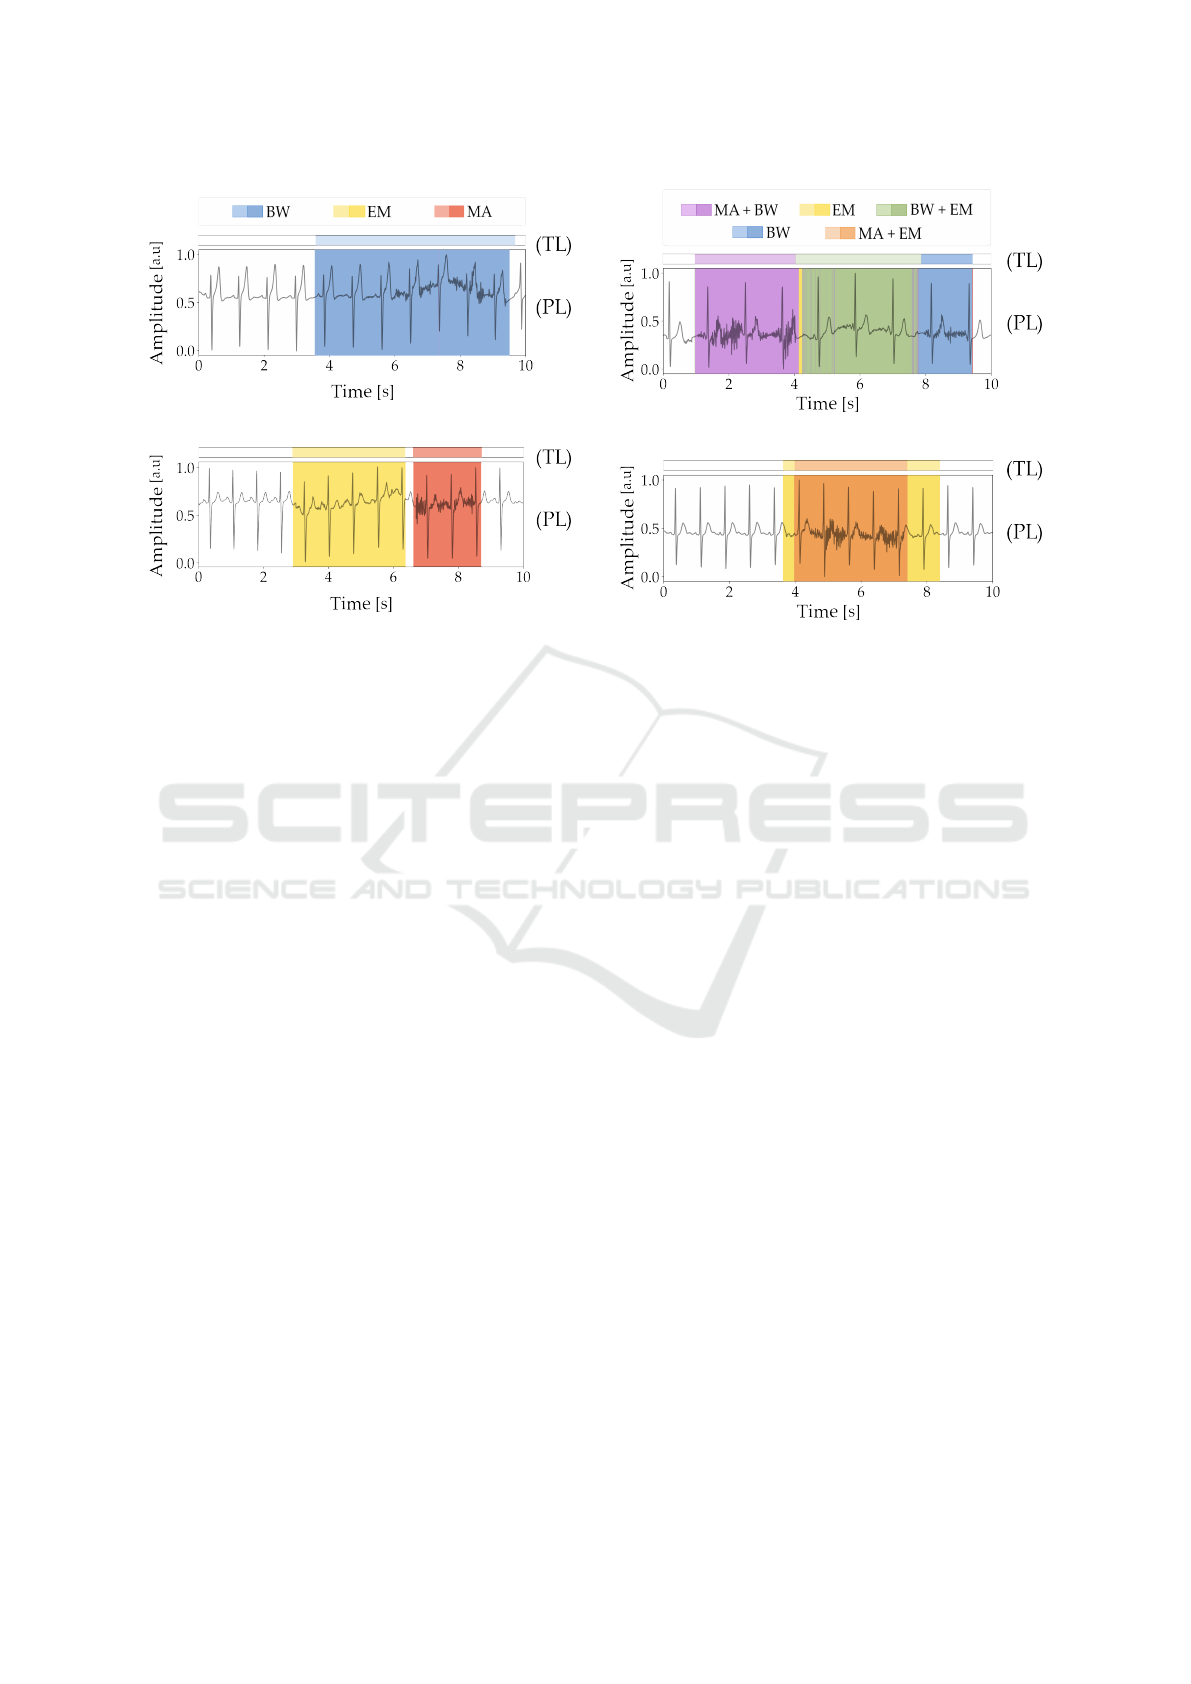
(a)
(b)
Legend: TL - True Labels, PL - Predicted Labels.
Figure 7: Examples of predictions with different noise types
present (without overlapping). (a) BW and (b) EM and MA.
lapping MA and EM segments are correctly classi-
fied. However, limitations appear when noise types
are more challenging to distinguish. This limitation
is evident in Figures 9a and 9b, where, despite cor-
rectly detecting noisy segments, the model occasion-
ally confuses EM and MA noise. In Figure 9a(a), EM
is misclassified as MA, and, in 9b, MA is mistaken for
EM. With three overlapping noise types, the model’s
performance varies. As an example, in Figure 10a,
it manages to accurately classify a complex combina-
tion of BW, MA, and EM noise. However, in 10b,
differentiation between noise types fails, resulting in
misclassifications. This selection of signals exam-
ples and corresponding results illustrates the model’s
strengths and limitations when handling increasing
noise overlap complexity.
4.3 Traditional Metrics as an
Assessment Tool
Table 6 shows that SNR achieved the highest correct
classification rate at 88.70 %, followed by skew at
74.54 %, kurt at 54.12 %, and bas at 53.17 %. The
lowest rate was observed for psd at 52.83 %.
4.4 Binary Classification: Performance
Evaluation
In comparison with deep learning methods using bi-
nary classification to identify signals as clean or noisy,
(a)
(b)
Legend: TL - True Labels, PL - Predicted Labels.
Figure 8: Examples of predictions with different noise types
overlapping: (a) BW + MA and BW + EM and (b) MA +
EM.
the model achieved an accuracy of 99.72 %, precision
of 99.78 %, recall of 99.68 %, and an F1 score of
99.73 %.
The performance metrics and confusion matrices
provide insight into the model’s ability to classify
noise types, highlighting false positives, false nega-
tives, and overall accuracy. While accuracy offers a
general overview, precision, recall, and the confusion
matrices give a clearer understanding of misclassifi-
cations, particularly for the imbalanced dataset.
5 DISCUSSION
5.1 Performance on Test Set
The performance metrics, along with the confusion
matrices, provide insight into the model’s ability to
classify each noise type, highlighting false positives,
false negatives, and overall accuracy. While accuracy
provides an overview, precision, recall, and class ma-
trices offer a clearer view of how well each class is
detected, revealing potential false positives (FP) and
false negatives (FN).
The model demonstrated strong performance for
BW noise, achieving high precision and recall. This
reflects effective recognition of BW, with minimal
misclassifications. EM also exhibited high accuracy,
but with lower recall, indicating occasional oversight
BIOSIGNALS 2025 - 18th International Conference on Bio-inspired Systems and Signal Processing
800
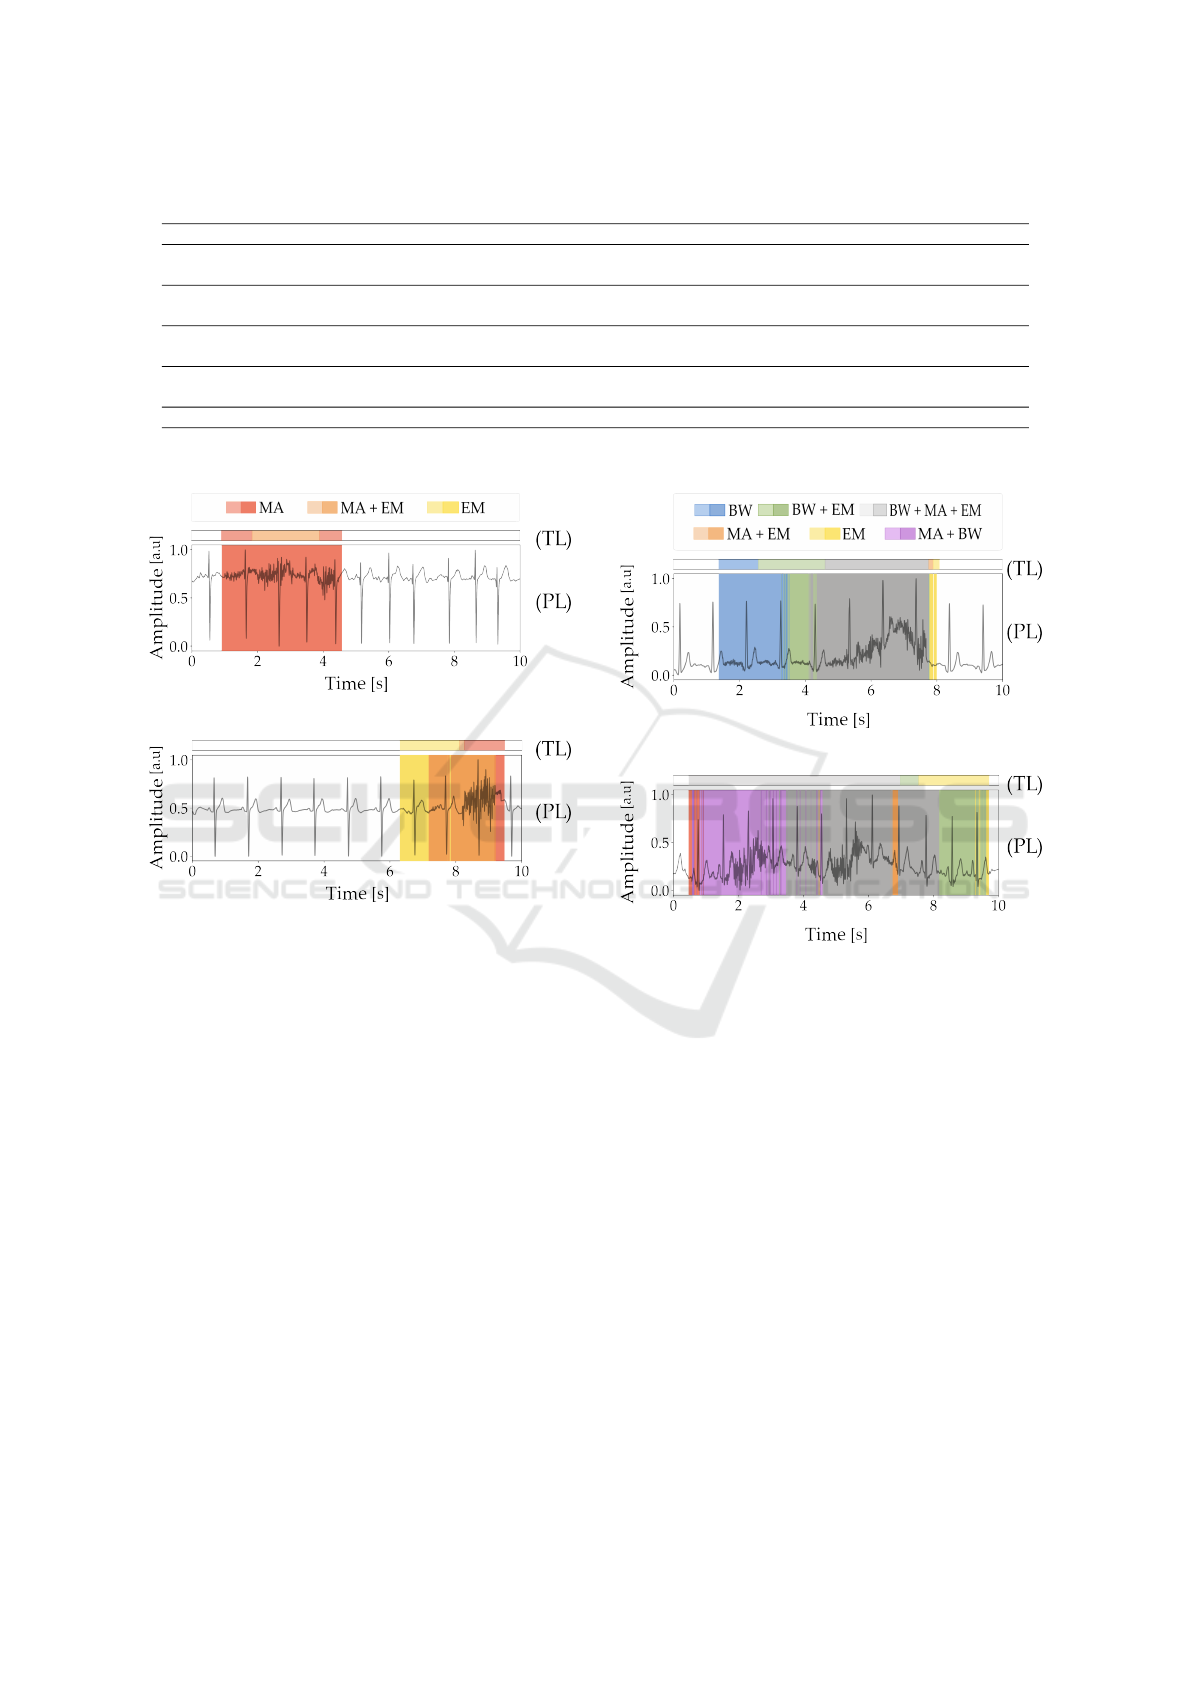
Table 6: Performance of traditional metrics on test set.
Metric Signal Type Range Min Max Mean SD Incorrect % Correct %
kurt Noisy ≤ 5 -0.812 39.445 9.780 6.013 45.88 54.12
Clean > 5 -1.150 61.227 11.917 6.772
psd Noisy ≤ 0.9 0.192 0.995 0.719 0.110 47.17 52.83
Clean > 0.9 0.364 0.998 0.756 0.109
bas Noisy ≤ 0.95 0.598 1.000 0.983 0.026 46.83 53.17
Clean > 0.95 0.902 1.000 0.997 0.005
skew Noisy ≤ -0.8 ∪ > 0.8 -5.105 5.809 0.344 2.407 32.41 74.54
Clean > -0.8 ∩ ≤ 0.8 -5.438 5.971 0.409 2.762
SNR Noisy and Clean clean if ≤ 10 dB -4.138 48.682 20.577 8.289 11.30 88.70
*The thresholds for the kurt, psd, and bas can be found in (Zhao and Zhang, 2018), and the values for the skew and SNR are documented in (Rahman et al., 2022)
(a)
(b)
Legend: TL - True Labels, PL - Predicted Labels.
Figure 9: Examples of predictions where there was overlap-
ping noise: (a) MA + EM overlapped noise being classified
as MA and (b) MA and EM being classified as MA + EM.
of this class. MA, on the other hand, showed the
lowest classification accuracy, characterized by sig-
nificant over-detection and comparatively lower pre-
cision, though recall remained high, suggesting reli-
able identification when present.
The F1 score, which balances precision and recall,
was highest for BW, underscoring its effective man-
agement of both metrics. EM achieved moderate bal-
ance, while MA faced challenges in balancing false
positives and negatives. Despite these variations, the
recall rates across noise types remained consistently
high, indicating the model’s robustness in identify-
ing positive instances. The use of class weights con-
tributed to these results by mitigating the impact of
class imbalances.
When different noise types overlap in the same
signal segment, misclassifications are often influ-
(a)
(b)
Legend: TL - True Labels, PL - Predicted Labels.
Figure 10: Examples of predictions with three different
noise types overlapping: (a) BW + MA + EM and (b) BW
+ MA + EM.
enced by the amplitude of each noise type, which is
influenced by the applied scale factor. When, in a
given interval, a specific noise has higher amplitude, it
likely leads to predictions that favor the more promi-
nent noise and misclassify the less pronounced ones.
This is evident in the examples shown in Figures 9a,
9a and 10b.
BW is correctly identified in 95.68 % of cases, as
expected for low-frequency noise, since its frequency
range falls out of the meaningful frequency range of
ECG signals. The overrepresentation of BW, due to
its minimum duration of 5 seconds, may contribute
to its overclassification. Despite relatively high re-
call for all classes, closer examination of the confu-
sion matrix highlights noticeable effects, particularly
Assessing Electrocardiogram Quality: A Deep Learning Framework For Noise Detection And Classification
801

in the misclassification of EM as MA. This is reflected
in the higher FP rate for MA and the increased FN for
EM. The overlapping frequency bands of MA (0.01 to
100 Hz) and EM (1 to 10 Hz) hinder the model’s per-
formance in distinguishing between the noise types,
further complicating classification.
Overall, the model demonstrates strong potential
for detecting and classifying noise types in ECG sig-
nals, with particular success in identifying noise com-
binations, though it faces challenges with more com-
plex overlapping scenarios.
5.2 Comparison with Traditional
Metrics
While a direct comparison between traditional met-
rics and deep learning methods is not feasible due to
their differing approaches, a simple binary test dis-
tinguishing noisy from clean signals reveals notable
performance contrasts. In this experiment, traditional
metrics like SNR achieved 88.70 % accuracy, while
most others fell below 75 %, as shown in Table 6.
However, SNR’s practical utility is limited, as it re-
quires access to both clean and noisy versions of a
signal, a requirement rarely met in real-world settings
where clean signals are typically unavailable.
5.3 Binary Classification and
Comparison with State of the Art
DL Methods
The model excels at binary noise classification,
achieving 99.72 % accuracy, 99.78 % precision, 99.68
% recall, and 99.73 % F1 score. In comparison,
the highest accuracy reported in the literature review
is 98.72% (Zhang et al., 2022). However, direct
comparison is challenging, as the cited work defines
a noisy signal based on QRS complex readability,
which differs from this study’s approach. Addition-
ally, many referenced papers do not provide all the
metrics used here. The model stands out for its low
complexity and its ability to provide more detailed in-
formation compared to the approaches. In addition to
distinguishing between clean and noisy signals, it ac-
curately identifies and classifies the specific types of
noise present in noisy segments.
6 CONCLUSIONS AND FUTURE
WORK
This work presents a model for the detection and clas-
sification of noise in ECG signals, achieving high ac-
curacy in distinguishing different noise types. The
model demonstrated strong performance in identify-
ing binary noisy versus clean signals, as well as clas-
sifying noise types in various scenarios, including
overlapping segments. The approach effectively uti-
lized DL techniques to offer a significant improve-
ment over traditional metrics, with superior results
in noise detection and classification. The model
achieved notable accuracy, precision, recall, and F1
scores, highlighting its potential for practical applica-
tions, including real-time feedback for medical pro-
fessionals in clinical settings and alerts for patients in
ambulatory environments. Its ability to classify and
localize noise types enhances the effectiveness of de-
noising methods, both traditional and deep learning-
based, by targeting specific noise segments. In clini-
cal contexts, the model could be slightly modified to
receive as input directly the 12-lead ECG data, al-
lowing the identification of specific noise types and
providing real-time feedback to medical profession-
als. In ambulatory settings, it could be used in alert
systems to promptly detect issues in the data col-
lection and offer guidance on corrections. While
the model demonstrates strengths, it also has lim-
itations. Its performance decreases when handling
overlapping noise types, particularly in distinguish-
ing between EM and MA noises. Although results
are satisfactory, integrating an attention mechanism
could enhance performance. By adding an attention
layer after the stacked GRU layers, the model could
potentially focus on distinguishing features of each
noise type, improving classification accuracy. Cur-
rently, the model focuses on temporal detection with-
out considering noise intensity. Incorporating noise
level values would improve its application. Transfer
learning could be used to extend the output vector to
capture continuous values representing noise levels,
enhancing the model’s ability to quantify differences
between clean and noisy signals. Despite achieving
good results with a simple architecture, the model cur-
rently employs a sample-to-sample approach, produc-
ing lengthy outputs. A more efficient solution could
be an interval-based approach, summarizing noise de-
tection over fixed time intervals (e.g., 1-second win-
dows), reducing output size while maintaining accu-
racy. This would make the model more suitable for
real-time applications. Testing with real datasets is
another consideration. Fine-tuning the model with
real data could lead to improvements, but it would re-
quire extensive manual labeling. Real-world signals
often lack clearly distinguishable noise types, making
the labeling task even more challenging. Despite ar-
eas for improvement, the model’s simple architecture
and promising results suggest great potential for sig-
BIOSIGNALS 2025 - 18th International Conference on Bio-inspired Systems and Signal Processing
802

nificant advancements in ECG noise classification and
real-time applications. Beyond detecting noise, this
model contributes to research by advancing current
deep learning approaches, offering a refined ability to
categorize noise types, and precisely targeting noisy
segments for potentially enhancing current denoising
methods. Additionally, it holds promise for aiding in
the development of automatically labeled databases,
especially for wearable-acquired data, thereby sup-
porting more efficient and accurate data processing
in clinical and ambulatory settings Overall, this work
marks a step forward in ECG noise classification, with
a model that demonstrates both practical and research
potential, paving the way for enhanced noise manage-
ment in clinical and ambulatory settings.
REFERENCES
American Heart Association (2024). Holter monitor.
https://www.heart.org/en/health-topics/heart-attack/
diagnosing-a-heart-attack/holter-monitor. Accessed:
2024/09/24.
Ansel, J., Yang, E., He, H., Gimelshein, N., Jain, A., Vozne-
sensky, M., Bao, B., Bell, P., Berard, D., Burovski, E.,
Chauhan, G., Chourdia, A., Constable, W., Desmai-
son, A., DeVito, Z., Ellison, E., Feng, W., Gong, J.,
Gschwind, M., Hirsh, B., Huang, S., Kalambarkar, K.,
Kirsch, L., Lazos, M., Lezcano, M., Liang, Y., Liang,
J., Lu, Y., Luk, C., Maher, B., Pan, Y., Puhrsch, C.,
Reso, M., Saroufim, M., Siraichi, M. Y., Suk, H., Suo,
M., Tillet, P., Wang, E., Wang, X., Wen, W., Zhang,
S., Zhao, X., Zhou, K., Zou, R., Mathews, A., Chanan,
G., Wu, P., and Chintala, S. (2024). Pytorch 2: Faster
machine learning through dynamic python bytecode
transformation and graph compilation. In Proceed-
ings of the 29th ACM International Conference on Ar-
chitectural Support for Programming Languages and
Operating Systems, Volume 2 (ASPLOS ’24). ACM.
Baldassarre, A., Mucci, N., Padovan, M., Pellitteri, A., Vis-
cera, S., Lecca, L. I., Galea, R. P., and Arcangeli, G.
(2020). The role of electrocardiography in occupa-
tional medicine, from einthoven’s invention to the dig-
ital era of wearable devices. Int J Environ Res Public
Health, 17(14):4975.
Cai, Z., Liu, C., Gao, H., Wang, X., Zhao, L., Shen, Q.,
Ng, E. Y. K., and Li, J. (2020). An open-access long-
term wearable ecg database for premature ventricular
contractions and supraventricular premature beat de-
tection. Journal of Medical Imaging and Health In-
formatics, 10(11):2663–2667.
Carrington, M., Provid
ˆ
encia, R., Chahal, C. A. A., Ricci, F.,
Epstein, A. E., Gallina, S., Fedorowski, A., Sutton, R.,
and Khanji, M. Y. (2022). Monitoring and diagnosis
of intermittent arrhythmias: evidence-based guidance
and role of novel monitoring strategies. Eur Heart J
Open, 2(6).
Chen, G., Shi, T., Xie, B., Zhao, Z., Meng, Z., Huang,
Y., and Dong, J. (2023). Swindae: Electrocardiogram
quality assessment using 1d swin transformer and de-
noising autoencoder. IEEE Journal of Biomedical and
Health Informatics, 27(12):5779–5790.
Chiarugi, F., Sakkalis, V., Emmanouilidou, D., Krontiris, T.,
Varanini, M., and Tollis, I. (2007). Adaptive thresh-
old qrs detector with best channel selection based on
a noise rating system. In Computers in Cardiology,
pages 157–160.
Clifford, G. D., Liu, C., Moody, B., Li-Wei, H., Silva, I., Li,
Q., Johnson, A. E., and Mark, R. G. (2017). Af clas-
sification from a short single lead ecg recording: The
physionet/computing in cardiology challenge 2017. In
2017 Computing in Cardiology (CinC), pages 1–4.
IEEE.
Dahiya, E. S., Kalra, A. M., Lowe, A., and Anand, G.
(2024). Wearable technology for monitoring electro-
cardiograms (ecgs) in adults: A scoping review. Sen-
sors, 24(4).
Dias, M., Probst, P., Silva, L., and Gamboa, H. (2024).
Cleaning ecg with deep learning: A denoiser tested
in industrial settings. SN Computer Science, 5(6):699.
GB, M., WK, M., and RG, M. (1984). A noise stress test
for arrhythmia detectors. Computers in cardiology,
11:381–384.
Goldberger, A. L., Amaral, L. A. N., Glass, L., Hausdorff,
J. M., Ivanov, P. C., Mark, R. G., Mietus, J. E., Moody,
G. B., Peng, C.-K., and Stanley, H. E. (2000). Phys-
iobank, physiotoolkit, and physionet. Circulation,
101.
Huerta,
´
A., Mart
´
ınez-Rodrigo, A., Gonz
´
alez, V. B., Que-
sada, A., Rieta, J., and Alcaraz, R. (2019). Quality
assessment of very long-term ecg recordings using a
convolutional neural network. In 2019 E-Health and
Bioengineering Conference (EHB), pages 1–4.
Huerta,
´
A., Mart
´
ınez-Rodrigo, A., Puchol, A., Pach
´
on,
M. I., Rieta, J. J., and Alcaraz, R. (2020). Compar-
ison of pre-trained deep learning algorithms for qual-
ity assessment of electrocardiographic recordings. In
2020 International Conference on e-Health and Bio-
engineering (EHB), pages 1–4.
Iravanian, S. and Tung, L. (2002). A novel algorithm for
cardiac biosignal filtering based on filtered residue
method. IEEE Transactions on Biomedical Engineer-
ing, 49(11):1310–1317.
Jin, Y., Li, Z., Qin, C., Liu, J., Liu, Y., Zhao, L., and Liu,
C. (2023). A novel attentional deep neural network-
based assessment method for ecg quality. Biomedical
Signal Processing and Control, 79:104064.
Kher, R. (2019). Signal processing techniques for removing
noise from ecg signals. Journal of Biomedical Engi-
neering and Research, 1:1–9.
Li, L. (2016). A quality assessment method of single-
lead ecg signal based on spectral analysis. 8th In-
ternational Conference on Information Technology in
Medicine and Education (ITME), pages 35–38.
Liu, G., Han, X., Tian, L., Zhou, W., and Liu, H.
(2021). Ecg quality assessment based on hand-
crafted statistics and deep-learned s-transform spec-
trogram features. Computer Methods and Programs
in Biomedicine, 208:106269.
Assessing Electrocardiogram Quality: A Deep Learning Framework For Noise Detection And Classification
803

Liu, S.-H., Wang, J.-J., Su, C.-H., and Tan, T.-H. (2018).
Development of a patch-type electrocardiographic
monitor for real time heartbeat detection and heart rate
variability analysis. Journal of Medical and Biologi-
cal Engineering, 38(6):411–423.
Mondal, A., Manikandan, M. S., and Pachori, R. B. (2022).
Convolutional neural network based ecg quality as-
sessment using derivative signal. In 2022 Fourth In-
ternational Conference on Cognitive Computing and
Information Processing (CCIP), pages 1–5.
NVIDIA Corporation (2024). Nvidia rtx 6000 ada gener-
ation graphics card. https://www.nvidia.com/en-us/
design-visualization/rtx-6000/.
Oh, S. (2004). A New Quality Measure In Electrocardio-
gram Signal. Master thesis, University of Florida.
Patrick, W., Nils, S., Ralf-Dieter, B., Wojciech, S., and To-
bias, S. (2022). Ptb-xl, a large publicly available elec-
trocardiography dataset (version 1.0.3).
Pingitore, A., Peruzzi, M., Clarich, S. C., Palam
`
a, Z., Scia-
rra, L., and Cavarretta, E. (2023). An overview of
the electrocardiographic monitoring devices in sports
cardiology: Between present and future. Clinical Car-
diology, 46(9):1028–1037.
Rahman, M. S., Karmakar, C., Natgunanathan, I., Year-
wood, J., and Palaniswami, M. (2022). Robustness
of electrocardiogram signal quality indices. Journal
of The Royal Society Interface, 19.
Rio, B., Lopetegi, T., and Romero, I. (2011). Assessment of
different methods to estimate electrocardiogram sig-
nal quality. Computing in Cardiology, 38:609–612.
Silva, I., Moody, G., and Celi, L. (2011). Improving the
quality of ecgs collected using mobile phones: The
physionet/computing in cardiology challenge 2011. In
Computing in Cardiology, volume 38, page 273-276.
van der Bijl, K., Elgendi, M., and Menon, C. (2022). Au-
tomatic ecg quality assessment techniques: A system-
atic review. Diagnostics, 12(11):2578.
Wagner, P., Strodthoff, N., Bousseljot, R.-D., Kreiseler, D.,
Lunze, F. I., Samek, W., and Schaeffter, T. (2020).
Ptb-xl, a large publicly available electrocardiography
dataset. Scientific Data, 7:154.
Wang, J. (2002). A new method for evaluating ecg signal
quality for multi-lead arrhythmia analysis. Computers
in Cardiology, 29:85–88.
World Health Organization (2024). Cardiovascular dis-
eases. Retrieved September 24, 2024.
Zhang, J., Wang, L., Zhang, W., and Yao, J. (2018). A sig-
nal quality assessment method for electrocardiogra-
phy acquired by mobile device. In 2018 IEEE Interna-
tional Conference on Bioinformatics and Biomedicine
(BIBM), pages 1–3.
Zhang, X., Li, J., Cai, Z., Zhao, L., and Liu, C. (2022). Deep
learning-based signal quality assessment for wearable
ecgs. IEEE Instrumentation & Measurement Maga-
zine, 25(5):41–52.
Zhao, Z. and Zhang, Y. (2018). Sqi quality evaluation
mechanism of single-lead ecg signal based on simple
heuristic fusion and fuzzy comprehensive evaluation.
Frontiers in Physiology, 9.
Zhong, M., Li, Z., Wang, C., Huang, J., Zhao, W., and Fan,
H. (2023). Quality assessment of electrocardiogram
signals using contrastive learning. In 2023 13th In-
ternational Conference on Information Technology in
Medicine and Education (ITME), pages 323–328.
Zhou, X., Zhu, X., Nakamura, K., and Mahito, N. (2018).
Ecg quality assessment using 1d-convolutional neural
network. In 14th IEEE International Conference on
Signal Processing (ICSP), pages 780–784.
Zhou, X., Zhu, X., Nakamura, K., and Noro, M. (2021).
Electrocardiogram quality assessment with a gen-
eralized deep learning model assisted by condi-
tional generative adversarial networks. Life (Basel),
11(10):1013.
BIOSIGNALS 2025 - 18th International Conference on Bio-inspired Systems and Signal Processing
804
