DEMIS: Electron Microscopy Image Stitching Using Deep Learning
Features and Global Optimisation
Petr
ˇ
Silling
a
and Michal
ˇ
Span
ˇ
el
b
Department of Computer Graphics and Multimedia, Brno University of Technology, Brno, Czech Republic
fi fi
Keywords:
Electron Microscopy, Whole Slide Imaging, Image Stitching, Neural Networks.
Abstract:
Accurate stitching of overlapping image tiles is essential for reconstructing large-scale Electron Microscopy
(EM) images during Whole Slide Imaging. Current stitching approaches rely on handcrafted features and
translation-only global alignment based on Minimum Spanning Tree (MST) construction. This results in sub-
optimal global alignment since it neglects rotational errors and works only with transformations estimated
from pairwise feature matches, discarding valuable information tied to individual features. Moreover, hand-
crafted features may have trouble with repetitive textures. Motivated by the limitations of current methods
and recent advancements in deep learning, we propose DEMIS, a novel EM image stitching method. DEMIS
uses Local Feature TRansformer (LoFTR) for image matching, and optimises translational and rotational pa-
rameters directly at the level of individual features. For evaluation and training, we create EM424, a synthetic
dataset generated by splitting high-resolution EM images into arrays of overlapping image tiles. Furthermore,
to enable evaluation on unannotated real-world data, we design a no-reference stitching quality metric based
on optical flow. Experiments that use the new metric show that DEMIS can improve the average results
from 32.11 to 2.28 compared to current stitching techniques (a 1408% improvement). Code is available at:
https://github.com/PSilling/demis.
1 INTRODUCTION
Whole Slide Imaging is a technique for capturing
large biological samples that do not fit under the field
of view of a single electron microscope. To accom-
plish this, the sample is scanned in sections, creating
an array of tiles with a set overlap. The tiles are then
stitched into a composite image with a wide view and
higher resolution. To produce a high quality compos-
ite image, an accurate image stitching algorithm is
essential. However, there are multiple challenges in
electron microscopy image stitching that may not ap-
pear in other applications: (a) the presence of repeti-
tive texture patterns, which may degrade image reg-
istration results, (b) the occurrence of empty areas
with low quality texture and few informative features,
and (c) the extensive size of the stitched arrays (com-
monly containing tens or even hundreds of ultra high-
-definition images), which requires the use of algo-
rithms that can mitigate the gradual accumulation of
stitching errors.
a
https://orcid.org/0000-0001-5921-8109
b
https://orcid.org/0000-0003-0193-684X
DEMIS MIST
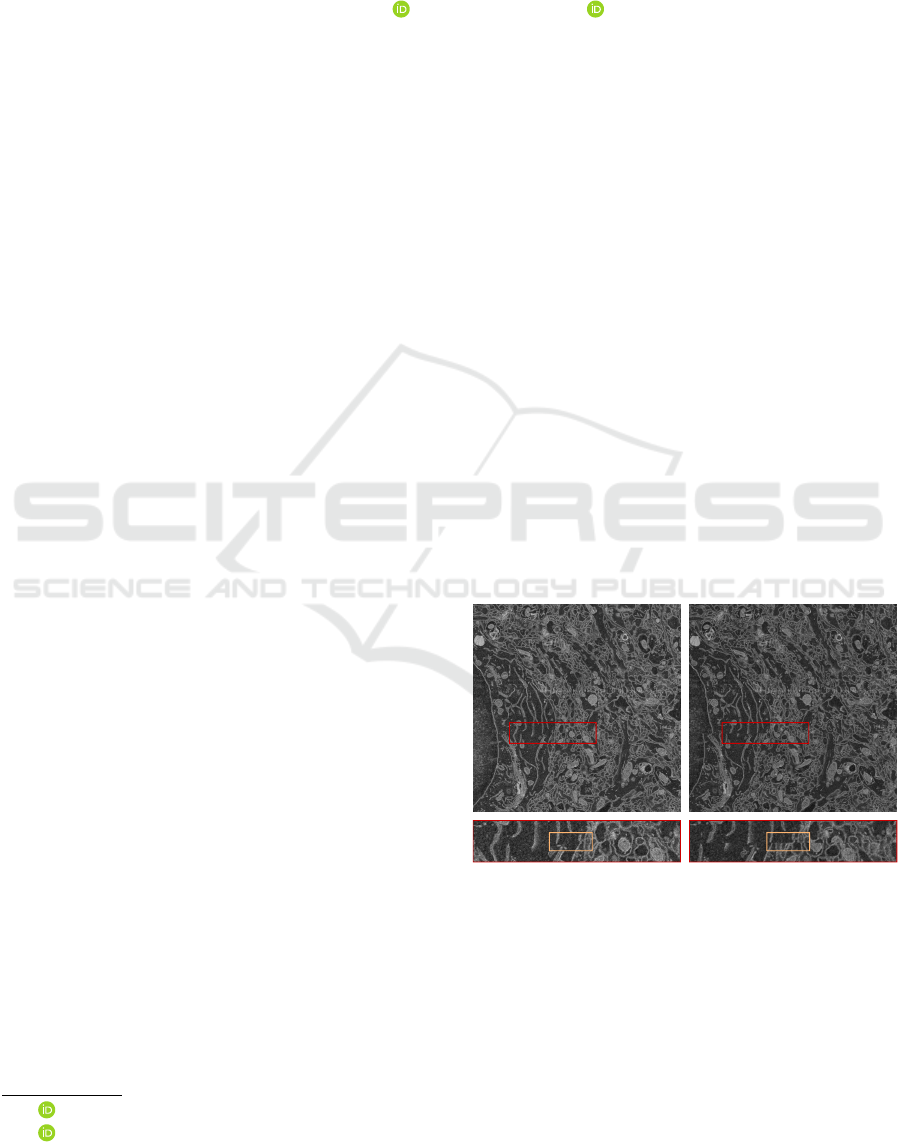
Figure 1: Stitching comparison of DEMIS and MIST (Chal-
foun et al., 2017) on real-world data. MIST produces sig-
nificantly more misalignments than DEMIS.
Current microscopy stitching methods split tile
stitching into two steps: (1) pairwise registration,
which estimates transformations between adjacent
tiles, and (2) global alignment, which minimises er-
ror propagation in the final composite image (Chal-
foun et al., 2017; Muhlich et al., 2022; Mahalingam
et al., 2022; Mohammadi et al., 2024b; Shi et al.,
2024). For pairwise registration, current approaches
Šilling, P. and Špan
ˇ
el, M.
DEMIS: Electron Microscopy Image Stitching Using Deep Learning Features and Global Optimisation.
DOI: 10.5220/0013314900003911
Paper published under CC license (CC BY-NC-ND 4.0)
In Proceedings of the 18th International Joint Conference on Biomedical Engineering Systems and Technologies (BIOSTEC 2025) - Volume 1, pages 255-265
ISBN: 978-989-758-731-3; ISSN: 2184-4305
Proceedings Copyright © 2025 by SCITEPRESS – Science and Technology Publications, Lda.
255

rely on traditional image registration techniques, such
as Normalised Cross-Correlation (Lewis, 1995) or
SIFT (Lowe, 2004). While these techniques produce
satisfactory results on most images, they may strug-
gle with highly repetitive or exceedingly low-quality
textures, which may lead to alignment errors. More-
over, current methods assume the movement of the
mechanical stage is precise enough to generate trans-
lational shifts only. Consequently, they limit the esti-
mated transformation parameters to translation. Since
other misalignments, such as slight rotational shifts,
might be present in some samples, the alignment er-
rors might be increased further. The intensity of these
errors should be minimised by the subsequent global
alignment stage. However, most current approaches
employ a Minimum Spanning Tree (MST) algorithm
or a comparable technique to select the set of pairwise
transformations that minimise the global error. Do-
ing so does not directly optimise the pairwise trans-
formations. As a result, the quality of the final image
remains limited by the accuracy of pairwise transfor-
mations. Figure 1 highlights the alignment errors pro-
duced by current methods on challenging input where
translation-only transformation estimation is not suf-
ficient.
Motivated by the above issues, we propose Deep
Electron Microscopy Image Stitching (DEMIS), a
novel approach to stitching electron microscopy im-
ages. Inspired by the recent advancements in feature
detection and matching using deep neural networks
(DeTone et al., 2018; Sarlin et al., 2020), we sug-
gest to use Local Feature TRansformer – LoFTR (Sun
et al., 2021) to detect feature matches in the pair-
wise registration stage. Additionally, we propose to
estimate both translational and rotational transforma-
tion parameters from the detected matches. DEMIS
does so by formulating a non-linear least squares op-
timisation problem, which estimates global tile poses
(positions and rotations) by minimising the total fea-
ture reprojection error. Since DEMIS optimises fea-
ture matches directly without first evaluating transfor-
mations between adjacent tiles, it avoids the limita-
tions of MST-based optimisation. The global poses
are used to create the final composite image.
To evaluate DEMIS and train LoFTR, we addi-
tionally propose EM424, a novel synthetic dataset
created from 424 public electron microcopy images
with high resolution. The dataset is generated by
randomly splitting the microscopy images into ar-
rays of overlapping image tiles and by applying ran-
dom noise and intensity changes. The dataset is
available as a part of this work. Furthermore, in-
spired by Electron Microscopy Stitched Image Qual-
ity Assessment – EMSIQA (Shi et al., 2024), we pro-
pose Optical Flow Stitched Image Quality Assess-
ment (OFSIQA), a no-reference stitching evaluation
metric based on the magnitude of optical flow in the
overlapping regions of adjacent image tiles.
We evaluate DEMIS and OFSIQA on the syn-
thetic dataset and we use OFSIQA to further eval-
uate DEMIS on a challenging real-world biological
dataset provided by the company TESCAN 3DIM
1
.
The experiments show that DEMIS outperforms the
current state-of-the-art solutions, such as Microscopy
Image Stitching Tool – MIST (Chalfoun et al., 2017),
on both feature matching accuracy and final image
output quality on multiple quality assessment metrics.
The experiments also demonstrate a positive impact
of rotational parameter estimation on stitching accu-
racy.
To summarise, the main contributions of this pa-
per are as follows:
• We introduce DEMIS, a novel electron mi-
croscopy image stitching method based on
LoFTR and least squares global optimisation of
translational and rotational transformation param-
eters. We show that DEMIS outperforms current
state-of-the-art solutions, especially on real-world
data.
• We prepare EM424, a novel synthetic image
stitching dataset generated from 424 publicly
available high-quality electron microscopy im-
ages. Compared to current microscopy datasets,
EM424 includes reference transformations, which
enable precise stitching evaluation.
• We propose OFSIQA, a no-reference image
stitching quality assessment metric based on the
magnitude of optical flow. We estimate the opti-
cal flow using the RAFT network (Teed and Deng,
2020).
2 RELATED WORK
Image Registration and Matching. Tradition-
ally, image registration methods can be divided
into intensity-based and feature-based approaches.
Intensity-based methods, most notably Normalised
Cross-Correlation (Lewis, 1995) and Phase Correla-
tion (Kuglin and Hines, 1975), work by finding cor-
relations in intensity between the registered images.
Feature-based registration methods detect sparse sets
of features in each registered image. The features are
then matched and used to estimate registration param-
eters. The first widely adopted feature descriptor was
1
https://www.tescan3dim.com/
BIOIMAGING 2025 - 12th International Conference on Bioimaging
256

SIFT (Lowe, 2004). Other feature descriptors, such as
SURF (Bay et al., 2006), ORB (Rublee et al., 2011),
and KAZE (Alcantarilla et al., 2012), tried to enhance
the speed or accuracy of SIFT. Despite that, SIFT ar-
guably remained the golden standard for feature de-
tection in terms of accuracy.
Recently, deep learning approaches have started
to improve on the traditional techniques. The pi-
oneering work in this area is SuperPoint (DeTone
et al., 2018), which presents a fully convolutional
feature extraction network that outperforms conven-
tional techniques, especially on noisy images and un-
der large illumination changes. SuperPoint is fur-
ther improved by SuperGlue (Sarlin et al., 2020),
which uses a graph neural network to find corre-
spondences between the detected features. The con-
cepts from SuperPoint and SuperGlue are then effec-
tively combined to form LoFTR (Sun et al., 2021), an
attention-based feature detection and matching net-
work. LoFTR further improves feature matching per-
formance, especially on areas with less texture or
repetitive patterns. Current works focus on improv-
ing LoFTR. In particular, ASpanFormer (Chen et al.,
2022) introduces attention spans with sizes that adapt
to global and local context characteristics. Match-
Former (Wang et al., 2023) better leverages the en-
coder using a novel hierarchical architecture with in-
terleaving self-attention and cross-attention. Finally,
AdaMatcher (Huang et al., 2023) addresses the in-
consistencies caused by the mutual nearest neighbour
matching criterion.
Microscopy Image Stitching. One of the first
tools for stitching electron microscopy images was
TrakEM2 (Cardona et al., 2012), an ImageJ (Schnei-
der et al., 2012) plugin that features a SIFT-based im-
age stitching algorithm. A more recent tool, MIST
(Chalfoun et al., 2017), employed Normalised Cross-
Correlation to compute image registrations. Addi-
tionally, MIST estimated the parameters of the me-
chanical stage and constructed a Minimum Spanning
Tree (MST) to minimise global errors. By doing
so, MIST achieved state-of-the-art performance. Li
and Ding then proposed a stitching technique based
on SURF features and PCA dimensionality reduc-
tion (Li and Ding, 2018; Jolliffe, 2002). Evalua-
tion on ceramic microscopy images displayed slightly
better performance than traditional SIFT-based stitch-
ing. Mahalingam et al. introduced a highly-scalable
pipeline for stitching microscopy datasets composed
of up to petabytes of data (Mahalingam et al., 2022).
The pipeline uses SIFT feature detection aided by
lens distortion estimation. Furthermore, Muhlich et
al. presented a registration method for multiplexed
images based on Phase Correlation and MST con-
struction (Muhlich et al., 2022). Zhao et al. pro-
posed a smoothing strategy that gradually transforms
general perspective transformations applied to over-
lapping regions of stitched tiles to linear-only trans-
formations applied to non-overlapping areas (Zhao
et al., 2023). Fast and Robust Microscopic Im-
age Stitching – FRMIS (Mohammadi et al., 2024b)
then improved the speed of tile registration by pri-
marily detecting SURF features in only small seg-
ments of the overlapping regions. Finally, a two-
stage error-correcting pipeline was introduced, which
showed accuracy comparable to other feature-based
approaches at a significant increase in speed (Shi
et al., 2024). Deep learning approaches to microscopy
image stitching remain largely unexplored, with only
a recent study (Mohammadi et al., 2024a) evaluating
SuperPoint features and reporting mixed results.
Microscopy Image Stitching Datasets. In electron
microscopy, stitching can generally be considered a
preprocessing step that is necessary for further data
analysis and biological research. The majority of
public microscopy datasets, such as the MICrONS
mouse visual cortex dataset (The MICrONS Con-
sortium et al., 2021), are therefore composed of al-
ready stitched images or are tailored to other image
processing tasks, such as image segmentation (Con-
rad and Narayan, 2021). A single stitching-related
dataset was created for the evaluation of MIST (Chal-
foun et al., 2017). The dataset includes scans of
stem colonies at various stages of growth and with
known colony centroid positions. The centroid po-
sitions can then be used to measure stitching error.
However, the centroid errors cannot evaluate the qual-
ity of individual transformations. Furthermore, the
dataset is rather domain-specific and contains only
simple translational shifts. In this paper, we introduce
EM424, a novel synthetic dataset that addresses these
shortcomings.
Microscopy Stitching Quality Assessment. Mi-
croscopy image stitching datasets are generally pri-
vate and without ground-truth annotations. Conse-
quently, the use of conventional reference-based im-
age quality assessment metrics, such as PSNR and
SSIM (Zhou et al., 2004), is challenging. As a result,
the quality of stitched microscopy images is com-
monly measured by (a) a qualitative analysis of the
final output and stitching errors, (b) feature detection
statistics, such as total feature and outlier counts, or
(c) no-reference image quality metrics. Shi et al. re-
cently introduced EMSIQA, a no-reference stitching
quality metric designed specifically for microscopy
DEMIS: Electron Microscopy Image Stitching Using Deep Learning Features and Global Optimisation
257
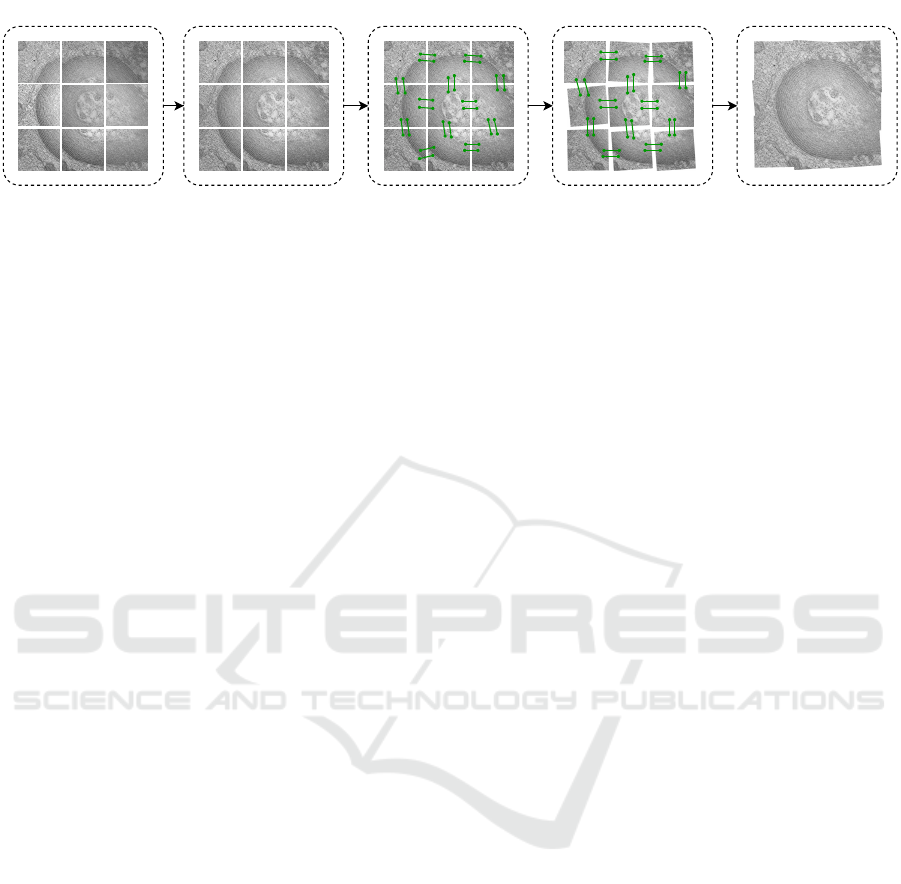
1. Raw input tiles 2. Normalisation 3. Pairwise matching 4. Global optimisation 5. Grid stitching
Figure 2: Overview of the stitching pipeline used by DEMIS. First, the brightness and contrast of raw input images are
normalised. Second, for each pair of adjacent images, features are detected and matched by LoFTR (Sun et al., 2021).
Subsequently, a least squares model of the stitched grid is constructed based on the expected grid structure and the detected
feature matches. In the model, each image is represented by its pose and related to adjacent images by the corresponding
matches. The modelled poses are optimised globally using the Levenberg-Marquardt algorithm (Marquardt, 1963). Finally,
the grid is stitched by gradually drawing individual image tiles transformed according to the optimised poses. The image tiles
were acquired from a scan of cytoplasmic multilamellar structures (Beyer et al., 2009).
images (Shi et al., 2024). EMSIQA is designed
around optical flow weighted by binary masks pro-
duced by OTSU thresholding (Otsu, 1979). In this pa-
per, we propose OFSIQA, a modified version of EM-
SIQA, which we use for evaluation on data with no
reference transformations.
3 PROPOSED STITCHING
METHOD
We introduce the proposed method in three steps.
First, we present a pairwise feature matching ap-
proach for grids of overlapping image tiles based on
LoFTR. Second, we formulate a least squares optimi-
sation problem to obtain globally optimal tile trans-
formations from pairwise feature matches. Finally,
we define OFSIQA using optical flow measurements.
The first two steps form the foundation of DEMIS and
are outlined in Figure 2.
3.1 Pairwise Feature Matching
Let G be the grid of overlapping electron microscopy
images with an expected overlap ratio o ∈ (0, 1). We
find feature matches between all pairs of adjacent tiles
in G in the following way.
First, the raw image tiles are normalised to en-
sure that any brightness and contrast inconsistencies
caused by the sequential nature of Whole Slide Imag-
ing do not negatively affect feature detection and
matching or the visual aspects of the final stitched im-
age. Contrast-Limited Adaptive Histogram Equalisa-
tion (Pizer et al., 1987) is used to perform the nor-
malisation. An adaptive normalisation method is nec-
essary since the content in different parts of electron
microscopy images can vary considerably.
Subsequently, for all pairs of adjacent tiles (I
1
, I
2
)
in G, I
1
and I
2
are cropped by the overlap ratio o, pro-
ducing cropped images I
′
1
and I
′
2
. I
′
1
and I
′
2
contain
the expected overlapping regions of I
1
and I
2
, respec-
tively. The direction from which to crop can be deter-
mined from the relative positions of both images. The
cropping significantly reduces the amounts of compu-
tation time and memory required for feature match-
ing.
Finally, LoFTR is used to detect and match fea-
tures between all pairs of cropped images I
′
1
and I
′
2
.
The positions of the matches are corrected to fit the
original images I
1
and I
2
by reversing the cropping
operation. We assume the tiles have a sufficiently
large overlap for LoFTR to produce a valid result.
From our empirical observations, a 10% overlap is
generally acceptable. However, the specific require-
ment depends considerably on the quality and resolu-
tion of the processed images.
In traditional stitching pipelines, the detected
matches are most commonly used to directly estimate
the transformation matrix that relates I
1
to I
2
, e.g.,
using Random Sample Consensus – RANSAC (Fis-
chler and Bolles, 1981). The transformation estimates
from all image pairs could then be optimised globally.
However, doing so could discard potentially valuable
information tied to individual feature matches. There-
fore, we propose to run the optimisation on the level
of features instead of transformations, as described in
detail in the following section.
3.2 Global Optimisation and Alignment
To avoid the limitations of transformation-based op-
timisation, we solve global alignment by formulating
a non-linear least squares optimisation problem at the
level of individual feature matches. We build a model
where each image tile in G is represented by its pose,
i.e., its position and rotation angle. The initial posi-
tion estimates are set based on tile resolution and the
BIOIMAGING 2025 - 12th International Conference on Bioimaging
258
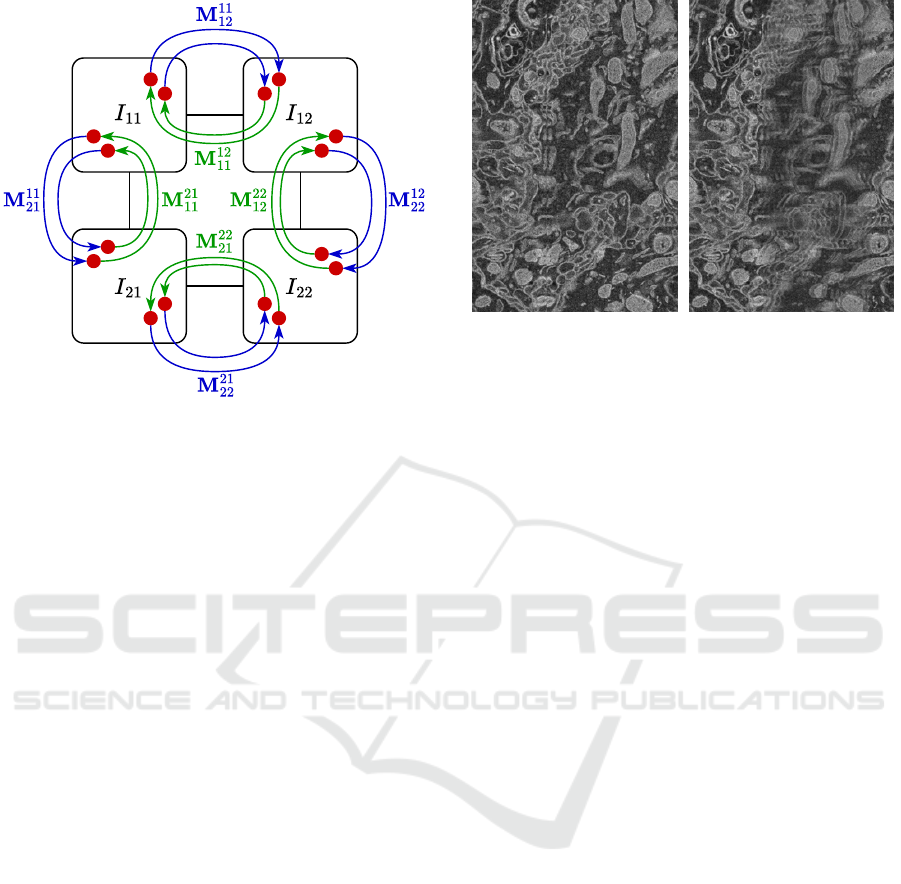
Figure 3: Graphical representation of the proposed global
optimisation model on a sample 2 × 2 image grid. Each
image in the model is represented by three pose parameters
and is connected to adjacent images by the corresponding
feature matches.
expected overlap o. In particular, for tile I
rc
at a row-
major grid index (r, c), its initial position parameters
p
x
rc
and p
y
rc
are calculated as
p
x
rc
= (1 − o) · w · (c − 1),
p
y
rc
= (1 − o) · h · (r − 1),
(1)
where w and h are the width and height of the images
in G. The initial angles α
rc
are set to zero. In other
words, the initial poses correspond to the ideal case
scenario, in which no misalignments between tiles ex-
ist and the expected overlaps are correct.
Let us denote the column matrix of features
matched from a source image I
rc
to a target image I
i j
in homogenous coordinates as M
rc
i j
. We minimise the
total feature reprojection error, i.e., the distance be-
tween matched features after projection to the global
coordinate space. To do so, we first transform all
matched features according to the current pose param-
eters of their source image tile. For M
rc
i j
, this yields
its transformed matrix
ˆ
M
rc
i j
as
ˆ
M
rc
i j
=
cosα
rc
− sin α
rc
p
x
rc
sinα
rc
cosα
rc
p
y
rc
0 0 1
M
rc
i j
. (2)
We then measure the reprojection error E
rep
as the
sum of squared differences between
ˆ
M
rc
i j
and its oppo-
site
ˆ
M
i j
rc
for all pairs of adjacent image tiles (I
rc
, I
i j
).
Each of the differences is weighted by the correspond-
ing match confidence score assigned by LoFTR. The
relationship between image tiles and feature matrices
is illustrated in Figure 3.
(a) Pixel replacement (b) Pixel averaging
Figure 4: Comparison of pixel replacement and pixel aver-
aging on a stitched pair of image tiles with misalignment
errors. Noticeable blurring can be seen when pixel averag-
ing is used.
We optimise E
rep
with respect to tile pose parame-
ters using the Levenberg-Marquardt algorithm (Mar-
quardt, 1963). During the optimisation, the parame-
ters of the first tile, i.e., p
x
11
, p
y
11
and α
11
, are locked
to their initial values to ensure that the final stitched
image has a predictable structure. The globally op-
timised parameters are then used to warp the corre-
sponding image tiles in G, and the final composite im-
age is constructed from the warped images. To avoid
blurring in case of misalignments, any already filled
pixels in the overlapping regions of multiple image
tiles are simply replaced by the pixels of subsequently
processed images without any form of pixel averag-
ing. Figure 4 illustrates the difference in blurring be-
tween pixel replacement and pixel averaging.
3.3 Measuring Stitching Quality Using
Optical Flow
We design the proposed OFSIQA metric as a modi-
fied version of EMSIQA (Shi et al., 2024), a recent
no-reference stitching quality metric for biomedical
electron microscopy images. We first introduce the
fundamental concepts of EMSIQA, and then present
our modifications.
Similarly to the pairwise matching algorithm, let
I
1
and I
2
be two registered images and I
′
1
and I
′
2
their
cropped overlapping regions. EMSIQA of I
1
and I
2
is
then evaluated in three main steps. First, optical flow
between I
′
1
and I
′
2
is estimated with FlowNet2 (Ilg
et al., 2017). Afterwards, OTSU thresholding (Otsu,
1979) is applied to create binary segmentation masks
of I
′
1
and I
′
2
. The segmentation masks are used to mask
empty regions with no organelles in the predicted op-
DEMIS: Electron Microscopy Image Stitching Using Deep Learning Features and Global Optimisation
259

tical flow, accentuating organelle edges. Finally, EM-
SIQA is calculated as the average magnitude of the
masked optical flow vectors normalised by the Dice
coefficient (Dice, 1945) of the segmentation masks.
While the above process results in a functional
stitching metric, it can be significantly simplified.
EMSIQA attempts to use OTSU thresholding to focus
its calculations more on edges and less on background
noise. However, as shown in Figure 5, OTSU thresh-
olding is unreliable for edge emphasis since it is not
an edge nor a ridge detection method but a method
for separating the foreground from the background.
As such, it may fail to correctly highlight the biologi-
cal structure in the images. Additionally, we observed
that even masking noisy image regions using proper
ridge detection techniques has little effect on metric
quality since modern optical flow estimators are ca-
pable of robust motion interpolation.
Considering the above issue, we eliminate the
OTSU thresholding steps and calculate the average
magnitude of optical flow vectors directly from the
initial optical flow. Formally, we define the OFSIQA
of I
1
and I
2
as
OFSIQA(I
1
, I
2
) =
1
N
∑
(d
x
,d
y
)∈F
q
d
2
x
+ d
2
y
, (3)
where N is the number of pixels in the overlapping
region of I
1
and I
2
and F the set of all displacement
vectors (d
x
, d
y
) in the optical flow between I
′
1
and I
′
2
.
Furthermore, we propose to estimate optical
flow with RAFT (Teed and Deng, 2020) instead of
FlowNet2. Doing so provides two primary bene-
fits: (1) the architecture of RAFT is more robust
and results in higher accuracy and efficiency, and
(2) RAFT is easily accessible through torchvision
2
,
a widespread Python library for computer vision. We
believe both performance and ease-of-use are essen-
tial for quality metrics and their adoption. Figure 6
depicts the calculation steps of OFSIQA.
4 DATASETS
EM424. Since the majority of public microscopy
data is already in stitched form or contains no ref-
erence tile transformations, we prepare EM424, a
synthetic dataset created from high-quality and high-
resolution electron microscopy images publicly avail-
able on EMPIAR
3
or CIL
4
. A total of 424 individual
images (259 from EMPIAR, 165 from CIL) from 36
2
https://pytorch.org/vision/
3
https://www.ebi.ac.uk/empiar/
4
http://cellimagelibrary.org/
(a) Original image (b) OTSU thresholding
Figure 5: Example of inappropriate use of OTSU threshold-
ing (Otsu, 1979) on an image of a human neocortex (Ellis-
man et al., 1987) during the calculation of EMSIQA (Shi
et al., 2024). Since the input image has large contrast vari-
ance, the thresholded image fails to correctly highlight the
biological structure in the majority of the image. As a re-
sult, EMSIQA would focus more on background noise, not
the biological structure.
RAFT
Figure 6: Computation of the proposed OFSIQA metric.
The metric is calculated as the average magnitude of optical
flow vectors in the overlapping region. The optical flow is
estimated by RAFT (Teed and Deng, 2020).
different public projects were selected for the dataset.
Each of the selected images has a resolution of at least
2048 × 2048 pixels and the majority of its area filled
with a high-quality scan of the imaged sample instead
of background noise. The selected images include
scans of different kinds of human and animal tissue,
proteins, bacteria and viruses.
The images were then split into as many overlap-
ping image tiles of size 1024× 1024 pixels as the orig-
inal image resolution allowed. Each image tile was
generated as follows. First, the base tile position was
determined based on a uniformly selected overlap be-
BIOIMAGING 2025 - 12th International Conference on Bioimaging
260
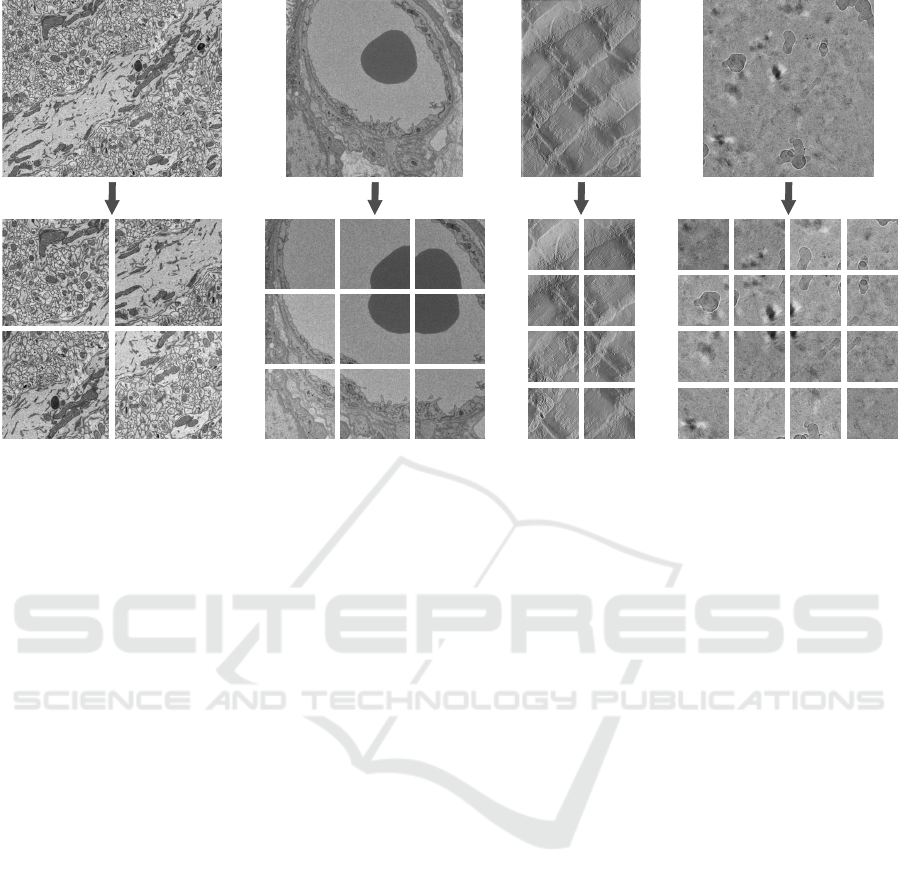
Figure 7: The splitting of image tiles for the EM424 dataset. The images are split into arrays of overlapping tiles 1024× 1024
pixels in size. The number of generated tiles depends on the resolution of the source image. The displayed source images
were retrieved from public microscopy datasets (Bushong and Deerinck, 2017; Lewis et al., 2022; Hoshijima et al., 2004;
Liang et al., 2022).
tween 17% and 23% of the tile resolution. Second,
the original image was rotated around the chosen tile
position by up to 5 degrees in either direction using a
uniformly selected random rotation angle. Then, the
tile was cropped from the rotated source image at its
calculated position. Finally, Gaussian noise and ran-
dom brightness and contrast changes were applied to
the tile to simulate scanning imperfections. Gaussian
distributions with zero means and variances of 25, 75,
and 0.0033, respectively, were used to generate the
parameters of these augmentations.
In total, the above process resulted in 8339 image
tiles separated into arrays of 4 to 162 images. 6282
of the tiles were selected for training, 751 for valida-
tion, and 1306 for evaluation. All tiles were labelled
by ground-truth tile positions and rotation angles to
enable reference reconstruction. The generation pro-
cedure and sample data are displayed in Figure 7.
Real-2x2. To demonstrate the viability of our so-
lution in real-world applications, we supplement our
synthetic dataset with Real-2x2, a dataset nominated
by TESCAN 3DIM as challenging for current stitch-
ing algorithms. The dataset contains 2 × 2 scans of a
single biological sample taken at 13 different slice po-
sitions (52 images in total). The tiles have a resolution
of 4096 × 3072 pixels and an average 15% tile over-
lap. Figure 1 shows a sample taken from the Real-2x2
dataset.
5 IMPLEMENTATION DETAILS
We implemented DEMIS in Python using PyTorch,
OpenCV, scikit-image and LMFIT. To limit any po-
tential side effects of transformations found in con-
ventional photography but not in electron microscopy,
such as perspective deformations, we also fine-tuned
the official outdoor weights of LoFTR on the train-
ing set of the EM424 dataset. The computational re-
sources for fine-tuning were provided by e-INFRA
CZ project (ID: 90140), supported by the Ministry of
Education, Youth and Sports of the Czech Republic.
We trained LoFTR for 8 epochs with the initial learn-
ing rate set to 1 × 10
−5
. The code is available online
under the MIT and Apache 2.0 licences.
6 EXPERIMENTS
To evaluate DEMIS, we compare its performance on
various feature detection and stitching quality met-
rics against several baseline solutions. We conduct
our experiments on the evaluation split of the EM424
dataset and on the Real-2x2 dataset. A machine with
a 20-core, 5.60 GHz Intel Core i7-14700K CPU, an
NVIDIA RTX 4090 GPU with 24 GB of memory, and
64 GB of RAM was used to run the experiments. The
metrics and baseline solutions are introduced below.
DEMIS: Electron Microscopy Image Stitching Using Deep Learning Features and Global Optimisation
261

Table 1: Stitching results on the synthetic EM424 dataset. DEMIS improves the results of conventional feature-based ap-
proaches in both feature quality and image quality metrics. Provided a system with a GPU is available, DEMIS does so at a
reasonable cost to stitching time.
Seconds Matches Reprojection error RMSE PSNR SSIM OFSIQA
SIFT 0.21 (CPU) 1000 2.86 20.73 21.97 0.69 1.21
ORB 0.07 (CPU) 289 4.18 20.70 21.98 0.69 1.22
DEMIS 0.27 (GPU) 1000 2.83 20.41 22.10 0.70 1.19
Feature Detection Metrics. For feature detection
evaluation, we report the mean number of matches de-
tected between adjacent tiles (limited to 1000 for per-
formance reasons). On the EM424 dataset, we also
report the mean feature reprojection error.
Image Stitching Metrics. For stitching evaluation,
we measure the mean amount of time to stitch one tile
in seconds and the mean RMSE, PSNR, SSIM (Zhou
et al., 2004) and OFSIQA of the stitched images. For
the Real-2x2 dataset, only time and OFSIQA are re-
ported due to the absence of reference images.
Baseline Solutions. We compare DEMIS against
four baseline solutions:
• SIFT: Our Python implementation of a base-
line stitching solution inspired by current state-
of-the-art feature-based microscopy stitching ap-
proaches, such as FRMIS (Mohammadi et al.,
2024b). It uses SIFT (Lowe, 2004) features
matched using Lowe’s ratio test, RANSAC (Fis-
chler and Bolles, 1981) for the estimation of
translational and rotational tile transformation pa-
rameters, and Minimum Spanning Tree (MST)
construction for global alignment. The MST is
weighted by the number of feature matches and
their estimated quality.
• ORB: Same as the SIFT baseline. Uses ORB
(Rublee et al., 2011) features instead of SIFT.
• MIST: A state-of-the-art microscopy stitching
method based on Normalised Cross-Correlation
and MST construction (Chalfoun et al., 2017).
• DEMIS-TR: A modified version of DEMIS that
estimates only translation parameters.
The following sections describe the results of our
experiments.
6.1 Results on the EM424 Dataset
Since the EM424 dataset contains synthetically ro-
tated images, we only evaluate the solutions that are
capable of rotation estimation (i.e., SIFT, ORB, and
DEMIS). The results, displayed in Table 1, show that
both SIFT and DEMIS detect a high amount of feature
matches, with DEMIS achieving the lowest reprojec-
tion error. This suggests a greater overall robustness
of DEMIS compared to other methods. ORB, while
being significantly faster than both SIFT and DEMIS,
found a relatively low number of matches and re-
ported the highest reprojection error. Despite that,
ORB demonstrated similar stitching performance to
SIFT, as evidenced by the almost identical values of
RMSE, PSNR, SSIM and OFSIQA. We attribute this
result to the use of RANSAC, which has the ability to
filter out inaccurate matches. In this way, RANSAC
helps to eliminate the influence that the higher re-
projection errors have on the final output. DEMIS
achieves the best stitching quality based on all met-
rics, although the improvements are marginal. We
also highlight the similar behaviour of OFSIQA to
RMSE, PSNR and SSIM, indicating its reliability as
an image quality assessment metric.
6.2 Results on the Real-2x2 Dataset
The results on the Real-2x2 dataset are presented in
Table 2. The dataset proved to be more challenging
than EM424. This is evidenced by the much higher
values of OFSIQA and by the decrease of mean match
count. Despite that, DEMIS achieved considerably
better stitching accuracy than other methods, with
a 31% decrease in OFSIQA compared to ORB, the
best performing traditional method, and a significant
1408% decrease in OFSIQA compared to MIST, a
current state-of-the-art microscopy stitching solution.
Additionally, DEMIS managed to retain the 1000 av-
erage matches (the maximum limit), which further
demonstrates its robustness regardless of input data
complexity. This is a common trait of learning-based
approaches. Furthermore, while requiring a GPU,
DEMIS achieves similar speed compared to other
methods. Finally, the results suggest that translation
might not be sufficient for precise microscopy image
stitching. In particular, the translation-only DEMIS-
TR reports a 12% higher value of OFSIQA than stan-
dard DEMIS. Figure 8 highlights the differences in
the output of the evaluated methods.
In summary, the results demonstrate that DEMIS
BIOIMAGING 2025 - 12th International Conference on Bioimaging
262
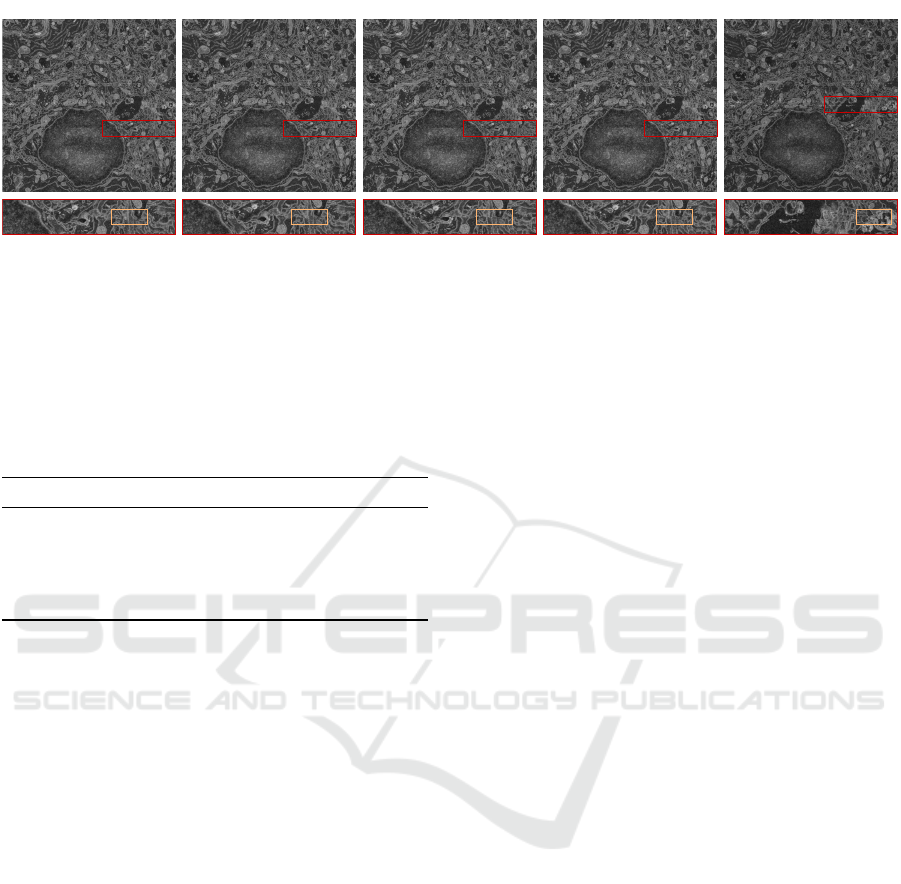
DEMIS DEMIS-TR SIFT ORB MIST
Figure 8: Comparison of the evaluated methods on an image from the Real-2x2 dataset. The seam between two stitched tiles
is highlighted in red. Note that the seam of MIST (Chalfoun et al., 2017) is at a different position since MIST failed to stitch
the image accurately. SIFT and ORB perform similarly and better than MIST. However, they produce significantly larger
misalignments than DEMIS. DEMIS outputs the best result, which is slightly less misaligned than the result of DEMIS-TR.
Table 2: Stitching results on the Real-2x2 dataset. DEMIS,
while being slower, achieves the best stitching quality by
a large margin, especially compared to the intensity-based
MIST. Estimating rotational parameters further improves
the results. T and R correspond to translation and rotation
estimation, respectively.
Type Seconds Matches OFSIQA
SIFT T & R 0.39 (CPU) 923 3.00
ORB T & R 0.18 (CPU) 94 2.98
MIST T only 0.45 (CPU) – 32.11
DEMIS-TR T only 0.29 (GPU) 1000 2.56
DEMIS T & R 0.29 (GPU) 1000 2.28
has higher stitching accuracy and robustness com-
pared to approaches based on traditional methods.
This is especially apparent as the complexity of the
processed dataset increases. However, the increase
in performance comes at the cost of requiring a sys-
tem equipped with a GPU. Nevertheless, provided a
system with a capable GPU is available, the speed of
DEMIS is comparable to other methods.
7 CONCLUSIONS
We propose DEMIS, a novel method for stitching
electron microscopy images based on LoFTR feature
matching and global least squares optimisation at the
level of individual features. Furthermore, we intro-
duce EM424, a synthetic dataset generated by split-
ting existing high-resolution electron microscopy im-
ages into grids of overlapping image tiles. We eval-
uate DEMIS on the EM424 dataset and real-world
data primarily using OFSIQA, a novel stitching qual-
ity metric based on optical flow. DEMIS performs
significantly better than current microscopy stitching
solutions, especially on real-world data. In particular,
it reduces the value of OFSIQA reported by MIST
from 32.11 to 2.28 (a 1408% improvement). We
also demonstrate that estimating rotational parame-
ters alongside translational parameters can further en-
hance stitching quality. Future work could investigate
deep learning approaches other than LoFTR and the
effects of estimating more complex transformations,
such as affine or radially distorted transformations.
Moreover, it could validate performance at different
amounts of tile overlap. A decrease in the necessary
overlap size could promote faster imaging.
ACKNOWLEDGEMENTS
We thank the company TESCAN 3DIM, our indus-
trial partner, for providing valuable data for the Real-
2x2 dataset.
REFERENCES
Alcantarilla, P. F., Bartoli, A., and Davison, A. J. (2012).
Kaze features. In Fitzgibbon, A., Lazebnik, S., Per-
ona, P., Sato, Y., and Schmid, C., editors, Computer
Vision – ECCV 2012, Lecture Notes in Computer
Science, pages 214–227, Berlin, Germany. Springer-
Verlag.
Bay, H., Tuytelaars, T., and Gool, L. V. (2006). Surf:
Speeded up robust features. In Leonardis, A., Bischof,
H., and Pinz, A., editors, Computer Vision – ECCV
2006, Lecture Notes in Computer Science, pages 404–
417, Berlin, Germany. Springer-Verlag.
Beyer, E., Sosinsky, G., Crum, J., Berthoud, V., Licht-
ensetin, A., and Geietta, G. (2009). The cell image
library: Homo sapiens, multi-lamellar structure, hela.
Dataset. CCDB:6348.
Bushong, E. and Deerinck, T. (2017). The cell image li-
brary: Mus, neuropil. Dataset. CCDB:8192.
Cardona, A., Saalfeld, S., Schindelin, J., Arganda-Carreras,
I., Preibisch, S., Longair, M., Tomancak, P., Harten-
stein, V., and Douglas, R. J. (2012). Trakem2 soft-
DEMIS: Electron Microscopy Image Stitching Using Deep Learning Features and Global Optimisation
263

ware for neural circuit reconstruction. PLOS ONE,
7(6):e38011.
Chalfoun, J., Majurski, M., Blattner, T., Bhadriraju, K.,
Keyrouz, W., Bajcsy, P., and Brady, M. (2017). Mist:
Accurate and scalable microscopy image stitching
tool with stage modeling and error minimization. Sci-
entific Reports, 7:4988.
Chen, H., Luo, Z., Zhou, L., Tian, Y., Zhen, M., Fang, T.,
McKinnon, D., Tsin, Y., and Quan, L. (2022). Aspan-
former: Detector-free image matching with adaptive
span transformer. In Avidan, S., Brostow, G., Ciss
´
e,
M., Giovanni, M., and Hassner, T., editors, Computer
Vision – ECCV 2022, Lecture Notes in Computer Sci-
ence, pages 20–36, Cham, Switzerland. Springer.
Conrad, R. and Narayan, K. (2021). Cem500k, a large-scale
heterogeneous unlabeled cellular electron microscopy
image dataset for deep learning. eLife, 10:e65894.
DeTone, D., Malisiewicz, T., and Rabinovich, A. (2018).
Superpoint: Self-supervised interest point detection
and description. In Conference on Computer Vision
and Pattern Recognition Workshops, CVPRW, pages
337–349, Salt Lake City, UT, USA. IEEE.
Dice, L. R. (1945). A threshold selection method from gray-
level histograms. Ecology, 26(3):297–302.
Ellisman, M., Ranganathan, R., Deerinck, T. J., Young,
S. J., Hessler, D., and Terry, R. D. (1987). The cell im-
age library: Homo sapiens, neocortex pyramidal cell.
Dataset. CCDB:6355.
Fischler, M. A. and Bolles, R. C. (1981). Random sample
consensus: A paradigm for model fitting with appli-
cations to image analysis and automated cartography.
Communications of the ACM, 24(6):381–395.
Hoshijima, M., Hayashi, T., Thor, A., Terada, M., Martone,
M., and Ellisman, M. (2004). The cell image library:
Mus musculus, t-tubules, sarcoplasmic reticulum, my-
ocyte. Dataset. CCDB:3603.
Huang, D., Chen, Y., Liu, Y., Liu, J., Xu, S., Wu, W., Ding,
Y., Tang, F., and Wang, C. (2023). Adaptive assign-
ment for geometry aware local feature matching. In
Conference on Computer Vision and Pattern Recog-
nition, CVPR, pages 5425–5434, Vancouver, Canada.
IEEE.
Ilg, E., Mayer, N., Saikia, T., Keuper, M., Dosovitskiy, A.,
and Brox, T. (2017). Flownet 2.0: Evolution of optical
flow estimation with deep networks. In Conference
on Computer Vision and Pattern Recognition, CVPR,
pages 1647–1655, Honolulu, HI, USA. IEEE.
Jolliffe, I. T. (2002). Principal Component Analysis.
Springer New York, New York, NY, USA, 2 edition.
Kuglin, C. and Hines, D. A. (1975). The phase correla-
tion image alignment method. In Proceedings of the
1975 IEEE International Conference on Cybernetics
and Society, pages 163–165, New York, NY, USA.
IEEE.
Lewis, J. P. (1995). Fast template matching. In Vision Inter-
face, pages 120–123, Quebec City, Canada. Canadian
Image Processing and Pattern Recognition Society.
Lewis, R. M., Baskaran, H., Green, J., Tashev, S., Pa-
leologou, E., Lofthouse, E. M., Cleal, J. K., Page,
A., Chatelet, D. S., Goggin, P., and Sengers, B. G.
(2022). EMPIAR: Sbf sem of human term placental
villi. Dataset. EMPIAR-10967.
Li, K. and Ding, G. (2018). A novel automatic image
stitching algorithm for ceramic microscopic images.
In International Conference on Audio, Language and
Image Processing, ICALIP, pages 17–21, Shanghai,
China. IEEE.
Liang, W. G., Wijaya, J., Wei, H., Noble, A. J., Mancl,
J. M., Mo, S., Lee, D., King, J. L., Pan, M., Liu, C.,
Koehler, C. M., Zhao, M., Potter, C. S., Carragher, B.,
Li, S., and Tang, W. J. (2022). EMPIAR: Structural
basis for the mechanisms of human presequence pro-
tease conformational switch and substrate recognition.
Dataset. EMPIAR-10937.
Lowe, D. G. (2004). Distinctive image features from scale-
invariant keypoints. International Journal of Com-
puter Vision, 60(2):91–110.
Mahalingam, G., Torres, R., Kapner, D., Trautman, E. T.,
Fliss, T., Seshamani, S., Perlman, E., Young, R., Kinn,
S., Buchanan, J., Takeno, M. M., Yin, W., Bumbarger,
D. J., Gwinn, R. P., Nyhus, J., Lein, E., Smith, S. J.,
Reid, R. C., Khairy, K. A., Saalfeld, S., Collman, F.,
and da Costa, N. M. (2022). A scalable and modu-
lar automated pipeline for stitching of large electron
microscopy datasets. eLife, 11:e76534.
Marquardt, D. W. (1963). An algorithm for least-squares
estimation of nonlinear parameters. Journal of
the Society for Industrial and Applied Mathematics,
11(2):431–441.
Mohammadi, F. S., Mohammadi, S. E., Adi, P. M.,
Mirkarimi, S. M. A., and Shabani, H. (2024a). A
comparative analysis of pairwise image stitching tech-
niques for microscopy images. Scientific Reports,
14:9215.
Mohammadi, F. S., Shabani, H., and Zarei, M. (2024b). Fast
and robust feature-based stitching algorithm for mi-
croscopic images. Scientific Reports, 14:13304.
Muhlich, J. L., Chen, Y.-A., Yapp, C., Russell, D., San-
tagata, S., and Sorger, P. K. (2022). Stitching and
registering highly multiplexed whole-slide images of
tissues and tumors using ashlar. Bioinformatics,
38:4613–4621.
Otsu, N. (1979). A threshold selection method from gray-
level histograms. IEEE Transactions on Systems,
Man, and Cybernetics, 9(1):62–66.
Pizer, S. M., Amburn, E. P., Austin, J. D., Cromartie, R.,
Geselowitz, A., Greer, T., ter Haar Romeny, B., Zim-
merman, J. B., and Zuiderveld, K. (1987). Adaptive
histogram equalization and its variations. Computer
Vision, Graphics, and Image Processing, 39(3):355–
368.
Rublee, E., Rabaud, V., Konolige, K., and Bradski, G.
(2011). Orb: An efficient alternative to sift or surf. In
International Conference on Computer Vision, ICCV,
pages 2564–2571, Barcelona, Spain. IEEE.
Sarlin, P.-E., DeTone, D., Malisiewicz, T., and Rabinovich,
A. (2020). Superglue: Learning feature matching with
graph neural networks. In Conference on Computer
Vision and Pattern Recognition, CVPR, pages 4937–
4946, Seattle, WA, USA. IEEE.
BIOIMAGING 2025 - 12th International Conference on Bioimaging
264

Schneider, C. A., Rasband, W. S., and Eliceiri, K. W.
(2012). Nih image to imagej: 25 years of image anal-
ysis. Nature Methods, 9:671–675.
Shi, J., Ge, H., Wang, S., Wei, D., Yang, J., Cheng, A.,
Schalek, R., Guo, J., Lichtman, J., Wang, L., and
Zhang, R. (2024). Two-stage error detection to im-
prove electron microscopy image mosaicking. Com-
puters in Biology and Medicine, 178:108456.
Sun, J., Shen, Z., Wang, Y., Bao, H., and Zhou, X.
(2021). Loftr: Detector-free local feature matching
with transformers. In Conference on Computer Vision
and Pattern Recognition, CVPR, pages 8918–8927,
Nashville, TN, USA. IEEE.
Teed, Z. and Deng, J. (2020). Raft: Recurrent all-pairs field
transforms for optical flow. In Vedaldi, A., Bischof,
H., Brox, T., and Frahm, J.-M., editors, Computer Vi-
sion – ECCV 2020, Lecture Notes in Computer Sci-
ence, pages 402–419, Cham, Switzerland. Springer.
The MICrONS Consortium, Bae, J. A., Baptiste, M.,
Bishop, C. A., Bodor, A. L., Brittain, D., Buchanan,
J., Bumbarger, D. J., Castro, M. A., Celii, B., Co-
bos, E., Collman, F., da Costa, N. M., Dorkenwald,
S., Elabbady, L., Fahey, P. G., Fliss, T., Froudarakis,
E., Gager, J., . . . , and Zhang, C. (2021). Functional
connectomics spanning multiple areas of mouse visual
cortex. Preprint.
Wang, Q., Zhang, J., Yang, K., Peng, K., and Stiefelha-
gen, R. (2023). Matchformer: Interleaving attention
in transformers for feature matching. In Wang, L.,
Gall, J., Chin, T.-J., Sato, I., and Chellappa, R., edi-
tors, Computer Vision – ACCV 2022, Lecture Notes in
Computer Science, pages 256–273, Cham, Switzer-
land. Springer.
Zhao, B., Zhang, K., Liu, P., and Chen, Y. (2023). Large-
scale time-lapse scanning electron microscopy image
mosaic using a smooth stitching strategy. Microscopy
Research and Technique, 86(8):929–942.
Zhou, W., Bovik, A. C., Sheikh, H. R., and Simoncelli, E. P.
(2004). Image quality assessment: from error visibil-
ity to structural similarity. IEEE Transactions on Im-
age Processing, 14(4):600–612.
DEMIS: Electron Microscopy Image Stitching Using Deep Learning Features and Global Optimisation
265
