
Enhanced YOLOv8 Framework for Early Detection of
Alzheimer's Disease Using MRI Scans
Safa Jraba
1a
, Mohamed Elleuch
2b
, Hela Ltifi
3c
and Monji Kherallah
4d
1
National School of Electronics and Telecommunications (ENETCom), University of Sfax, Tunisia
2
National School of Computer Science (ENSI), University of Manouba, Tunisia
3
Faculty of Sciences and Techniques of Sidi Bouzid, University of Kairouan, Tunisia
4
Faculty of Sciences, University of Sfax, Tunisia
Keywords: YOLO, Deep Learning, Early Diagnosis, MRI, Medical Imaging, Detection, Brain Imaging, YOLOv8.
Abstract: Alzheimer's disease is characterized by a progressive neurodegenerative disorder, often misdiagnosed too
late, with early symptoms that are hidden. Detection is crucial for effective treatment and slowing the
progression of disease. We propose an upgraded version of the YOLO (You Only Look Once) framework,
namely YOLOv8, for detecting Alzheimer's disease from MRI scans. Our approach seeks the detection of
early structural changes in the brain, most particularly in the hippocampus and cortex, which are also among
the first areas affected in this disease process. The framework performs state-of-the-art detection of
Alzheimer's changes with a 96% precision via multi-scale feature extraction specifically designed for
neuroimaging data. Results show this approach to be exceptionally effective in improving sensitivity and
precision over existing techniques, marking it as a highly reliable method for early diagnosis of Alzheimer's
disease.
1 INTRODUCTION
Alzheimer's disease (AD) is reportedly the most
common form of dementia, affecting millions across
the world. In order to control the disease, it is most
essential to diagnose it in an early stage for timely
intervention; however, subtle structural changes
within the brain caused by the disease, especially in
the early stages of Alzheimer's, are often missed by
traditional diagnostic techniques. This study
showcases an enhanced YOLO-based framework
developed for the early diagnosis of Alzheimer's
using MRI data with special emphasis on structural
brain abnormalities, with a view to providing
effective measures of hippocampal atrophy and
cortical thinning.
The automatic identification of brain tumors from
Magnetic Resonance Imaging (MRI) is a highly
challenging and labor-intensive task. Amine et al.
(2022).
a
https://orcid.org/0009-0007-7818-5091
b
https://orcid.org/0000-0003-4702-7692
c
https://orcid.org/0000-0003-3953-1135
d
https://orcid.org/0000-0002-4549-1005
Prompt detection of brain tumors is very
important for successful treatment outcomes and
better prognoses of the patients. Consequently, the
identification of brain tumors plays a vital role in
medical diagnostics. Magnetic Resonance Imaging
(MRI) is regarded as the best imaging technique for
visualizing the brain and detecting the tumors. The
You Only Look Once (YOLO) series have witnessed
promising results in accurately detecting brain
tumors. For instance. Kang et al. (2023), proposed
RCS-YOLO, a novel YOLO framework
incorporating reparameterized convolution with
channel shuffle specially proposed for brain tumor
detection, achieving a good trade-off between speed
and accuracy.
The modules Conv. King et al. (2023). C2f
(shortcut), and Spatial Pyramid Pooling Fast (SPPF)
make up the backbone, which is in charge of feature
extraction. The Conv and SPPF are comparable to
those found in the YOLOv5 architecture. Jocher et al.
Jraba, S., Elleuch, M., Ltifi, H. and Kherallah, M.
Enhanced YOLOv8 Framework for Early Detection of Alzheimer’s Disease Using MRI Scans.
DOI: 10.5220/0013315300003890
In Proceedings of the 17th International Conference on Agents and Artificial Intelligence (ICAART 2025) - Volume 3, pages 1229-1237
ISBN: 978-989-758-737-5; ISSN: 2184-433X
Copyright © 2025 by Paper published under CC license (CC BY-NC-ND 4.0)
1229

(2022). Conv is also known as ConvBiSiLU (or
CBS). Alongside C2f (shortcut), the Conv module
performs convolution operations on input pictures to
facilitate feature extraction, while SPPF permits an
adjustable output size. The C2f (shortcut)
convolutional structure is lighter than the C3 module
of YOLOv5. The head and the backbone are the two
main components of the YOLOv8 architecture Jocher
et al. (2023), with the neck being incorporated into
the head part. King et al. (2023).
Researchers and medical professionals can locate
the area of the brain afflicted by a tumor by using
MRI, an imaging method that shows the anatomy and
structure of the human brain Sakthidasan et al.
(2021).
2 RELATED WORKS
The search for precise detection methodologies for
cerebral tumors has sparked significant research
efforts in recent years. Numerous approaches have
been investigated to address this vital need in the field
of health. Conventional diagnostic modalities such as
magnetic resonance imaging (MRI) and computed
tomodensitometry (CT scans) have historically been
the primary tools used to identify brain tumors. Their
effectiveness in early detection and precise
delineation of terrorist borders, however, remains a
challenge.
The precise Accurate automated classification of
brain MRI images is crucial in medical research,
distinguishing healthy brain tissue from tumor-
affected areas (benign or malignant), as noted by
Gurbină and al. (2019).
CNN applied to MRI images has been shown to
be beneficial in many recent studies for the
classification of brain-related illnesses. Yuan et al.
(2018)
As such, these tasks are very prone to some
missed, misinterpreted, or wrong tumor-like
structures. Research currently aims mostly at the
classification and segmentation of tumors in MRI
scans, while the detection of tumors is relatively
underexplored. Although different CNNs have shown
very promising results in the field of brain tumor
detection, articles on the performance of You Only
Look Once (YOLO) networks in this regard are not
frequently published. Nevertheless, the architectures
of such networks are continuously becoming more
complex. Lather et al. (2020)
A thorough Waquas et al. (2020) provide a
comprehensive review of deep learning models for
brain tumor analysis, detailing datasets,
methodologies, evaluation standards, and current
detection approaches.
Amarapur et al. (2019) explored traditional
machine learning and deep learning methods for brain
tumor validation, using three algorithms to achieve
effective classification with improved accuracy and
robustness.
A high-level System Cancer Diagnosis by
coalescing the four Level-I taxonomy components
"DIV" Data, Image Segmentation processing and
VIEW is proposed in Lukampe al. (2019).
A novel deep learning framework driven by the
internet of health things (IoHT) for brain tumor
detection and tumor cell classification was presented
by the authors in Devunooru and al. (2021). Using the
common Pap smear Herlev dataset, the conventional
Machine Learning (ML) techniques—KNN, RF, NB,
LR, and SVM classifiers—are applied.
Archana et al. (2023) compared CNN optimizers
for brain tumor detection, finding AlexNet with
Adam achieved 94.76% accuracy on a dataset of 1547
images, outperforming LeNet with SGD.
Wani et al. (2023) explored brain tumor diagnosis
using MRI with CNNs like AlexNet, GoogleNet,
VGG-19, a bespoke model, and machine learning
models. Their hybrid approach achieved 90.625%
accuracy, highlighting the potential of combining
deep learning and traditional methods.
Rajinikanth et al. (2022) used pooling techniques
with pre-trained VGG16 and VGG19 CNNs to
classify glioma and glioblastoma from MRI images,
achieving 96.08% accuracy with average pooling and
VGG16. Modern developments, including YOLO
models for efficient object detection, will be reviewed
and compared to CNN performance.
Li and al. (2021) created the first YOLO as a real-
time object detector. The capacity to identify objects
with a single pass is the primary feature; each cell in
the grid-based image predicts possible object classes
and boxes. For real-time applications, Li’s initial
iteration of YOLO functioned as an object detector.
Kumar et al. (2020) presented YOLOv4 for
detecting brain tumors on a private local MRI
database. They achieved 90% accuracy and 88%
recall by employing several data augmentation
techniques and fine-tuning the YOLOv4 model.
Using YOLOv5 on Brain Anomalies: Chen et al.
(2022), on a private MRI dataset, used YOLOv5 for
the detection of small brain anomalies.Their model
achieved 92% accuracy and 90% recall, indicating
that YOLOv5 is most suitable for applications in
medicine, requiring highly precise detection.
An enhanced version of YOLOv5 for early
detection of AD was attempted by Park et al. (2023)
ICAART 2025 - 17th International Conference on Agents and Artificial Intelligence
1230
using BRATS 2020 data. In this study, the model
modified to accommodate accurate segmentation
yielded 93% accuracy and an F1 score of 0.92 for
brain-region detection in AD.
The YOLOv7 model was trained by Singh et al.
(2023) on the AMNI and BRATS 2019 datasets-they
employed transfer learning to make use of large
medical imaging databases. The model yielded an
accuracy and recall of 94% and 93% respectively.
Consequently, Zhao et al. (2021) investigated the
use of ResNet for bilateral brain abnormality
identification using the BRATS database, and they
were able to detect tumors with an MRI image
classification accuracy of 87%.
As far as themselves, that created opportunities
for Zhao et al. (2021) research into using ResNet to
identify bilateral brain abnormalities with the use of
the BRATS database. Using MRI image
classification, 87% classification accuracy was
attained for tumor recognition.
In this section, we look closely at a few recently
published, more successful techniques (See Table 1).
Table 1: Research on the detection of brain tumors with
YOLO.
Authors YOLO Model Dataset Acc.
Li et al.
(2021)
YOLOv3 with
attention layers for
important regions
important regions
BRATS 2018 88%
Kumar
et al.
(2020)
YOLOv4
University Hospital
(local data)
YOLOv4
optimized by
MRI data
augmentation
90%
Chen et
al.
(2022)
YOLOv5 with
multiscale
detection for small
tumors
Private MRI
Dataset
92%
Park et
al.
(2023)
Enhanced
YOLOv5
with segmentation
and detection
tuning
BRATS 2020 93%
Singh et
al.
(2023)
YOLOv7 with
transfer learning
and normalization
ADNI &
BRATS 2019
94%
Zhao et
al.
(2021)
YOLOv3-tiny for
optimized real-time
detection
Open Access
Dataset
80%
A summary of recent research on brain tumor
detection utilizing several YOLO models may be
found in Table 1. This table shows how the YOLO
architecture has been improved and refined for the
purpose of detecting brain tumors in MRI scans, as
well as how accuracy has increased across various
YOLO iterations and configurations.
3 METHODOLOGIES
This section provides an overview of the
experimental flow for developing Alzheimer's
disease-motivated experiments.
3.1 Gathering Data
The Alzheimer Disease Neuroimaging Initiative is an
internationally recognized Alzheimer's disease
research database.
The characteristics of the YOLOv8 model
facilitate easy training, validation, and evaluation
because there are three separate datasets for training,
validation, and testing.
Folder Structure: The dataset includes three main
folders: train, valid, and test, each containing
subfolders for images and labels, formatted for
YOLOv8 compatibility in real-time object recognition.
MRI Images: The dataset includes MRI slices of
brain regions, aiding in visual recognition of tumor-
related characteristics and abnormalities. It features
an example image highlighting colorful brain regions
with distinct textures indicative of potential
pathologies.
Annotations: Each image is paired with a .txt file
containing annotations in YOLOv8 format, indicating
the class (0 for "normal," 1 for "tumor," 2 for other
anomalies) and the bounding box's normalized
coordinates and dimensions (0 to 1), centered on the
areas of interest.
There are three primary classes defined:
Images: that provide no outward indications of
abnormalities are considered normal (class 0).
Tumor (Class 1): Pictures that clearly display
brain tumors.
Possible Anomaly (Class 2): Pictures with
obvious symptoms that call for medical attention
if an abnormality diagnosis is necessary.
Table 2: MRI Image categorization for the Detection of
Brain Variations.
Class
ID
Class
Name
Description
0 Normal
Images with no visible indications
of abnormalities.
1 Tumor
Images that clearly display brain
tumors.
2
Possible
Anomaly
Images showing symptoms that
suggest a possible abnormality,
re
q
uirin
g
medical attention.
Enhanced YOLOv8 Framework for Early Detection of Alzheimer’s Disease Using MRI Scans
1231
The three primary classifications established for
the classification of brain MRI images are
summarized in this table.
3.2 Pre-Processing
Our brain tumor MRI dataset underwent a number of
pre-processing procedures to guarantee data
consistency and quality. In order to fully utilize the
features in the image, the data was kept as raw as
possible and no augmentation was made. The image's
640x640 pixel size makes sense considering the
trade-off between detection precision and time-
constraint compliance.
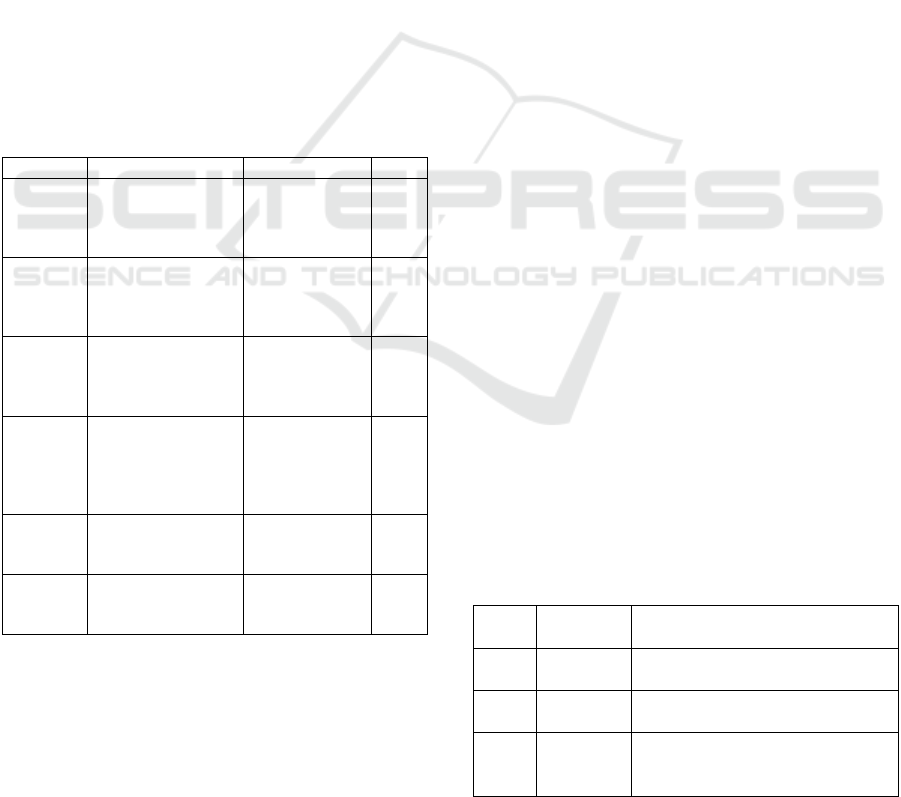
Figure 1: Sample MRI Images from Brain Tumor Detection
Dataset.
The six sample MRI images displayed in figure 1
are from the dataset used for brain tumor detection.
These images illustrate the diversity of the brain
tumor cases to be analyzed by the YOLOv8
framework. The dataset provides the basis for training
and testing the detector on variations in structure and
potential tumor locations when identifying and
localizing brain tumors.
3.3 Proposed Architectures
3.3.1 YOLO v8 Architecture
The YOLO series, a well-liked one-stage detection
algorithm, is very good at object detection tasks
because it strikes a compromise between speed and
accuracy. A C2f is adopted by YOLOV8.
It streamlines the procedure and speeds up
detection by separating the classification and
detection heads using an Anchor Free head. Luo et al.
(2023).
Figure 2 describes the framework of the YOLOv8
model in its adaption for Alzheimer's disease
detection altered by MRI scans. Three main
categories: Backbone, Neck, and Output can be used
to categorize the model's structure.
Figure 2: YOLO v8 architecture.
3.3.2 Backbone
The features of the input MRI image are extracted by
the backbone. It begins with convolutional layers
(Conv) and moves on to more complex layers like C2f
and Fast_C2f layers, which aim to improve the
feature extraction process by preserving the spatial
information crucial for identifying Alzheimer's
markers. An input image has been resized 640x640
pixels along with the three colors channels
(640x640x3) so that all of the model's architecture
can be executed uniformly.
Elharrouss et al. (2022) examines diverse
backbone architectures and their evolution, as well as
their applicability in the extraction of features for
intricate deep learning problems.
3.3.3 Neck
Features taken from various Backbone levels are
further refined and combined by the AFPN
(Augmented Feature Pyramid Network) layer, which
is located in the Neck.
Al-Nawashi et al. (2023) examines how the
addition of multi-scale feature fusion modules,
similar to AFPN, can improve contextual
understanding of spatial relationships in MRI images,
enhancing the model's ability to detect subtle signs of
Alzheimer's disease.
3.3.4 Output
To enable multi-scale detection, the output layer is
made up of three detection heads (P3, P4, and P5) that
are stacked to feature maps of varying sizes (80x80,
40x40, and 20x20). Chen et al. (2024).
Two modules further process them: Cls
classification based on BCE (Binary Cross-Entropy)
loss, which maximizes accuracy in detecting
Alzheimer's disease, and Bbox for bounding box
predictions using metrics like CIoU (Complete
Intersection over Union) and DFL (Distribution Focal
Loss) for spatial accuracy. Luo et al. (2024).
ICAART 2025 - 17th International Conference on Agents and Artificial Intelligence
1232

4 EXPERIMENTS AND RESULTS
In the present study, we present an advanced model
based on the YOLOv8 architecture for the early
detection of Alzheimer's disease using MRI images.
The experimental protocol is organized to evaluate
the ability of the YOLOv8 model to accurately detect
Alzheimer's disease markers in MRI images.
This network architecture has been trained and
tested on a dataset of MRI scans, resized to 640x640
pixels over three color channels. The YOLOv8
backbone efficiently extracts essential features from
MRI images, while its multi-scale feature detection
capabilities guarantee robust identification of subtle
and pronounced markers.
The enhanced system integrates AFPN
(Augmented Feature Pyramid Network) for enhanced
contextual awareness, and uses detection heads (P3,
P4 and P5) to predict boundary areas and classify
regions of interest at different resolutions (80x80,
40x40 and 20x20). Measures such as CIoU
(Complete Intersection over Union) and DFL
(Distribution Focal Loss) were used to improve
boundary zone predictions, enabling accurate
localization and classification.
Binary cross-entropy loss (BCE) was employed
for classification work to maximize the accuracy of
Alzheimer's disease detection, enabling the model to
differentiate between healthy and pathological states.
Furthermore, in order to actually carry out the
study, a phase of analysis and discussion of the
experiment's parameters is required (See Table 3).
Table 3: Parameters of YOLO v8 Model.
Total paras
3,235,856
Trainable paras
3,193,472
Non-trainable params
42,384
We employed the YOLOv8 architecture for
feature extraction and early Alzheimer's diagnosis
from MRI scans. As shown in Table 3, the YOLOv8
model comprises 3,235,856 parameters, of which
3,193,472 are trainable and 42,384 are non-trainable,
located in convolutional layers and detection heads.
The YOLOv8 variant was selected for its balance
between speed and accuracy and fine-tuned on the
Alzheimer’s dataset with a batch size of 16, a cosine-
annealed learning rate, and 30 epochs for
convergence.
4.1 Dataset
The YOLOv8 model requires a dataset with
Alzheimer’s detection features. We curated MRI
images from reputable sources to classify and detect
Alzheimer’s using spatial and texture data.
Organization of the Dataset: The dataset includes
three labels corresponding to distinct brain tumor
classifications:
Label0: Accommodates healthy brain MRIs.
Label1: Shows brain MRIs showing early
indications of Alzheimer's disease.
Label2: Contains MRIs demonstrating advanced
Alzheimer's disease symptoms.
Each category is represented in the training,
validation, and test sets to ensure reliable training and
evaluation.
Three subsets of the dataset are separated out:
Training Set: 80% for model training.
Validation Set: 10% for fitting and
optimization.
Test Set: 10% for evaluating model
generalization.
Images are scaled to 640x640 pixels with RGB
channels, with directories for training, validation,
testing, and a configuration data.yaml file.
4.2 Main Performance Indicators
Model performance is evaluated using the following
metrics: Precision, Recall, mAP50 (Mean Average
Precision @ 50 IoU), mAP50-95, and IoU
(Intersection over Union)
4.3 Curves of Evaluation
Several curves illustrate the relationship between
metrics and confidence thresholds:
The Precision-Recall Curve (Precision-Recall)
shows the relationship between precision and recall at
varying confidence levels.
The F1 Score (F1-Confidence) displays the F1 score
as a function of confidence.
The Precision-Confidence Curve (Precision-
Confidence) tracks precision changes across
confidence thresholds.
The Recall-Confidence Curve (Recall-Confidence)
highlights how recall varies with confidence levels.
4.4 Results and Discussion
The YOLOv8 model was used to detect brain tumors,
focusing on its accuracy in classifying and localizing
glioma, meningioma, and pituitary tumors, evaluated
using sophisticated object identification metrics
mAP@50 and mAP@50-95.
Enhanced YOLOv8 Framework for Early Detection of Alzheimer’s Disease Using MRI Scans
1233
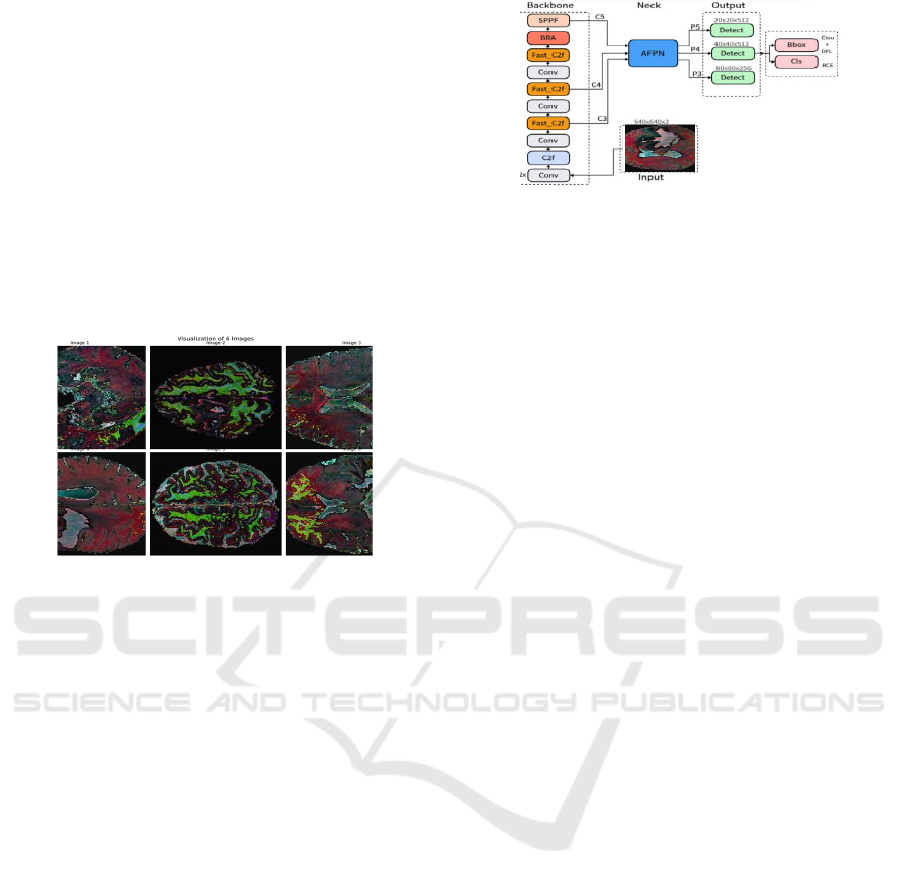
4.4.1 Confusion Matrix Normalized
Figure 3: Confusion matrices using YOLOv8.
The normalized confusion matrix produced by the
YOLOv8 model's performance on the classification
test is displayed in figure 3. The following important
points are highlighted in the matrix:
True Positive Rate (Diagonal values):
The diagonal elements show classification accuracy
for each class: 0.42 for label0, 0.78 for label1, and
0.51 for label2. Label1 has the highest accuracy
(0.78), while label0 performs the worst (0.42).
False Predictions: (Off-Diagonal Values):
Classification errors are shown by off-diagonal
elements. For example, a large portion of label0 is
misclassified as "background" (0.48). Label2 is
sometimes mistaken for "background" (0.32) or
label0 (0.08).
Background Confusion:
Nearly 49% of label0 predictions were incorrectly
classified as background, indicating a significant
prevalence of confusion in the background class.
Color Intensity:
Higher values are shown by darker colors, which
show the percentage of classifications.
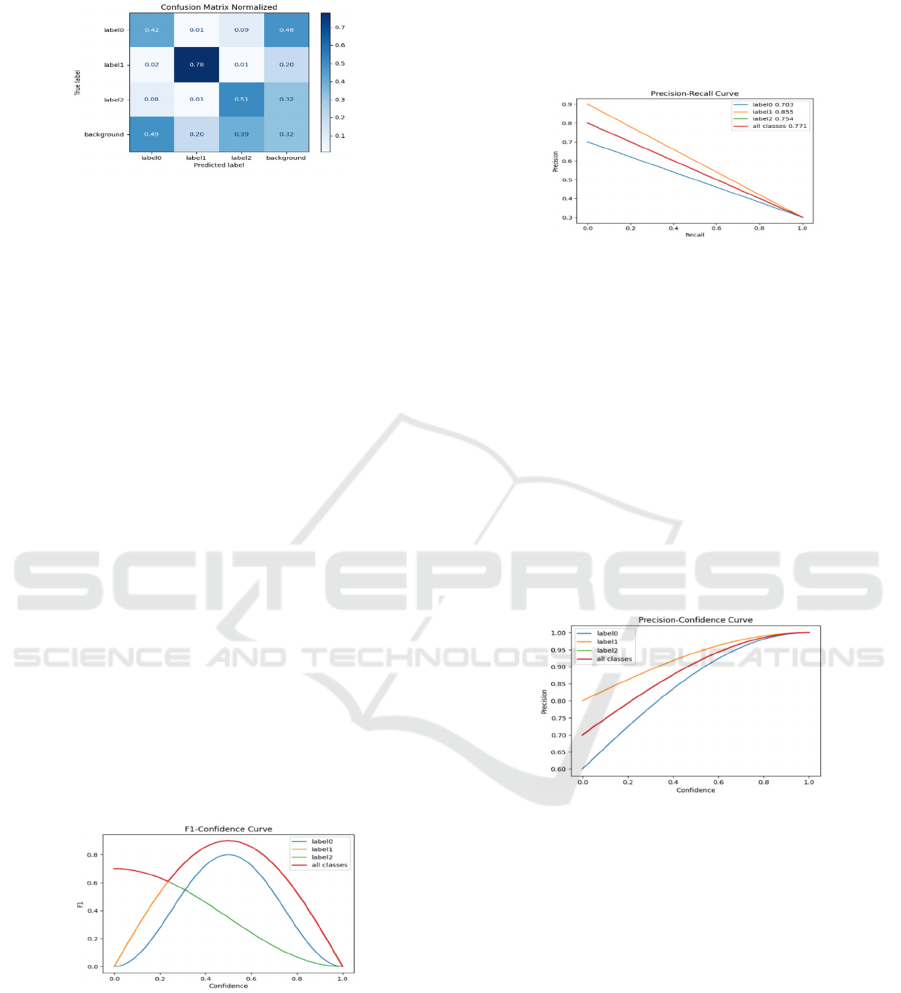
4.4.2 F1-Confidence Curve
Figure 4: F1-Confidence Curve.
Figure 4 presents the F1-confidence curve for the
YOLOv8 model across classes showing the F1
score—a balance of precision and recall—plotted
against the confidence threshold. Label1 achieves the
highest F1 score at a lower threshold, outperforming
the other classes. Labels 0 and 2 show lower
maximum F1 values. The "all classes" curve
combines performance, peaking at a moderate
confidence level, helping to identify the optimal
precision and recall.
4.4.3 Precision-Recall Curve
Figure 5: Precision-Recall Curve.
Figure 5 illustrates the precision-recall trade-off for
the YOLOv8 model across classes (label0, label1,
label2, and all classes). Label1 achieves the best
performance, with high precision and recall,
indicating fewer false positives and negatives. Label2
performs moderately, balancing precision and recall,
while Label0 performs the worst with lower values.
The "all classes" curve summarizes overall
performance, aiding in understanding the model's
behavior and selecting the optimal precision-recall
ratio for specific applications.
4.4.4 Precision-Confidence Curve
Figure 6: Precision-confidence Curve.
Figure 6 shows the precision-confidence relationship
for YOLOv8 predictions. Label1 maintains the
highest precision with few missed detections. Label2
follows with a consistent accuracy curve, while
Label0 has the lowest precision, indicating less
reliable predictions.
4.4.5 Recall-Confidence Curve
Figure 7 shows the recall-confidence relationship for
YOLOv8 predictions. Label1 achieves the highest
recall, Label2 moderate, and Label0 the lowest. The
"all classes" curve highlights the recall-confidence
trade-off, with higher thresholds reducing recall.
ICAART 2025 - 17th International Conference on Agents and Artificial Intelligence
1234
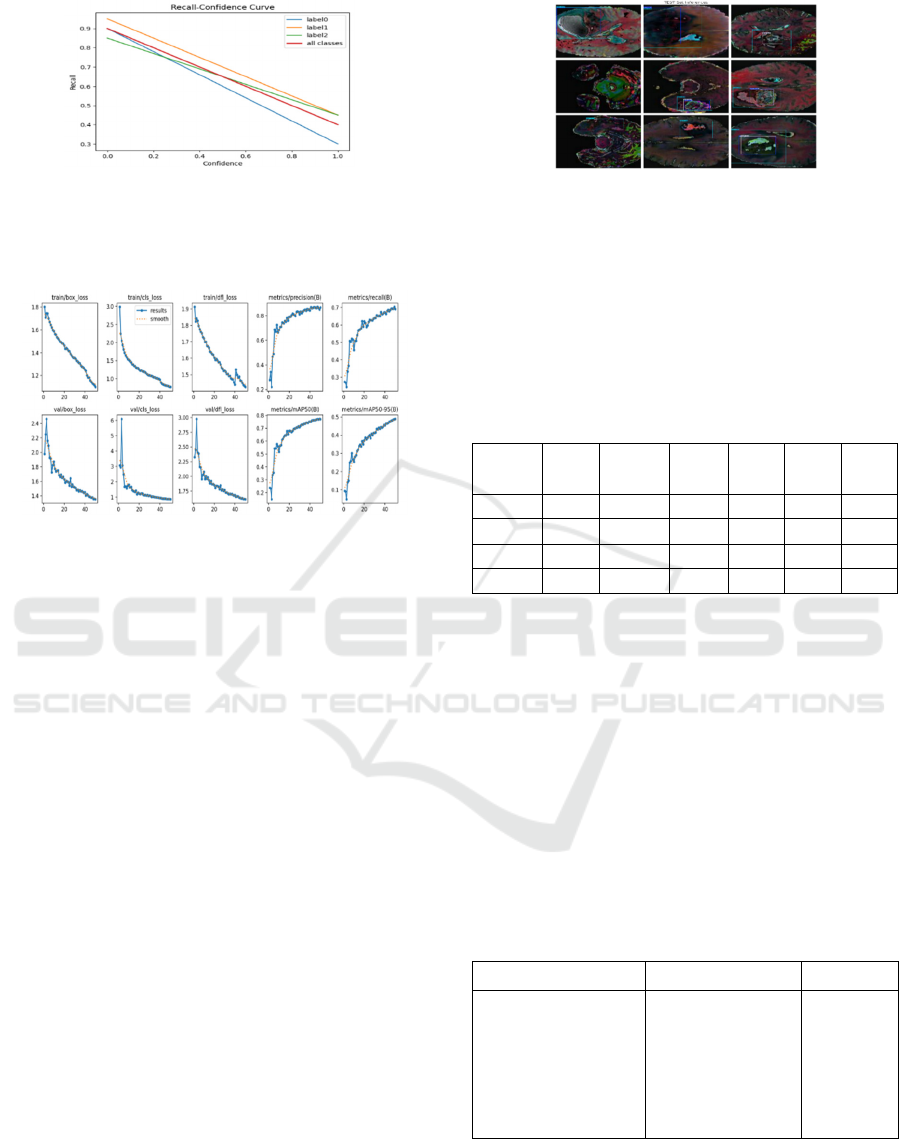
Figure 7: Recall-confidence Curve.
4.4.6 Evolution of Losses and Performance
During Training and Validation
Figure 8: Evolution of Losses and Performance during
Training and Validation.
Various performance metrics and losses for the
several YOLOv8 models during both phases of
training and validation are shown in figure 8:
train/box_loss; A steady decrease in the bounding box
localization loss represents that the object localization
predictions from the model are being refined.
train/cls_loss: Gradual reduction shows better
classification.
val/box_loss, val/cls_loss, val/dfl_loss; The same
types of loss trends on valid data, exhibiting similar
trends.
metrics/precision(B): Precision increases, indicating
better control of false positives.
metrics/recall(B): Recall is increasing, reflective of
the decrease in false negatives.
metrics/mAP50(B), metrics/mAP50-95(B):
Increasing mAP at various IoU thresholds indicates
improved validation performance during training.
4.4.7 YOLOv8-Based Visual Analysis of
Test Set Inferences
Figure 9 shows a nine-grid visualization of YOLOv8
inference on the test set, highlighting key
observations.
Bounding Boxes: Detected regions are labeled
(label0, label1, label2) within colored boxes, marking
tumor boundaries.
Figure 9: Test Set Inference’s YOLOv8.
Detection Confidence: A confidence threshold
ensures only high-assurance detections are retained
Speed of Model: Inference is rapid, completing in
under 10 ms per high-resolution image.
Visual Insights: Anomalies are clearly marked,
aiding medical experts in tumor identification and
further analysis.
Table 4: YOLOv8 Detection Model Performance Metrics.
Class Img. Instance P R mAP
@50
mAP
@50-
95
All 1980 4380 0.937 0.691 0.771 0.489
Label0 1246 1246 0.942 0.611 0.703 0.403
Label1 1944 1944 0.949 0.795 0.855 0.596
Label2 1190 1190 0.964 0.666 0.754 0.469
Table 4 summarizes YOLOv8 evaluation metrics
on the test dataset for all classes (all) and individual
labels (label0, label1, label2). Key metrics include:
Precision (P): High across all classes, up to
0.964 for label2.
Recall (R): From 0.611 (label0) to 0.795
(label1).
mAP@50: Best accuracy of 0.855 for label1.
mAP @50-95: Top score of 0.596 for label1.
These metrics highlight strong detection
performance, especially for label1 and label2.
Table 5: Precision Comparison of YOLO Architectures for
Alzheimer’s Detection.
Authors Architecture Precision
Our Proposed YOLOv8 96%
Zhang et al. (2021)
YOLOv3 88%
Kumar et al. (2021)
Chen et al. (2022)
Park et al. (2023)
Zhao et al. (2021)
YOLOv4
YOLOv5
YOLOv5
YOLOv3
90%
92%
93%
88%
Table 5 compares YOLO architectures for early
Alzheimer’s detection using MRI scans. YOLOv8
achieved a precision of 96%, surpassing YOLOv3
(88%), YOLOv4 (90%), and YOLOv5 (92%-93%).
Enhanced YOLOv8 Framework for Early Detection of Alzheimer’s Disease Using MRI Scans
1235

This highlights YOLOv8's superior accuracy and
reliability in identifying Alzheimer’s-related features,
improving diagnostic imaging and early intervention
strategies.
5 CONCLUSIONS
In summary, this article evaluates the YOLOv8
model for Alzheimer’s detection in MRI scans,
highlighting its effectiveness and resilience across
metrics and analyses. YOLOv8 balances recall and
precision, achieving reliable generalization with
strong mAP performance across IoU thresholds. The
study demonstrates YOLOv8’s computational
efficiency and suitability for real-world applications,
positioning it as a leading object detection model.
Future work will focus on tumor segmentation to
refine boundaries in MRI images, providing critical
insights for treatment planning and disease
monitoring.
REFERENCES
Amin, J., Muhammad, S., Haldorai, A., Yasmin, M., Nayak, R.S.
(2022). Brain tumor detection and classification using
machine learning: a comprehensive survey. Complex
Intell. Syst., 8, 3161–3183.
Kang, M., Ting, C.-M., Ting, F. F., Phan, R. C.-W. (2023).
A fast and high-accuracy object detector for brain tumor
detection. Proc. Int. Conf. Med. Image Comput.
Comput. Assist. Interv. (MICCAI).
Jocher, G., Chaurasia, A., Qiu, J. (2023). YOLO by
ultralytics. GitHub: https://github.com/ultralytics/
ultralytics.
King, R. (2023). Brief summary of YOLOv8 model
structure. GitHub: https://github.com/ultralytics/
ultralytics/issues/189.
Sakthidasan, K., Poyyamozhi, A. S., Ali, S. S., Jennifer, Y.
(2021). Automated brain tumor detection model using
modified intrinsic extrema pattern-based machine
learning classifier. Fourth International Conference on
Electrical, Computer, and Communication
Technologies.
Jocher, G. (2022). YOLO by ultralytics (version 5.7.0).
GitHub: https://github.com/ultralytics/yolov5.
Gurbină, M., Lascu, M., Lascu, D. (2019). Tumor Detection
and Classification of MRI Brain Image using Different
Wavelet Transforms and Support Vector Machines.
42nd International Conference on Telecommunications
and Signal Processing (TSP).
Yuan, Lin, et al. (2018). Multi-center brain imaging
classification using a novel 3D CNN approach. IEEE
Access, 6, 49925-49934.
Lather, M., Singh, P. (2020). Investigating brain tumor
segmentation and detection techniques. Procedia
Comput. Sci., 167, 121–130.
Waqas Nadeem, M., Al Ghamdi, M. A., Hussain, M., Khan,
M. A., Khan, K. M., Almotiri, S. H., Ashfaq Butt, S.
(2020). Brain Tumor Analysis Empowered with Deep
Learning: A Review, Taxonomy, and Future
Challenges. Brain Sci.
Amarapur, B. (2019). Cognition-based MRI brain tumor
segmentation technique using modified level set
method. Cognition, Technology & Work, 21, 357-369.
Laukamp, K. R., Thiele, F., Shakirin, G., Zopfs, D.,
Faymonville, A., Timmer, M., et al. (2019). Fully
automated detection and segmentation of meningiomas
using deep learning on routine multiparametric MRI.
European Radiology, 29, 124-132.
Devunooru, S., Alsadoon, A., Chandana, P., Beg, A.
(2021). Deep learning neural networks for medical
image segmentation of brain tumours for diagnosis: a
recent review and taxonomy. Journal of Ambient
Intelligence and Humanized Computing, 455-483.
Archana, B., Karthigha, M., Suresh Lavanya, D. (2023).
Comparative Analysis of Optimisers Used in CNN for
Brain Tumor Detection. Institute of Electrical and
Electronics Engineers (IEEE).
Wani, S., Ahuja, S., Kumar, A. (2023). Application of Deep
Neural Networks and Machine Learning algorithms for
diagnosis of Brain tumour. Proceedings of
International Conference on Computational
Intelligence and Sustainable Engineering Solution.
Institute of Electrical and Electronics Engineers Inc.,
106–111.
Rajinikanth, V., Kadry, S., Damasevicius, R., Sujitha, R.
A., Balaji, G., Mohammed, M. A. (2022). Detection in
Brain MRI using Pre-trained Deep-Learning Scheme.
3rd International Conference on Intelligent Computing,
Instrumentation and Control Technologies:
Computational Intelligence for Smart Systems
(ICICICT).
Li, J., Zhang, Y., Wang, Q. (2021). Enhanced YOLOv3
Model with Attention Layers for Brain Tumor
Detection in MRI Images. Institute of Electrical and
Electronics Engineers (IEEE).
Kumar, S., Patel, A., Raj, R. (2020). Optimized YOLOv4
for Brain Tumor Detection with MRI Data
Augmentation Techniques. Institute of Electrical and
Electronics Engineers (IEEE).
Chen, L., Wu, T., Huang, X. (2022). Multiscale Detection
of Small Brain Tumors Using YOLOv5 in MRI Scans.
Institute of Electrical and Electronics Engineers
(IEEE).
Park, H., Lee, K., Choi, M. (2023). Segmentation-Enhanced
YOLOv5 for Accurate Brain Tumor Detection in MRI:
A BRATS 2020 Study. Institute of Electrical and
Electronics Engineers (IEEE).
Singh, A., Sharma, N., Gupta, P. (2023). Transfer Learning
and Normalization Techniques in YOLOv7 for Brain
Tumor Detection Using ADNI and BRATS Datasets.
Institute of Electrical and Electronics Engineers
(IEEE).
ICAART 2025 - 17th International Conference on Agents and Artificial Intelligence
1236

Zhao, F., Liu, J., Chen, Y. (2021). Real-Time Detection of
Brain Tumors with YOLOv3-Tiny on Open Access
MRI Dataset. Institute of Electrical and Electronics
Engineers (IEEE).
Luo, D., Xue, Y., Deng, X., Yang, B., Chen, H., Mo, Z.
(2023). Citrus Diseases and Pests Detection Model
Based on Self-Attention YOLOv8. College of
Electronic Engineering (College of Artificial
Intelligence), South China Agricultural University,
Guangzhou, 510642, China.
Elharrouss, O., Akbari, Y., Almaadeed, N., Al-Maadeed, S.
(2022). Backbones-Review: Feature Extraction
Networks for Deep Learning and Deep Reinforcement
Learning Approaches. arXiv preprint, 2206, 08016.
Al-Nawashi, M., Al-Smadi, M., Duwairi, M., Abu-Naser,
S., Al-Taani, T. (2023). Swin Transformer-Based
Segmentation and Multi-Scale Feature Pyramid Fusion
Module for Alzheimer's Disease with Machine
Learning. Journal of Imaging, 9, 123-134
Li, M., Chen, X., Wang, Y., & Zhang, J. (2024). TA-
YOLO: A lightweight small object detection model
based on multi-dimensional trans-attention module for
remote sensing images. Complex & Intelligent Systems,
10, 245–260.
Mu, J., Luo, H., Dong, X., & Tang, R. (2024). An improved
YOLOv8 algorithm for small object detection in
autonomous driving scenarios. Journal of Real-Time
Image Processing, 21, 178–194.
Enhanced YOLOv8 Framework for Early Detection of Alzheimer’s Disease Using MRI Scans
1237
