
CriX: Intersection of Crime, Demographics and Explainable AI
Muhammad Ashar Reza
a
, Aaditya Bisaria
b
, Advaitha S.
c
,
Alekhya Ponnekanti
d
and Arti Arya
e
Department of Computer Science Engineering, PES University, Bengaluru, India
Keywords:
Crime, Demographic Factors, Large Language Model, RAG, Zero-Shot Learning, Explainable AI.
Abstract:
Crime prediction and analysis often rely on crime statistics but neglect the potential influences of demographic
factors. Each locality possesses unique characteristics indicating that a ’one-size-fits-all’ methodology is in-
adequate. This research presents a framework CriX that incorporates demographic factors to help understand
and address localised crime. At the root level, identifying and predicting crime hotspots is essential for provid-
ing context in training the language model; therefore, ST-DBSCAN and LSTM models are respectively used
on a custom-made dataset. InLegalBERT (Paul et al., 2023), which is pre-trained on Indian legal data, helps
generate embeddings for the large corpus of crime hotspot, demographic and legal data. These embeddings
are stored in a FAISS vector store, allowing for dynamic retrieval using RAG techniques. The generated em-
beddings are then fed into MistralAI offering a textual solution. These outputs are further refined using zero
shot learning increasing model performance. The proposed framework achieved a validation accuracy of over
82% for crime hotspot predictions. The LLM also showcased substantial scores for Compactness, Fidelity
and Completeness, giving an average score of 4.18 out of 5, outperforming baseline models. This approach
enhances the interpretability of legal models by incorporating the concepts of Explainable AI (XAI).
1 INTRODUCTION
Crime analysis and prediction have become pivotal in
improving public safety and law enforcement strate-
gies, particularly in regions with complex demo-
graphic dynamics like Karnataka, India. Traditional
crime prediction models often focus on spatial and
temporal crime patterns but tend to overlook the un-
derlying factors that influence criminal behaviour.
Demographic factors such as GDDP
1
, NDDP
2
, PCI
3
and HDI
4
provide essential insights into the societal
conditions that might trigger a surge in criminal activ-
ity.
This research aims to develop a framework for
a
https://orcid.org/0009-0005-9458-2754
b
https://orcid.org/0009-0002-3692-3037
c
https://orcid.org/0009-0008-4074-4692
d
https://orcid.org/0009-0009-7616-7986
e
https://orcid.org/0000-0002-4470-0311
1
GDDP: Gross District Domestic Product
2
NDDP: Net District Domestic Product
3
PCI: Per Capita Income
4
HDI: Human Development Index
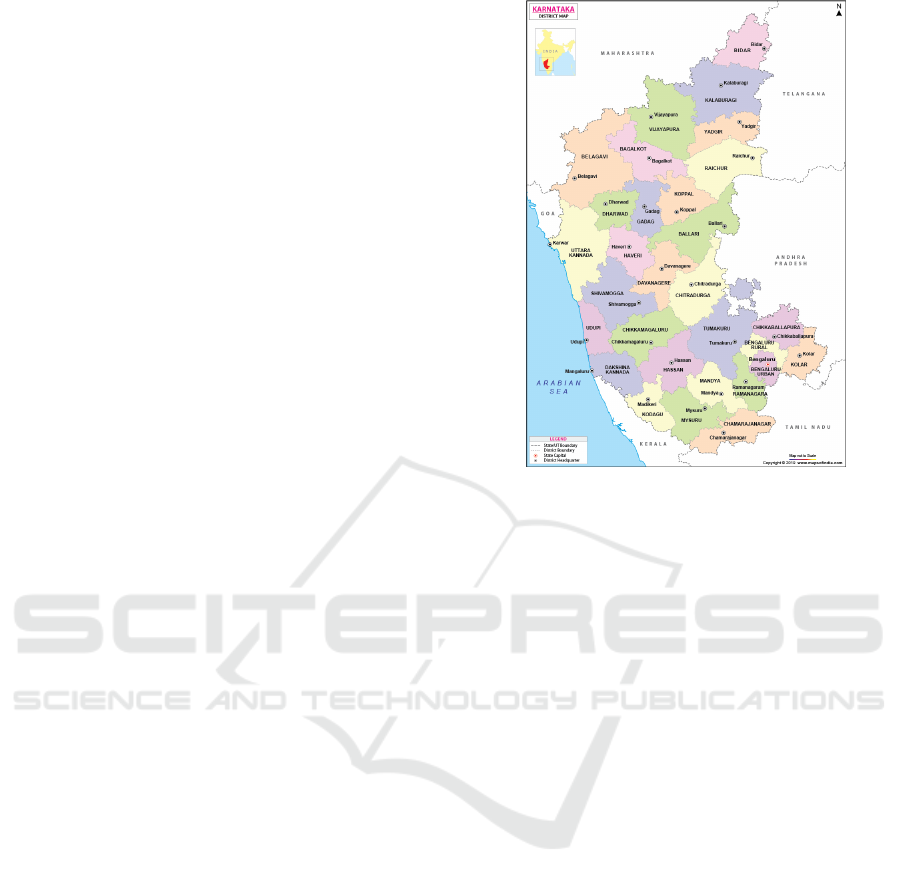
identifying and predicting crime hotspots in Kar-
nataka by integrating crime data with demographic
factors. The study utilises two primary datasets: First,
the FIR data from 2020 to 2022, covering the 31
districts of Karnataka and 1060 police stations, was
scraped from the official Karnataka Police website
(Karnataka State Police, ). In addition, various de-
mographic indicators (Government of Karnataka, )
for these districts were collected, providing a com-
prehensive profile of the region. The various districts
of Karnataka can be seen in Figure 1.
To identify current crime hotspots, the re-
search employs the ST-DBSCAN clustering algo-
rithm, which allows for clustering crimes based on
both spatial and temporal features. These clusters are
passed to a Long Short-Term Memory (LSTM) to pre-
dict future hotspots where criminal activity is likely
to intensify within a specified time frame. The LSTM
model is particularly well suited for this task, as it
captures temporal dependencies and can predict se-
quences of data over time.
Therefore, a cascaded forecasting approach was
adopted by integrating the output of the ST-DBSCAN
clustering algorithm with the LSTM model. Using the
714
Reza, M. A., Bisaria, A., Advaitha, S., Ponnekanti, A. and Arya, A.
CriX: Intersection of Crime, Demographics and Explainable AI.
DOI: 10.5220/0013316200003890
Paper published under CC license (CC BY-NC-ND 4.0)
In Proceedings of the 17th International Conference on Agents and Artificial Intelligence (ICAART 2025) - Volume 2, pages 714-725
ISBN: 978-989-758-737-5; ISSN: 2184-433X
Proceedings Copyright © 2025 by SCITEPRESS – Science and Technology Publications, Lda.
strengths of spatial-temporal clustering and sequence
prediction, this approach enables a seamless transi-
tion from identifying current crime hotspots to fore-
cast future ones with improved accuracy.
The identified and predicted crime hotspots are
processed through InLegalBERT to generate embed-
dings, which in due course are stored in a FAISS vec-
tor store for faster retrieval. InLegalBERT, a BERT
based model pre-trained on Indian legal texts (Paul
et al., 2023), serves as the foundation for generating
these embeddings. Once a user queries to the LLM by
adding crime location, IPC Section and District name,
the input values are converted into embeddings using
InLegalBERT for further processing.
The raLLM retriever then compares the query em-
beddings with the stored embeddings in the vector
store, retrieving the most relevant chunks based on
cosine similarity. These retrieved chunks are passed
to Mixtral-8x22B-Instruct-v0.1, a customised version
of the Mistral AI LLM, which transforms the embed-
dings into natural language outputs that are compre-
hensible.
By using InLegalBERT’s embeddings along with
crime and demographic data, this research adds a sig-
nificant and impactful interpretative layer, contextu-
alising crime hotspots with meaningful demographic
insights. Adding on, the witness and victim descrip-
tions are provided in Kannada which is the local lan-
guage of Karnataka. The LLM integrates a Kannada
to English translation API to enhance the accessibility
and comprehension of these FIRs. The output gener-
ated by Mistral AI is enhanced using zero-shot learn-
ing, which operates without requiring examples for
understanding or improving the model’s performance.
Thus Explainable AI (XAI) plays a pivotal role
in enhancing the interpretability and transparency of
crime prediction models. This is achieved through its
four key concepts: justify, control, discover, and im-
prove. These elements provide a structured frame-
work for making the model’s insights accessible and
actionable.
The motivation for this work stems from the need
to tackle crime at its root by identifying and analysing
demographic factors that contribute to criminal activ-
ity. By prioritising these aspects, the study aims to
improve societal conditions in Karnataka, India, re-
ducing crime rates and promoting safer, more secure
communities.
This paper explores the integration of demo-
graphic factors into crime prediction models and em-
phasises crime explainability using a language model
(LLM). The Related Work section reviews existing
methodologies and identifies research gaps in the
field. The Methodology section outlines the data col-
Figure 1: The 31 Districts of Karnataka, India.
lection process, including FIR scraping, and details
the application of ST-DBSCAN and LSTM models
for identifying and predicting crime hotspots. It also
delves into the role of InLegalBERT and the FAISS
vector store in embedding generation and storage.
The retriever mechanism is explained, demon-
strating how it retrieves relevant chunks based on co-
sine similarity, which are then passed to MistralAI for
generating comprehensible outputs. This output is en-
hanced using zero-shot learning to improve its rele-
vance and quality.
The Results section presents key findings and vi-
sualisations of crime patterns across Karnataka. The
Discussion interprets these results, highlighting their
connection to demographic factors and offering in-
sights into potential strategies for crime prevention
and reduction.
2 RELATED WORK
2.1 Model Analysis
Understanding criminal patterns over different areas
is extremely important for crime prediction.(Wheeler
and Steenbeek, 2021) used Random Forests to predict
long term crime patterns in Dallas, Texas. Random
Forest was chosen as the model for its power in se-
lecting feature variables and non-linear correlations of
the crime occurrences. The performance of the model
was better than previous methods, including Risk Ter-
rain Modelling and Kernel Density Estimation. They
CriX: Intersection of Crime, Demographics and Explainable AI
715

also established the fact that impacts of predictors on
the crime rates were in fact non linear and spatial.
(Mandalapu et al., 2023) conducted an extensive
review of various papers and found that traditional
clustering algorithms, such as K-Means, often fell
short in addressing the dynamic and noisy nature of
real-world crime data, particularly when temporal di-
mensions were involved. The maximum accuracy
these models could achieve was about 80%. Crime
incidents are influenced by both spatial proximity and
time intervals and thus deep learning models like
CNN or LSTM that simultaneously handle these di-
mensions performed significantly better. They found
the accuracy of such models reaching almost 95% de-
pending on the quality of the datasets.
(Marchant et al., 2018) noted that the Bayesian
framework improved criminal data analysis by using
a probabilistic model for capturing the dependencies
between crime rates and socio-environmental factors.
It also helped in incorporating the uncertainty asso-
ciated with predictions. It covered parametric and
non-parametric approaches, resulting in the capabil-
ity to model spatial dependencies adequately to fore-
cast crime rates. The authors considered investigation
of property crimes including theft, assault and drug
related offences and established that crime rates are
critically dependent on other demographic traits and
environmental features such as population density. In
conclusion, the Bayesian application was beneficial
for comprehensive and diverse crime analysis.
(Birant and Kut, 2007) proposed the ST-DBSCAN
algorithm which had the ability of discovering clus-
ters according to non-spatial, spatial and temporal val-
ues of the objects and was particularly effective for
processing very large datasets. They introduced the
novel concept of density factor which enabled the
algorithm to handle noisy data even when clusters
of different densities were present. It had a much
faster runtime (factor between 1.5 and 3 times) than
other clustering algorithms such as CLARANS (Ng
and Han, 1994) and DBCLASD (Xu et al., 1998) and
the factor only increased with the size of the datasets
used. Thus ST-DBSCAN became a strong candidate
for clustering using spatial–temporal data.
(Ramirez-Alcocer et al., 2019) demonstrated that
the use of Long Short-Term Memory (LSTM) net-
works delivered strong results for predicting future
crime hotspots as it was adept at handling sequential
data. The study showed the feasibility of employing
LSTM models trained on extensive datasets of his-
torical crime records. Their deep learning approach
achieved a high performance in the final model with
a validation accuracy of 87.84% and an average loss
function of 0.0376.
(Rai et al., 2022) demonstrated an effective ap-
proach by utilising LSTM in tandem with BERT, a
language model, to extract deeper contextual and lin-
guistic insights. The authors developed a model that
automatically classified news articles as either fake or
real based on their titles. This combination not only
enhanced the predictive accuracy to 88.75%, but also
enabled a more nuanced understanding of the textual
elements in the datasets.
Crime prediction involving the incorporation of
legal language models has become more popular re-
cently with different studies having researched on it.
(Paul et al., 2023) proposed InLegalBERT, inspired
by the work of (Beltagy et al., 2019) called SciBERT
that was pre-trained on scientific publications. InLe-
galBERT is a legal aligned BERT model pre-trained
on Indian legal documents. This study showed that
the proposed model could understand legal terms and
its context for the tasks relevant to the Indian legal
system such as of categorisation of crimes as per the
Indian Penal Code (IPC). The authors also noted that
warming on domain-specific texts improved the fine-
tuning results in legal NLP tasks substantially.
(Bogomolov et al., 2014) examined the correlation
between crime and demographic characteristics using
aggregated human behavioural data captured from the
mobile network infrastructure in combination with
basic demographic information. They achieved an ac-
curacy of almost 70% when predicting hotspots for
real crime data in London. This proved that using de-
mographic factors have the potential to help predict-
ing urban crime issues effectively.
(Fan et al., 2024) highlights the significance of
RAG in enhancing the capabilities of generative AI
by supplying reliable and up-to-date external knowl-
edge, which is particularly beneficial in the context of
AI-Generated Content (AIGC). The paper emphasises
the potential of raLLMs to mitigate common issues
faced by traditional LLMs, such as hallucinations and
outdated internal knowledge, by leveraging retrieval
mechanisms.
(VM et al., 2024) divides the process of fine tun-
ing into several stages. First training data in the target
domain was gathered and the text was then broken
into chunks and tokens with a suitable tokenizer to
convert the text into embeddings. The training cov-
ered the next token prediction strategy and optimised
the weights derived from the accumulated responses
given a trained-task oriented set of data set. The au-
thors highlighted that although the fine-tuning pro-
cess helped to improve the model, it raised a number
of issues including the availability and quality of the
data, costs and ethical issues, which are all critical and
should be discussed in detail.
ICAART 2025 - 17th International Conference on Agents and Artificial Intelligence
716
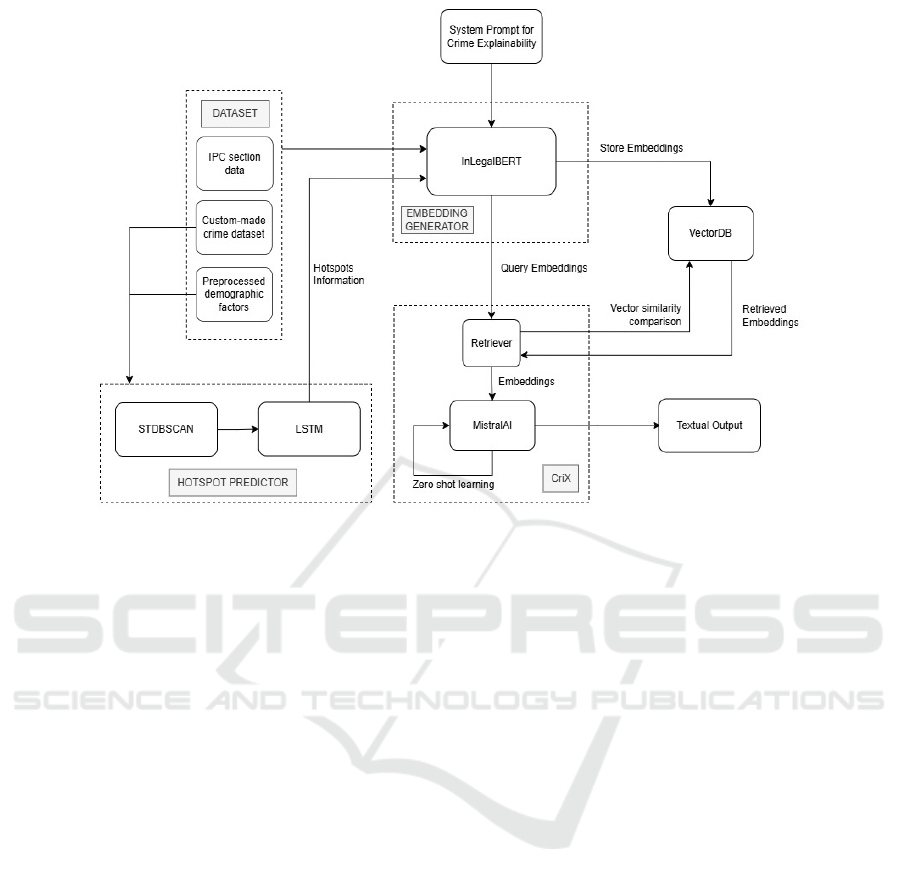
Figure 2: Proposed Architecture Diagram for CriX (Crime Explainer).
2.2 Research Gaps
Together, these works offer a snapshot of what is
emerging as the state of the art in the field of crime
prediction that joins methods formalised in legal lan-
guage models with other data. However, there remain
important gaps in the evidence, as stated below:
• Absence of readily available data for the India
state of Karnataka, led us to developed our own
dataset.
• Most approaches focused on identifying crime
patterns and hotspots without addressing the root
causes of criminal behaviour, often treating the
symptoms rather than the underlying factors.
• Each district possesses unique characteristics in-
dicating that a one-size-fits-all methodology is in-
adequate. Therefore, a tailored approach is essen-
tial for effective crime prevention and interven-
tion.
3 METHODOLOGY
This work leverages InLegalBERT (Paul et al., 2023),
a BERT-based model trained on Indian legal texts
for its generative embeddings and is used by Mistral
model with district-level demographic data from Kar-
nataka. The primary aim is to predict why specific
crimes occur in different districts by integrating le-
gal and demographic factors. This section explains
the architecture of the model, the data collection and
preprocessing steps, the features used, and the fine-
tuning process with demographic data. The proposed
architecture is visualised in Figure 2.
3.1 Data Collection and Preprocessing
The study utilizes two key datasets in the form of
JSON files: one capturing crime data over the years
2020-2022 for all 31 districts of Karnataka and an-
other that includes various demographic indicators
across these years. The scraping of the crime dataset,
detailing incidents across 1,060 police stations, from
the Karnataka Police website was automated using
Selenium, facilitating large-scale data collection. The
extracted data is formatted as JSON files, captur-
ing essential attributes such as crime location, IPC
sections, police station proximity, and time details.
Meanwhile, the demographic dataset encompasses
yearly indicators such as GDDP, NDDP, per capita in-
come, literacy rate, health index, and HDI, providing
a comprehensive profile for each district. Together,
these datasets enable an integrated analysis of how
demographic factors correlate with crime across Kar-
nataka.
The transliteration process utilises the ‘Translator‘
class from the Gemini library, configured to trans-
CriX: Intersection of Crime, Demographics and Explainable AI
717

late from Kannada(’kn’) script to English(’en’). The
system initialises the converter with source and tar-
get scripts. FIR content recorded in Kannada is then
passed to the converter, which outputs the English
translation, preserving the original meaning. This
method facilitates consistent and interpretable crime
description data for further analysis, aligning local
linguistic data with broader law enforcement frame-
works. The success of crime prediction models de-
pends heavily on the quality of both legal and demo-
graphic data. The economic and development data
was sourced from data.opencity.in to reflect district-
specific characteristics that might influence crime.
3.1.1 Feature Engineering
To effectively incorporate the demographic data into
the model, we transformed these demographic indica-
tors into numeric features. Some key steps in feature
engineering included:
3.1.2 Normalization
All continuous variables, such as GDDP, NDDP, and
Per Capita Income, were normalized to ensure they
were on the same scale, preventing one feature from
dominating others during model training.
3.1.3 Encoding Categorical Features
IPC sections were encoded as categorical variables to
make them interpretable by the model. Each IPC sec-
tion corresponds to a unique integer representation,
enabling the model to differentiate between types of
crimes.
3.1.4 Handling Missing Data
For districts where some demographic data was miss-
ing or unavailable, we used interpolation techniques
and, in some cases, district averages to fill in the gaps.
This pre-processing allowed us to create a rich feature
set that paired each crime type (based on its IPC sec-
tion) with the district’s demographic profile.
3.2 Spatio-Temporal Density-Based
Spatial Clustering of Applications
with Noise
3.2.1 Structure
• Parameter Setting:
– best spatial threshold: Determines the spatial
distance for clustering,
– best temporal threshold: Specifies the tempo-
ral distance,
– best min samples: Sets the minimum number
of samples required to form a cluster.
Let density distance max of a point p denote
the maximum distance between the point and its
neighbour objects within the neighbourhood ra-
dius centred around a point. Similarly, let den-
sity distance min of point p denote the minimum
distance between the point and its neighbour ob-
jects within the radius.
The density factor of a cluster C captures the de-
gree of the density of the cluster. If C is a “loose”
cluster, density distance min would increase and
so the density distance would be quite small, thus
forcing the density factor of C to be quite close
to 1. Otherwise, if C is a “tight” cluster, den-
sity distance min would decrease and so the den-
sity distance would be quite big, thus forcing the
density factor of C to be quite close to 0.
density factor(C) =
1
∑
p∈C
density distance(p)
|C|
(1)
density distance min(p) =
min{dist(p, q) | q ∈ D ∧ dist(p, q) ≤ E ps}
(2)
density distance max(p) =
max{dist(p, q) | q ∈ D ∧ dist(p, q) ≤ E ps}
(3)
• Model Initialisation and Fitting: An instance
of ST DBSCAN is created with the best parame-
ters. The model is then fitted to the scaled features
extracted from the crime data, including latitude,
longitude, crime occurrence time, and various de-
mographic factors.
• Label Extraction and Data Preparation: The
clustering labels generated by the model are re-
trieved and added to the original DataFrame, al-
lowing for identification of clusters within the
data.
• Data Visualisation: A 3D scatter plot is created
to visualize the clustered crime data over time,
with latitude on the x-axis, longitude on the y-
axis, and the normalized time on the z-axis as can
be seen in Figure 3. The points are coloured based
on their cluster membership, and a colour bar is
included for reference.
ICAART 2025 - 17th International Conference on Agents and Artificial Intelligence
718
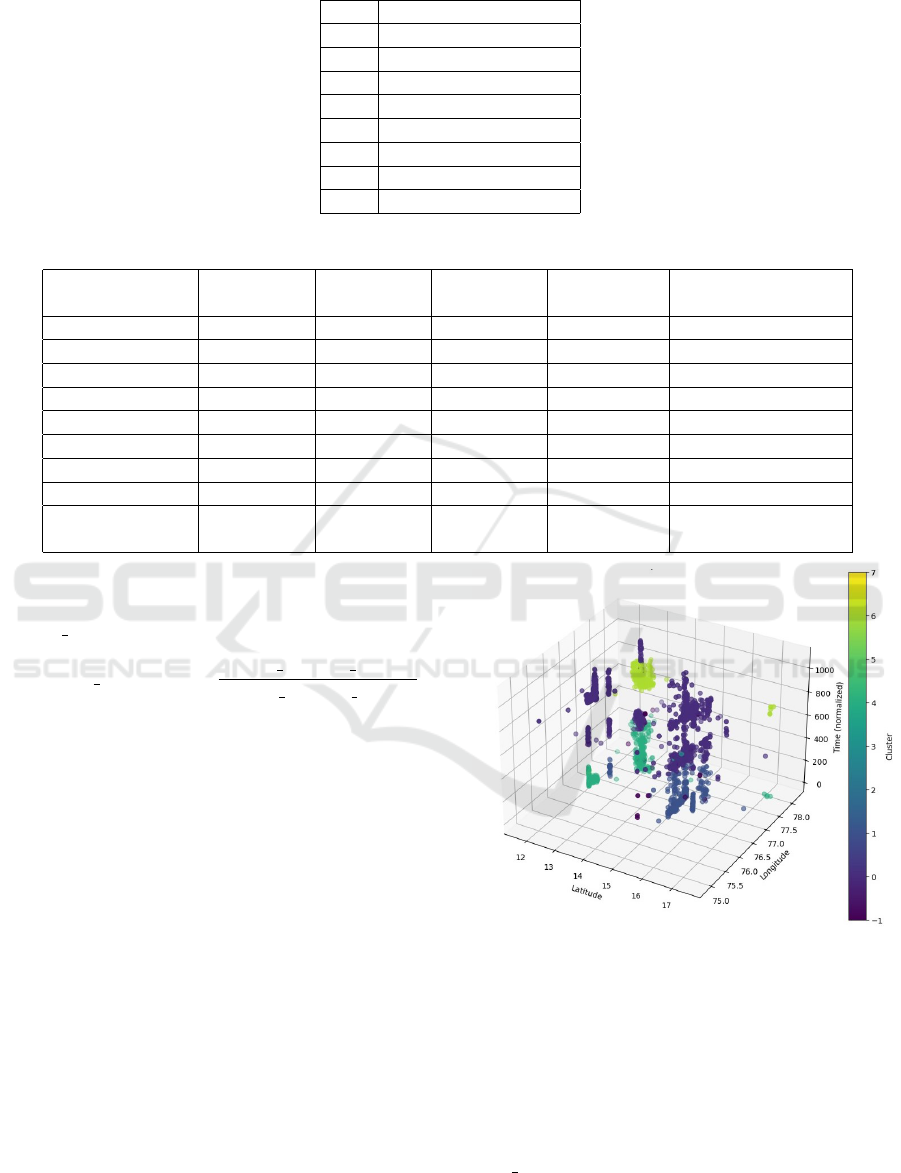
Table 1: Features Key Utilised in Table 2 for ST-DBSCAN Clustering.
Key Feature
A Crime Latitude
B Crime Longitude
C Crime Time Number
D Encoded Crime Count
E NDDP Current
F GDDP Current
G Per Capita Current
H Average Crime Time
Table 2: ST-DBSCAN Clustering Results for Mysuru District, Karnataka.
Features Number of Number of Number of Cluster IDs Points in Each
Set Key Features Clusters Outliers Cluster
A, B, C, D 4 1 1 0 3127
A, B, C, D, E 5 2 4 0, 1 2501, 623
A, B, C, D, F 5 2 3 0, 1 2067, 1058
A, B, C, D, G 5 2 3 0, 1 2663, 462
A, B, C, D, H 5 2 17 0, 1 3108, 3
A, B, C, D, E, F 6 3 5 0, 1, 2 2067, 433, 623
A, B, C, D, E, G 6 4 5 0, 1, 2, 3 1605, 433, 623, 462
A, B, C, D, F, G 6 3 3 0, 1, 2 1605, 1058, 462
A, B, C, D, E, F, 8 8 35 0, 1, 2, 3, 4, 1756, 710, 417,
G, H 5, 6, 7 166, 28, 6, 4, 3
The density factor of a cluster C captures the
degree of the density of the cluster. The den-
sity distance of an object p is defined as
density distance(p) =
density distance max(p)
density distance min(p)
.
(4)
• Cluster and Outlier Reporting: Finally, the
code calculates and prints the number of clusters
and outliers (noise points) detected by the algo-
rithm.
3.2.2 Input and Output
• Input: The model takes as input a DataFrame
containing scaled features related to crime occur-
rences, including geographical coordinates, tem-
poral data, and demographic factors as specified
in Table 1.
• Output: The output consists of clustered labels
assigned to each data point and a 3D visualisation
of the crime hotspots over time. The reduction
in noise as hotspots are identified more clearly,
rather than being diffused by the inclusion of ad-
ditional factors, which is illustrated in Table 2.
Figure 3: 3D Visualisation of Crime Hotspots.
3.2.3 Model Architecture
The clustering performed by ST-DBSCAN acts as a
foundational analysis tool that segments the data into
meaningful clusters based on the provided parame-
ters. The fine-tuning parameters for the ST-DBSCAN
model include the spatial threshold (eps1), tempo-
ral threshold (eps2) and minimum samples required
(min samples) for forming clusters. These parame-
ters can be adjusted based on previous grid search re-
sults to optimise clustering performance. Thus, it ef-
CriX: Intersection of Crime, Demographics and Explainable AI
719

fectively identifies and visualises crime hotspots and
helps facilitate a deeper understanding of crime pat-
terns in Karnataka.
3.3 Long Short Term Memory
3.3.1 Structure
The LSTM layer is initialised with parameters and
processes sequential data. It also considers a dropout
parameter which is used to prevent overfitting. A fully
connected layer follows the LSTM layer, which maps
the LSTM’s output to the desired number of output
classes, being the hotspot clusters in the research.
3.3.2 Input and Output
• Input: The model expects input in the shape of
(batch size, sequence length, input dim), where
sequence length is the number of time steps in
each input sequence, and input dim is the number
of features (demographic factors and other rele-
vant indicators).
• Output: The output of the model is a tensor rep-
resenting the predicted class probabilities for each
cluster, with the shape (batch size, output dim).
The model uses softmax activation implicitly in
the loss function during training to interpret these
outputs as probabilities for multi-class classifica-
tion. The predicted hotspots for the state of Kar-
nataka and the district of Mysuru is plotted in Fig-
ure 4 and Figure 5 respectively.
Figure 4: Predicted Crime Hotspots in the State of Kar-
nataka.
Figure 5: Predicted Crime Hotspots in the District of My-
suru, Karnataka.
3.3.3 Model Architecture
• LSTM Layer: This core layer is responsible for
learning sequential patterns, configured with the
specified number of input features, hidden units,
and layers.
• Fully Connected Layer: A linear transforma-
tion that reduces the hidden state output from the
LSTM to the desired number of clusters.
3.3.4 Parameter Optimisation
The model includes several fine-tuning parameters:
• input dim: Number of features in the input data,
which is dynamically determined based on the
shape of the training dataset X train.
• hidden dim: Set to 128, which specifies the size
of the hidden state in the LSTM, allowing the
model to capture complex patterns in the data.
• output dim: Determined by the number of
unique clusters in the dataset, ensuring the model
outputs a prediction for each cluster.
• num layers: Defaulted to 2, which indicates the
model will stack two LSTM layers for deeper
learning.
• dropout: Set to 0.3, providing regularization to
mitigate overfitting during training.
• Optimizer and Loss Function: The Adam op-
timizer is utilised with a learning rate of 0.001,
and the loss function is defined as CrossEntropy-
Loss, which is suitable for multi-class classifica-
tion tasks, ignoring any specified index (-1) for
outlier points.
ICAART 2025 - 17th International Conference on Agents and Artificial Intelligence
720

Once the legal and demographic data was pre-
processed, we fine-tuned InLegalBERT (Paul et al.,
2023) using district-level demographic data. The goal
of fine-tuning was to enable the model to associate
certain IPC sections with specific demographic con-
ditions in different districts.
3.4 CriX - raLLM Enhanced
InLegalBERT with MistralAI
3.4.1 Structure
CriX (Crime Explainer) is a framework modelled to
provide an easily comprehensible text-based analysis
for crime occurrence based on demographic parame-
ters of the location. For example, the crime tenden-
cies in a specific area may be correlated with income
difference or low literacy levels, thus providing prac-
tical insight for policymakers to implement potential
socio-economic interventions.
In the proposed framework, embeddings are gen-
erated using InLegalBERT (Paul et al., 2023), a model
fine-tuned on Indian legal texts, to create context-
aware representations of the input data. These embed-
dings are stored and indexed in a FAISS vector store,
enabling efficient retrieval using cosine similarity. A
retrieval augmentation framework processes queries
and gets the required set of embeddings, which are
then passed to the Mixtral-8x22B-Instruct-v0.1 gen-
erative model. This model, with its zero-shot learning
capabilities, converts embeddings into coherent and
contextually accurate natural language output.
3.4.2 Input and Output
• Input: The input consists of:
– Predicted crime hotspots: Output clusters from
the LSTM model representing high-risk areas
of crime based on spatial-temporal and demo-
graphic factors.
– Demographic data: Socio-economic indica-
tors such as Gross District Domestic Prod-
uct (GDDP), Net District Domestic Product
(NDDP), per capita income, literacy rate, health
index, etc., specific to each region within Kar-
nataka.
• Output: For every predicted location of crime ac-
tivity, the model provides an easily understand-
able text-based analysis. For instance, it might
suggest that crime tendencies in a specific area
may be correlated with income difference or low
literacy levels. In addition, the human under-
standable output offers practical insight regarding
the potential linking of crime occurrence to de-
mographic parameters which could help policy-
makers to selecting potential socio-economic in-
terventions.
3.4.3 Model Architecture
InLegalBERT is a BERT based transformer model
pre-trained on Indian legal texts, making it partic-
ularly suited for generating embeddings related to
crime data within the context of Indian law. Crime
and demographic information is then embedded and
stored in a FAISS vector store, which is populated
with embeddings generated by InLegalBERT. This
knowledge base stores grouped crime and demo-
graphic embeddings for contextual relevance. These
embeddings are then used to get the top three most
relevant chunks from this store using a cosine simi-
larity mechanism.
The Mixtral-8x22B-Instruct-v0.1 LLM model is
used to perform the text generation and comprehen-
sion tasks. The retriever augmentation framework
searches the FAISS vector store and identifies the
top three relevant chunks of embeddings. These ob-
tained embeddings are used by Mixtral as knowledge
sources to perform zero-shot learning. The Mistral
LLM maps these embeddings to natural language sen-
tences that are coherent and grounded without utilis-
ing any labelled examples.
The retrieval augmentation framework ensures
that the data unseen by the LLM are dynamically
fed into the model, allowing the responses to be ac-
curate and context-bound thus minimising hallucina-
tions that are typical in the LLMs. The LLM cache
stores recent responses that can be readily accessed
for similar queries thus improving efficiency and re-
ducing redundant computations.
4 RESULTS AND DISCUSSION
4.1 Hotspot Cluster Identification
The ST-DBSCAN algorithm clusters crime hotspots
in Karnataka where areas of denser crime are de-
picted. This clustering also takes into account the var-
ious demographic factors for these districts. Multiple
clusters are identified in this process. Each cluster
type provides insights about spatial and temporal pat-
terns of crime, assisting in identifying areas that may
benefit from increased surveillance or targeted inter-
ventions. The distribution of crimes across the clus-
ters identified is plotted in Figure 6.
Some regions exhibit unique crime patterns due to
CriX: Intersection of Crime, Demographics and Explainable AI
721
factors such as fluctuations in crime unrelated to the
general state trends, or specific socio-economic con-
ditions like high population densities and varying in-
come levels. Moderate to large hotspots tend to have
significant socio-economic differences, where crime
is more prevalent due to economic activities, popu-
lation standards and social status. Districts under-
going urbanisation or experiencing changes in eco-
nomic conditions or migration rates may see an in-
crease in crime as well. Smaller, localised hotspots
may emerge in areas with unique demographic pro-
files, such as high-income but low-population-density
areas, where the crime dynamics differ from those of
more densely populated, lower-income regions.
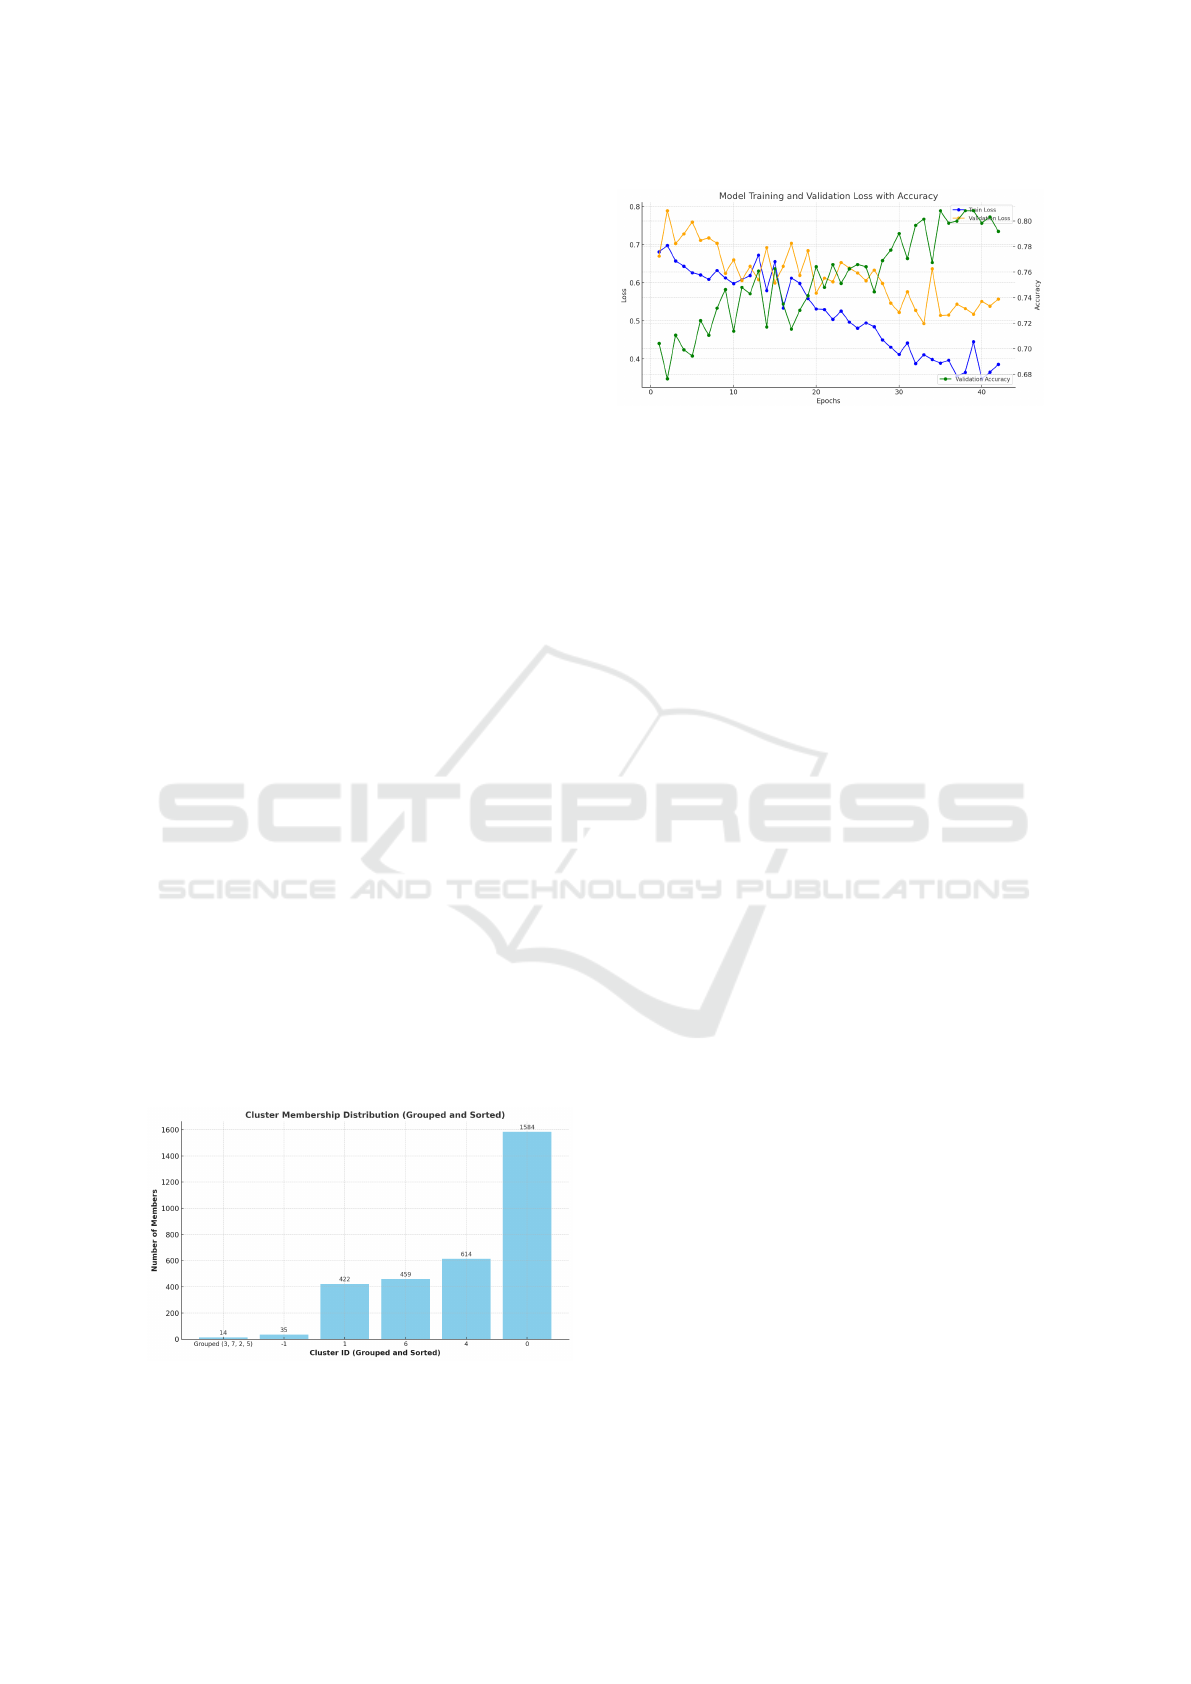
Training of the LSTM model showed signifi-
cant improvement in valuation metrics during the 50
epochs. The training loss was reduced steadily down
to 0.3475 on the last epoch, while the change in the
validation loss was characterised by a gentle decline
with the minimum loss of 0.4928 achieved on epoch
33. The validation accuracy attained its highest of
0.8211 at epoch 35, as illustrated in Figure 7, which
demonstrated the model’s progressive ability at using
demographic factors to forecast crime intensity. For
training control, early stopping was applied when val-
idation performance was stagnant, leading to the stop-
ping of training at epoch 42 to guard against overfit-
ting.
The effectiveness of this approach was evaluated
by comparing the results with existing models imple-
mented in the study by (Zhuang et al., 2017) which
included STNN-LSTM (81%), multilayer perceptron
(76. 75%), random forest (76. 25%) and decision tree
(76%). The proposed cascaded-forecasting model
consisting of STDBSCAN and LSTM achieved a
higher accuracy than all the models used in this study.
These results suggest that our model is well-suited for
accurately capturing spatial and temporal dependen-
cies in crime hotspot prediction.
Figure 6: Identified hotspot cluster IDs visualised in in-
creasing order of density of crimes.
Figure 7: Results of Cascaded Forecasting Model: ST-
DBSCAN Infused LSTM.
4.2 Large Language Model
Performance Comparison
CriX’s performance is compared to various other
models of BERT in combination with the Mixtral
LLM. It yielded much more reliable results when
comprehending complex legal language and context
when trained on demographic and hotspot data, as
they account for the underlying demographic factors
influencing crime rates. The models implemented
are, BERT-based LLM (achieving an average score of
2.27), InLegalBERT (achieving an average score of
2.67), and CriX (achieving the highest average score
of 4.18). These scores highlight the distinctions in
model performance based on Compactness, Fidelity,
and Completeness. Each metric explained is scored
out of 5.
• Compactness: CriX demonstrates a superior
compactness, with a value of 4.03, surpassing
BERT based LLM (which achieved a score of
3.73) and InLegalBERT (which achieved a score
of 2.55), by producing concise and targeted ex-
planations that highlight only the most relevant
demographic and crime-specific factors. This is
particularly advantageous over baseline models,
which tend to generate less focused outputs. The
usage of Zero Shot Learning enables it to avoid
redundant or overly general information, result-
ing in outputs that are easier for stakeholders to
interpret and apply effectively.
• Fidelity: The model also performs well in terms
of accuracy offering explanation that resembles
the original data’s structure. CriX produces a
score of 3.51, whereas BERT based LLM has a
fidelity score of 2.45 and InLegalBERT, with a
score of 2.47. As a result, demographic features
of the crime are preserved with minimal distor-
tions while the outcomes maximally correspond
to real factors of crime. It also performs bet-
ter than other descriptively general models which
may offer wider but less specific picture, thus giv-
ing credence to the importance of CriX for policy
ICAART 2025 - 17th International Conference on Agents and Artificial Intelligence
722

Table 3: Performance Metrics of Few Language Models.
Large Language Model Compactness Fidelity Completeness Average Score
BERT + MistralAI 3.73 2.45 0.62 2.27
InLegalBERT + MistralAI 2.55 2.47 5 2.67
CriX (with zero shot learning) 4.03 3.51 5 4.18
and intervention.
• Completeness: CriX provides a more exten-
sive list of inputs, taking into account the socio-
economic and educational background which may
lead to crime. CriX outlines a completeness score
of 5, where as BERT based LLM only produces
a score 0.62, while InLegalBERT gives a score of
5. In contrast, general LLMs fail to capture such
larger demographic characteristics.
Each model provided textual explanations in re-
sponse to the prompt: “Give details how crime com-
mitted with IPC section IPC 1860 Section 378 hap-
pened in Mysuru on 02-02-2020.” The metrics cal-
culated on the explanation given by each model are
summarized in Table 3 for comparison. More specifi-
cally, it indicates that with respect to the three criteria
of Compactness, Completeness and Fidelity, CriX is
able to provide what the users may require with the
greatest precision and depth. This makes it most suit-
able for the task of crime pattern analysis as it shows
how the model utilises the demographic factors.
4.3 Explainable AI
Through the Explainable AI approach, the model pro-
duces easily comprehensible summaries. The most
critical demographic factors that impact the model are
identified to help attain a better understanding of the
areas with high crime rates. This interpretative ap-
proach would enable the law enforcement agencies
to grasp why some regions may be most vulnerable
to crimes in regard to conditions of demography. In
the current paper, Explainable AI (XAI) is integrated
using four fundamental concepts of justification, con-
trol, discovery and improvement to improve the pre-
dictive models for crime prediction.
• Justify: XAI is employed to ensure that crime
hotspot predictions are transparent and under-
standable. By using demographic factors such
as literacy rates, GDDP, and per capita income,
the model provides valid justification for its out-
puts. This helps stakeholders, such as law en-
forcement and policymakers, make data driven
decision backed by clear insights into influential
factors.
• Control: CriX ensures a high level of control over
the predictive process by enabling authorities to
manage and influence model interpretability and
decision-making. It allows parameters to be up-
dated dynamically, reflecting new policy initia-
tives or demographic shifts. This ensures that
the model’s explanations and predictive capabil-
ities remain relevant and adaptable to real-world
changes, empowering authorities to proactively
respond to emerging crime patterns.
• Discover: The discovery aspect of XAI uncov-
ers hidden correlations between demographic in-
dicators and crime occurrences. For example,
the analysis might reveal an unexpected link be-
tween declining HDI and increased crime rates
in specific districts. This insight-driven approach
helps expand the understanding of the multi-
faceted causes of crime and enables authorities
to design targeted social programs that address
these underlying issues, thus contributing to holis-
tic crime prevention.
• Improve: The iterative nature of XAI supports
continuous improvement in the model’s predictive
capabilities. By regularly reviewing which de-
mographic features most influence outcomes and
assessing the model’s interpretability, researchers
can refine the model’s training and enhance its
feature set. The iterative zero-shot learning feed-
back loop not only improves prediction accu-
racy but also helps guide future data collection to
strengthen the model’s overall effectiveness and
maintain its robustness over time.
5 CONCLUSIONS
This research successfully integrates spatial, tempo-
ral, and demographic factors to model and predict
crime hotspots in Karnataka, India, offering a novel
approach to crime analysis and prevention. By em-
ploying ST-DBSCAN for clustering and LSTM for
prediction, CriX demonstrates promising accuracy
in identifying crime-prone areas and time periods,
achieving a validation accuracy of over 82%. These
findings emphasise the impact of demographic factors
on criminal patterns, underscoring the potential for
targeted interventions. Furthermore, our LLM based
approach provides interpretability, explaining key de-
mographic influences on crime, and offering valu-
CriX: Intersection of Crime, Demographics and Explainable AI
723

able information for developing mitigation strategies.
By incorporating Explainable AI (XAI), CriX sets
a foundation for future advancements in predictive
policing and social policy, promoting data-driven so-
lutions to improve community safety. It enhances the
practical utility of the model by clarifying the influ-
ence of key demographic factors on crime. This trans-
parency empowers stakeholders to adopt evidence-
based policies and adapt crime prevention strategies
based on clearly interpretable results, making the
model’s findings actionable and trustworthy. Through
this multifaceted approach, the research aims to en-
hance crime prevention by identifying hotspots with
both spatial-temporal and demographic dimensions.
The proposed framework informs law enforcement
and policymakers about the conditions under which
crime is likely to occur, thus contributing to a more
holistic and effective approach to public safety in Kar-
nataka.
6 LIMITATIONS AND FUTURE
DIRECTIONS
6.1 Limitations
• Data Availability and Quality: The model’s ac-
curacy relies on the availability and quality of de-
mographic, spatial, and crime data. Incomplete or
biased data can limit its predictive capabilities.
• Generalisability: While the model is optimized
for Karnataka, applying it to other regions may
require extensive recalibration due to unique de-
mographic and spatial characteristics.
• Integration of Additional Socioeconomic In-
dicators: Future models can incorporate more
socioeconomic variables to deepen insights into
the relationship between demographic factors and
crime.
• Real-Time Crime Prediction: Extend the model
to handle real-time data streams, enabling live
monitoring and dynamic hotspot predictions for
proactive policing.
• Community-Centric Crime Prevention Strate-
gies: Develop actionable recommendations based
on model findings to inform community-level in-
terventions and policy decisions aimed at reduc-
ing crime rates, which helps in real estate and res-
idential purchases.
6.2 Future Directions
In future research, the LLM could be fine-tuned with
more comprehensive data from other states or even at
the national level to create a broader crime prediction
model applicable across India. This could facilitate
comparative studies across different regions and of-
fer valuable insights into the varying factors that con-
tribute to crime in different cultural and demographic
contexts. The inferences made highlight the potential
of LLMs to serve as valuable tools in crime preven-
tion, legal analysis, and policymaking. As we con-
tinue to refine and expand such models, their role in
advancing evidence-based solutions to societal chal-
lenges will become increasingly important.
Incorporating Graph RAG might improve retrieval
by structuring crime and demographic data as a graph,
capturing relationships between crime hotspots, de-
mographic factors and temporal data. This approach
improves context relevance by leveraging graph based
embeddings, enabling retrieval of interconnected in-
sights that traditional vector based methods might
miss.
REFERENCES
Beltagy, I., Lo, K., and Cohan, A. (2019). Scibert: A
pretrained language model for scientific text. arXiv
preprint arXiv:1903.10676.
Birant, D. and Kut, A. (2007). St-dbscan: An algorithm for
clustering spatial–temporal data. Data & knowledge
engineering, 60(1):208–221.
Bogomolov, A., Lepri, B., Staiano, J., Oliver, N., Pianesi,
F., and Pentland, A. (2014). Once upon a crime: to-
wards crime prediction from demographics and mo-
bile data. In Proceedings of the 16th international
conference on multimodal interaction, pages 427–
434.
Fan, W., Ding, Y., Ning, L., Wang, S., Li, H., Yin, D.,
Chua, T.-S., and Li, Q. (2024). A survey on rag meet-
ing llms: Towards retrieval-augmented large language
models. In Proceedings of the 30th ACM SIGKDD
Conference on Knowledge Discovery and Data Min-
ing, pages 6491–6501.
Government of Karnataka. https://data.opencity.in/
organization/government-of-karnataka.
Karnataka State Police. https://ksp.karnataka.gov.in/
firsearch/en.
Mandalapu, V., Elluri, L., Vyas, P., and Roy, N. (2023).
Crime prediction using machine learning and deep
learning: A systematic review and future directions.
IEEE Access, 11:60153–60170.
Marchant, R., Haan, S., Clancey, G., and Cripps, S. (2018).
Applying machine learning to criminology: semi-
parametric spatial-demographic bayesian regression.
Security Informatics, 7:1–19.
ICAART 2025 - 17th International Conference on Agents and Artificial Intelligence
724

Ng, R. T. and Han, J. (1994). Efficient and effective cluster-
ing methods for spatial data mining. In Proceedings
of VLDB, pages 144–155. Citeseer.
Paul, S., Mandal, A., Goyal, P., and Ghosh, S. (2023). Pre-
trained language models for the legal domain: a case
study on indian law. In Proceedings of the Nine-
teenth International Conference on Artificial Intelli-
gence and Law, pages 187–196.
Rai, N., Kumar, D., Kaushik, N., Raj, C., and Ali, A.
(2022). Fake news classification using transformer
based enhanced lstm and bert. International Journal
of Cognitive Computing in Engineering, 3:98–105.
Ramirez-Alcocer, U. M., Tello-Leal, E., and Mata-Torres,
J. A. (2019). Predicting incidents of crime through
lstm neural networks in smart city domain. In The
Eighth International Conference on Smart Cities, Sys-
tems, Devices and Technologies, pages 32–37.
VM, K., Warrier, H., Gupta, Y., et al. (2024). Fine tun-
ing llm for enterprise: Practical guidelines and rec-
ommendations. arXiv preprint arXiv:2404.10779.
Wheeler, A. P. and Steenbeek, W. (2021). Mapping the risk
terrain for crime using machine learning. Journal of
Quantitative Criminology, 37:445–480.
Xu, X., Ester, M., Kriegel, H.-P., and Sander, J. (1998). A
distribution-based clustering algorithm for mining in
large spatial databases. In Proceedings 14th Interna-
tional Conference on Data Engineering, pages 324–
331. IEEE.
Zhuang, Y., Almeida, M., Morabito, M., and Ding, W.
(2017). Crime hot spot forecasting: A recurrent model
with spatial and temporal information. In 2017 IEEE
International Conference on Big Knowledge (ICBK),
pages 143–150. IEEE.
CriX: Intersection of Crime, Demographics and Explainable AI
725
