
Automatic Detection of the Driver Distractions Based on the Analysis of
Face Videos
Artur Urz˛edowski and Kazimierz Choro
´
s
a
Department of Applied Informatics, Wrocław University of Science and Technology, Wyb. Wyspia´nskiego 27, 50-386
Wrocław, Poland
Keywords:
Driver Fatigue State, Driver Drowsiness Detection, Driver Distraction, Driver Conversing and Eating,
Daylight and Nightlight Conditions, Face Analysis.
Abstract:
The objective of the paper is to propose a new driver fatigue detection method using Percentage of Mouth
Openness (POM) and Percentage of Eye Closure (PERCLOS) as well as to show its robustness across vari-
ous real-world conditions. The openness of the eyes and mouth was determined by calculating Aspect Ratios
(AR) and checking if AR exceeded a given threshold. Six videos simulated different driving scenarios were
recorded to test detection performance under diverse lighting, with and without corrective glasses, moreover
with additional complexities such as blinking lights. Furthermore, the method ensures avoidance of misclas-
sification during such driver’s activities as conversing and eating. The method effectively detects fatigue in all
test scenarios in which the fatigue state occurred.
1 INTRODUCTION
According to the European General Safety Reg-
ulation (European Parliament and Council, 2019),
vehicle manufacturers are obliged to implement
ADDW (Advanced Driver Distraction Warning) sys-
tems in all new vehicles from July 2024 (Regulation
32019R2144, 2019). Its goal is to drastically reduce
the number of accidents related to distraction, mainly
fatal accidents and serious injuries. ADDW systems
are able to warn drivers when they are distracted and
to stimulate drivers to pay more attention to the traf-
fic situation and to warn about dangerous incidents
on the road. These systems include warnings such as
(Laxton et al., 2022) (Fu et al., 2024):
• driver drowsiness and attention warning – analy-
sis of vehicle systems and driver warnings when
necessary;
• lane departure warning system – warning when
the vehicle is drifting out of its travel lane;
• advanced emergency braking system – automatic
detection of a potential collision and activation the
vehicle braking system to decelerate the vehicle
with the purpose of avoiding or mitigating a colli-
sion;
a
https://orcid.org/0000-0001-6969-976X
• emergency lane-keeping system – assistance of
the driver in keeping a safe position of the vehi-
cle with respect to the lane or road boundary to
avoid a collision;
• driver availability monitoring system – assessing
whether the driver is in a position to take over the
driving function from an automated vehicle in par-
ticular situations.
The ADDW systems focus on detecting visual dis-
tractedness in order to provide timely warnings to
the driver. They should trigger an alert by display-
ing a light on the car instrument panel or produce an
adequate warning sound. Driver monitoring can be
achieved through a driver-facing camera embedded in
the steering wheel or instrument cluster. The most
popular solutions of driver monitoring are to track
driver eye movements and gaze directions, as well as
to observe the head and its strange rotations. There
is a strong correlation between head and eye move-
ments. By combining eye movement tracking and
head tracking, it is possible to detect drowsiness, for
example, when the driver is tired or intoxicated (e.g.
after drinking alcohol), the head drops down or eyes
are closed or barely opened. The cameras installed
inside the vehicles play a key role in detecting and
analyzing potential dangers to the driver. The meth-
ods generally perform well in normal daylight condi-
tions, accurately detecting the onset of driver fatigue,
542
Urze¸dowski, A. and Choro
´
s, K.
Automatic Detection of the Driver Distractions Based on the Analysis of Face Videos.
DOI: 10.5220/0013316300003912
Paper published under CC license (CC BY-NC-ND 4.0)
In Proceedings of the 20th Inter national Joint Conference on Computer Vision, Imaging and Computer Graphics Theory and Applications (VISIGRAPP 2025) - Volume 2: VISAPP, pages
542-549
ISBN: 978-989-758-728-3; ISSN: 2184-4321
Proceedings Copyright © 2025 by SCITEPRESS – Science and Technology Publications, Lda.

but some obstructions occur with additional complex-
ities such as blinking lights. In addition, yawning
should be distinguished from openness and closure of
the mouth while talking or eating.
The goal of the paper is to verify the efficiency
of the algorithms of distractedness detection by an-
alyzing the videos recorded by a camera under var-
ious real-world conditions: i.e. in day and night
conditions, driver both with and without corrective
glasses, and during activities such as conversing and
eating. These evaluations aim to highlight the relia-
bility of the algorithms in practical scenarios, provid-
ing insights into their potential deployment in modern
driver-assistance systems.
The paper is structured as follows. The next
section describes related work on methods for au-
tomatic detection of driver distractions. The third
section presents the method for detecting mouth and
eye openness. The next section discusses the prob-
lem of threshold estimation. The proposed approach
is described in the fifth section. The next section
presents the results of the tests performed on real
videos recorded in various real-world conditions. The
final conclusions are presented in the last section.
2 RELATED WORK
2.1 Methods Based on Artificial Neural
Networks
(Dwivedi et al., 2014) developed a system using a
Convolutional Neural Network (CNN) to capture la-
tent facial features and implemented a SoftMax layer
to classify driver drowsiness. They created a dataset
with 30 subjects of varying skin tones and eye sizes,
under diverse lighting conditions to simulate real-
world scenarios. Subjects played an open-source
avoidance game while their faces were recorded,
achieving accuracy of 92.33% on the validation set.
The algorithm was also tested on new subjects, yield-
ing an average accuracy of 78%.
(Zhao et al., 2020) developed a Multi-Task Cas-
caded Convolutional Neural Network (MTCCN) sys-
tem to detect facial features like the face, nose, mouth,
and eyes. This system uses CNNs to determine
whether eyes and mouth are open or closed, assess-
ing driver fatigue through eye closure (PERCLOS –
Percentage of Eye Closure) and mouth closure (POM
– Percentage of Mouth Openness) metrics. Eye clo-
sure above 0.25 and mouth closure above 0.5 indicate
potential fatigue. They used a dataset from Biteda,
featuring 4,000 real-world driving images categorized
by eye and mouth states. The system achieved accu-
racy of 93.62%, sensitivity of 93.64%, and specificity
of 60.89%.
(Chirra et al., 2019) developed a drowsiness detec-
tion system based on eye analysis. Using the Viola-
Jones algorithm, they identify the face and eye regions
from video frames, which are then analyzed by a 4-
layer CNN that classifies images as drowsy or non-
drowsy. Their dataset of 2,850 images (1,450 drowsy,
1,400 non-drowsy) was split into training, validation,
and testing sets. The method achieved accuracy of
96.42% on the test data.
(Rajkar et al., 2022) developed a deep learning
system for driver drowsiness detection using OpenCV
for video streaming. Haar cascade classifier was used
to detect the region of the face and eyes. A CNN
classified whether the eyes and mouth were open or
closed over time. If eye closure or mouth openness
exceeded a threshold, the system alerted the driver.
The authors used the YawDD and Closed Eyes In The
Wild datasets. They have used 80% of the data for
training and 20% for testing, the system achieved ac-
curacy of 97.9% for eye classification and 95.76% for
yawning classification.
(Vijaypriya and Uma, 2023) developed a Multi-
Scale CNN system for detecting drowsiness, using
Dlib to detect facial points from video frames. Each
frame was denoised with Cross Guided Bilateral fil-
tering and wavelet transformation before feature ex-
traction. Multi-scale CNNs was used to classify pat-
terns for drowsiness detection. The YAWDD and
NTHUDDD datasets were split 80% for training and
20% for testing. The system achieved accuracy of
98.38%, precision 97.67%, and recall of 97.85% on
YAWDD, and accuracy of 98.26%, precision 99.45%,
and recall of 98.11% on NTHUDDD, outperforming
other methods.
(Yang et al., 2024) created a driver drowsiness
detection method called VBFLLFA (Video-Based
Driver Drowsiness Detection using Facial Landmarks
and Local Facial Areas). This approach was de-
signed to detect drowsiness by analyzing key facial
features. By analyzing regions around the eyes and
mouth, the model captured movement patterns indica-
tive of drowsiness. They used the Common Spatial
Pattern (CSP) algorithm to enhance the differentia-
tion between sample classes and to lower the model’s
computational complexity when analyzing each sam-
ple. They have designed two-branch multi-head at-
tention (TB-MHA) to extract features. The Multi-
layer Perceptron was used to make the final classifica-
tion of drowsiness. The authors have used three dif-
ferent datasets, the Video-Based Driver Drowsiness
Detection (VBDDD) dataset specifically created for
Automatic Detection of the Driver Distractions Based on the Analysis of Face Videos
543
this study, the Yawning Detection Dataset (YawDD),
and the National Taiwan University Driver Drowsi-
ness Detection (NTHU-DDD). The proposed method-
ology achieved average accuracy of 88.37%, preci-
sion of 0.90, recall of 0.92, and F1-score of 0.91 .
(Cichocka and Ruminski, 2024) created a method
for the detection of drowsiness based on analysis of
Mouth Aspect Ratio (MAR) and Eye Aspect Ratios
(EAR). Fristly Haar’s cascade classifiers were used to
detect face and region of eyes. Convolutonal Neural
Network has been used to perform the final drowsi-
ness classification. They have trained the model using
MRL Eye Dataset which contains images of closed
and opened eyes. Then the model was tested on
the Drowsiness dataset (Perumandla, 2020) achieving
precision, recall, accuracy, and F1-score of 94%.
2.2 Other Machine Learning Methods
(Mandal et al., 2016) developed a bus driver monitor-
ing system with seven modules: head-shoulder detec-
tion, face detection, eye detection, eye openness esti-
mation, fusion, drowsiness measure (PERCLOS), and
fatigue level classification. The system uses existing
in-vehicle cameras, making extra hardware unneces-
sary. It first detects the driver’s head and shoulders,
and then uses two models to detect the face. Eye
detection was followed by estimation of eye open-
ness and finally PERCLOS was calculated to measure
drowsiness. The algorithm was trained on real-world
bus driver videos, with simulations involving 23 par-
ticipants, including those wearing glasses, under var-
ious lighting conditions.
(Saradadevi and Bajaj, 2008) developed a fatigue
detection system based on analysis of mouth and
yawning. Using a Viola-Jones classifier, they track
the driver’s mouth and then apply SVM to classify
yawning. From over 1,000 collected images, they
trained on yawning and normal images, achieving ac-
curacy of 86% for normal images and 81% for yawn-
ing.
(Bakheet and Al-Hamadi, 2021) developed a
drowsiness detection system that uses adaptive his-
togram equalization to enhance image contrast, a
Haar AdaBoost classifier for face detection, and
an active shape model (ASM) to locate the eyes.
HOG features are extracted from the eyes, and a
Naïve Bayes classifier predicts eye status. Tested
on the NTHU Driver Drowsiness Detection dataset,
which includes various lighting conditions and sub-
jects with bare faces, glasses, and sunglasses, the
system achieved accuracy of 85.62%, F1-score of
87.84% for drowsiness, and F1-score of 81.09% for
non-drowsiness.
(Tang and Guo, 2024) proposed a method of de-
tecting driver fatigue by using infrared cameras and
classification using Yolov8n + transfer learning. Due
to the lack of a publicly available dataset of the face
made by infrared cameras, the new dataset was specif-
ically developed for this study. In each frame, the
model classifies whether the mouth and eyes were
closed or opened. The authors implemented the
method of fatigue detection based on Percentage of
Mouth Openness (POM) and Percentage of Eye Clo-
sure (PERCLOS). They were checking the 60 seconds
of the video and checking if the POM and PERCLOS
exceeded their thresholds. The method achieved ac-
curacy of 98% of fatigue detection.
3 MAR, LEAR, REAR FACTORS
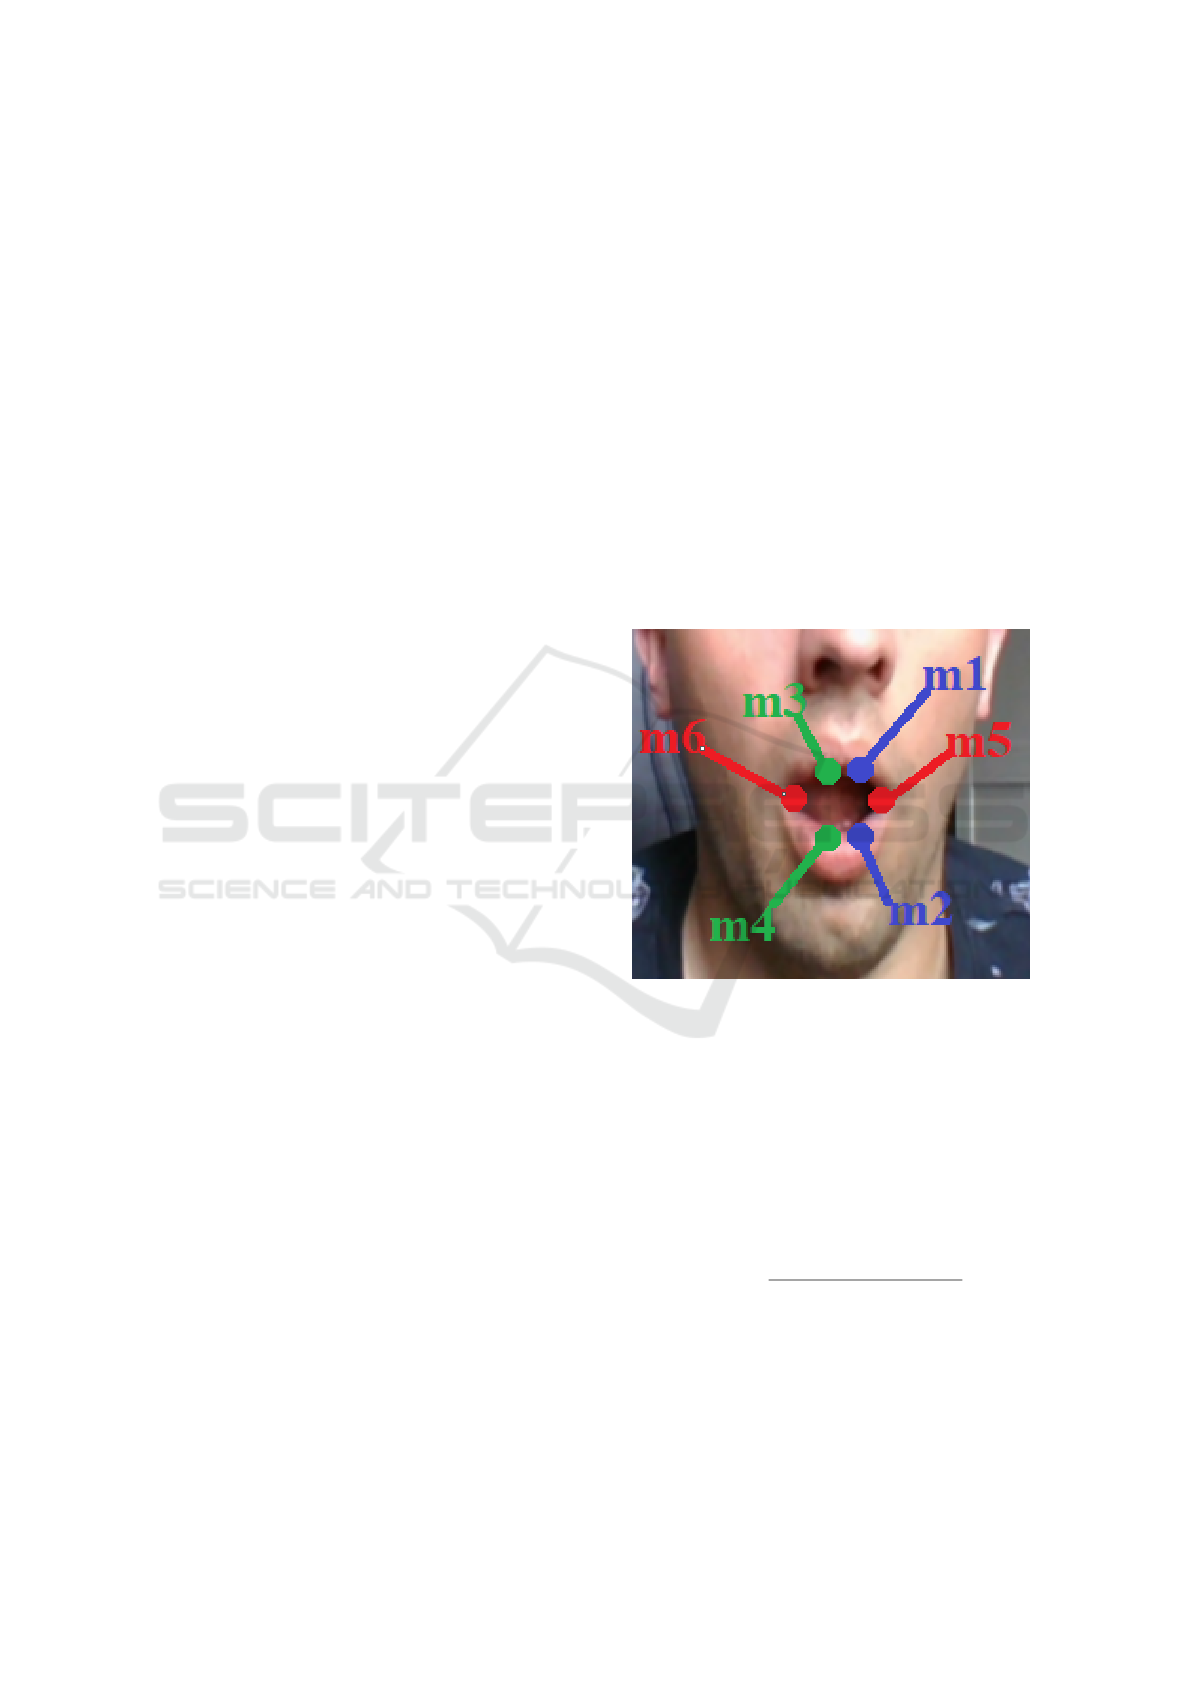
Figure 1: Mouth landmarks.
Based on the preliminary research, it was decided
in our further experiments to use Mouth Aspect
Ratio (MAR) and Left/Right Eye Aspect Ratios
(LEAR/REAR) to classify the mouth and eyes open-
ness. MAR is calculated by summing the distance
between two points of the inner lips and the distance
between two points of the outer lips. Then the sum is
divided by the distance between mouth corners multi-
plied by 2 (Figures 1 and 2).
MAR =
∥m
1
− m
2
∥ + ∥m
3
− m
4
∥
2 · ∥m
5
− m
6
∥
(1)
where:
• MAR - mouth aspect ratio,
• m
1
...m
6
- mouth landmarks position.
The LEAR (analogously REAR) factors are cal-
VISAPP 2025 - 20th International Conference on Computer Vision Theory and Applications
544
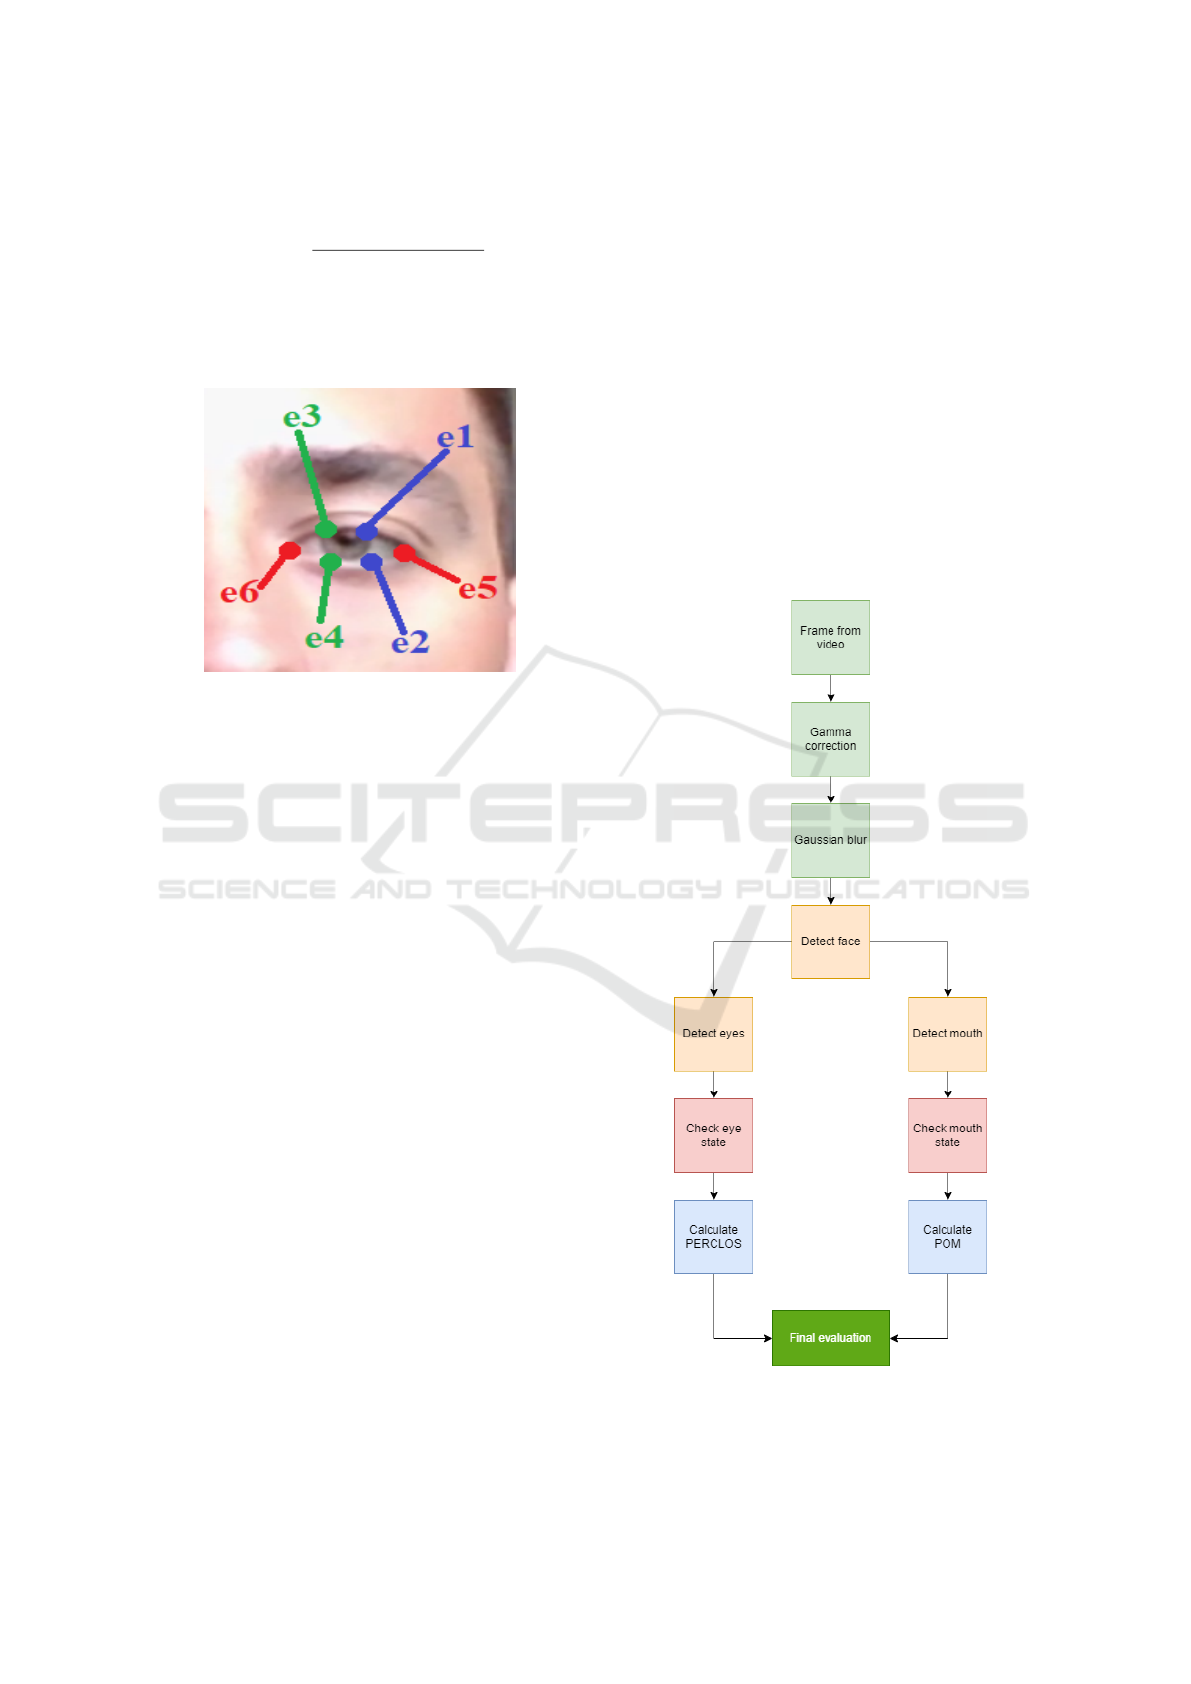
culated in similar way as MAR.
LEAR =
∥e
1
− e
2
∥ + ∥e
3
− e
4
∥
2 · ∥e
5
− e
6
∥
(2)
where:
• LEAR - Left eye aspect ratio,
• e
1
...e
6
- Eye landmarks position.
Figure 2: Left eye landmarks.
Multiple tests have been performed to analyze
the Mouth Aspect Ratio and Eye Aspect Ratio while
performing different actions. The tests consisted of
capturing the frames from the desktop camera and
simulating different scenarios such as talking, eat-
ing, yawning, blinking, and normal state. Perform-
ing these tests allowed us to estimate MAR and EAR
thresholds. It was discovered that a person had closed
their eyes when the EAR was smaller or equal to 0.19,
therefore this value was selected as the EAR thresh-
old. A more challenging threshold estimation was
for the mouth aspect ratio, as the mouth aspect ratio
must be considered when the person is talking, eat-
ing, and yawning. All of these actions involve mouth
openness, making the MAR value higher. It has been
found that when the person is talking or eating the
MAR does not exceed 0.4, therefore this value was
set as the MAR threshold.
4 PERCLOS AND POM FACTORS
Fatigue detection checks whether the eye and mouth
are closed or open. Since constant blinking and fre-
quent yawning may suggest a fatigued state, the sys-
tem checks the 120 seconds and analyzes the frequen-
cies of eye closure and mouth openness. Each frame
comes with some time interval. This time interval
is then used to check if the PERCLOS or the POM
thresholds are exceeded or not. The Percentage of
Eye Closure (PERCLOS) checks the eyes state on
each frame and assigns the check result to it. After
that the system checks if the PERCLOS threshold has
been exceeded by summing all time intervals of the
frames where both eyes were closed. If the sum ex-
ceeds the PERCLOS threshold, the system will alert
about the fatigue state.
A similar logic was assigned to calculate the
Percentage of Mouth Openness (POM). The system
checks all frames in a given time period (120 seconds)
and sums all time intervals of the frames where the
mouth was opened (which may suggest yawning). If
the sum exceeds the POM threshold the system will
alert about the fatigue state.
5 PROPOSED APPROACH
Figure 3: Diagram of the drowsiness detection algorithm.
The diagram (Figure 3) shows how the drowsiness de-
Automatic Detection of the Driver Distractions Based on the Analysis of Face Videos
545

tection algorithm works. Two additional image pro-
cessing steps are performed after capturing the frame
from the camera. Firstly, the brightness of the image
is adjusted by using gamma correction:
V
out
= V
γ
in
(3)
The γ is set to
1
2.5
(Setiawan et al., 2022). The
Gaussian blur is then used to smooth the image and
reduce the noise. Gaussian blur is based on the Gaus-
sian function that determines the weights of the blur
effect (Desai et al., 2020):
G(x, y) =
1
2πσ
2
e
−
x
2
+y
2
2σ
2
(4)
where:
• x, y - coordinates of a pixel relative to the center
of the blur area,
• σ - standard deviation, which controls the spread
of the blur.
Those two additional image processing steps help
the frontal face detector to detect faces in low-light
images. Then, the Dlib package is used on each frame
to detect the face and key landmarks such as mouth
points and eye points. The authors have used the
shape-predictor-68-face-landmarks model which was
trained on iBUG 300-W face landmark dataset. The
dataset consists of several thousand labeled images
covering a wide range of ethnicities, ages, and gen-
ders (Kazemi and Sullivan, 2014).
Next the mouth aspect ratio (MAR), left eye as-
pect ratio (LEAR) and right eye aspect ratio (REAR)
are calculated. The openness or closure was deter-
mined by the threshold, if AR exceeded the given
threshold the mouth/eye was classified as open, oth-
erwise, it was classified as closed. Then we calculate
two factors PERCLOS and POM. Having these values
we can evaluate if the person is fatigued or not.
6 TESTING
To thoroughly examine the system’s performance un-
der various conditions, several tests have been de-
signed. A series of six videos have been created, each
lasting seven minutes, recorded under different light-
ing conditions, with and without corrective glasses.
These videos are created to simulate real-world driv-
ing scenarios and to test the system’s ability to detect
the driver’s fatigue state. The first video is recorded
in normal daylight conditions, providing a baseline
scenario where the lighting is consistent and natural.
This video is intended to test the functionality of the
system under optimal driving conditions. The second
video is recorded under similar daylight conditions
but with the driver wearing corrective glasses. This
setup aims to evaluate whether the glasses have any
impact on the system’s performance and its ability to
detect fatigue. The third video shifts to a more chal-
lenging environment by being recorded under night-
light conditions. This scenario tests the system’s per-
formance in low-light situations, which are common
during nighttime driving and can significantly affect
the detection algorithms. The fourth video is recorded
under nightlight conditions with additional complex-
ity: a blinking bright screen is used to imitate the ef-
fect of passing car lights. This setup is designed to
test the system’s robustness in handling sudden and
intermittent light changes, which can be distracting
and may affect the drowsiness detection. The fifth
video is recorded in normal daylight conditions, but
the driver is eating. This scenario tests whether the
proposed methodology is capable of distinguishing
yawning from chewing food. The sixth video is also
recorded in normal daylight conditions, but the driver
is talking. This setup is designed to check the ability
to differentiate between conversation and yawning.
Each of these videos is divided into three distinct parts
to simulate different states of the driver. In the first
part, the driver simulated a non-fatigue state, main-
taining a normal state and vigilance. This serves as
the control segment, where the system should ideally
detect no signs of fatigue. In the second part, lasting
for two minutes, the driver began to blink more fre-
quently and yawn, simulating a state of fatigue. This
is the critical segment where the system’s ability to
detect fatigue and issue alerts is tested. Finally, in the
third part, the driver returned to a normal state.
The purpose of this structured simulation is to as-
sess whether the system can accurately detect the on-
set of fatigue, alert the driver in a timely manner, and
then stop the alerts once the fatigue state is no longer
present. By doing so, the system’s efficiency in main-
taining driver alertness and safety can be thoroughly
evaluated. These tests are crucial to ensure that the
system can adapt to various real-world conditions and
reliably support the driver in maintaining a high level
of alertness, thus enhancing overall road safety. In
each of the charts, the red line represents the simu-
lated state, and the blue line represents the state de-
tected by the system.
6.1 Daylight Conditions Without
Corrective Glasses
The first video provides a baseline scenario for
the testing phase, serving a controlled environment
to evaluate the system’s performance. This video
VISAPP 2025 - 20th International Conference on Computer Vision Theory and Applications
546
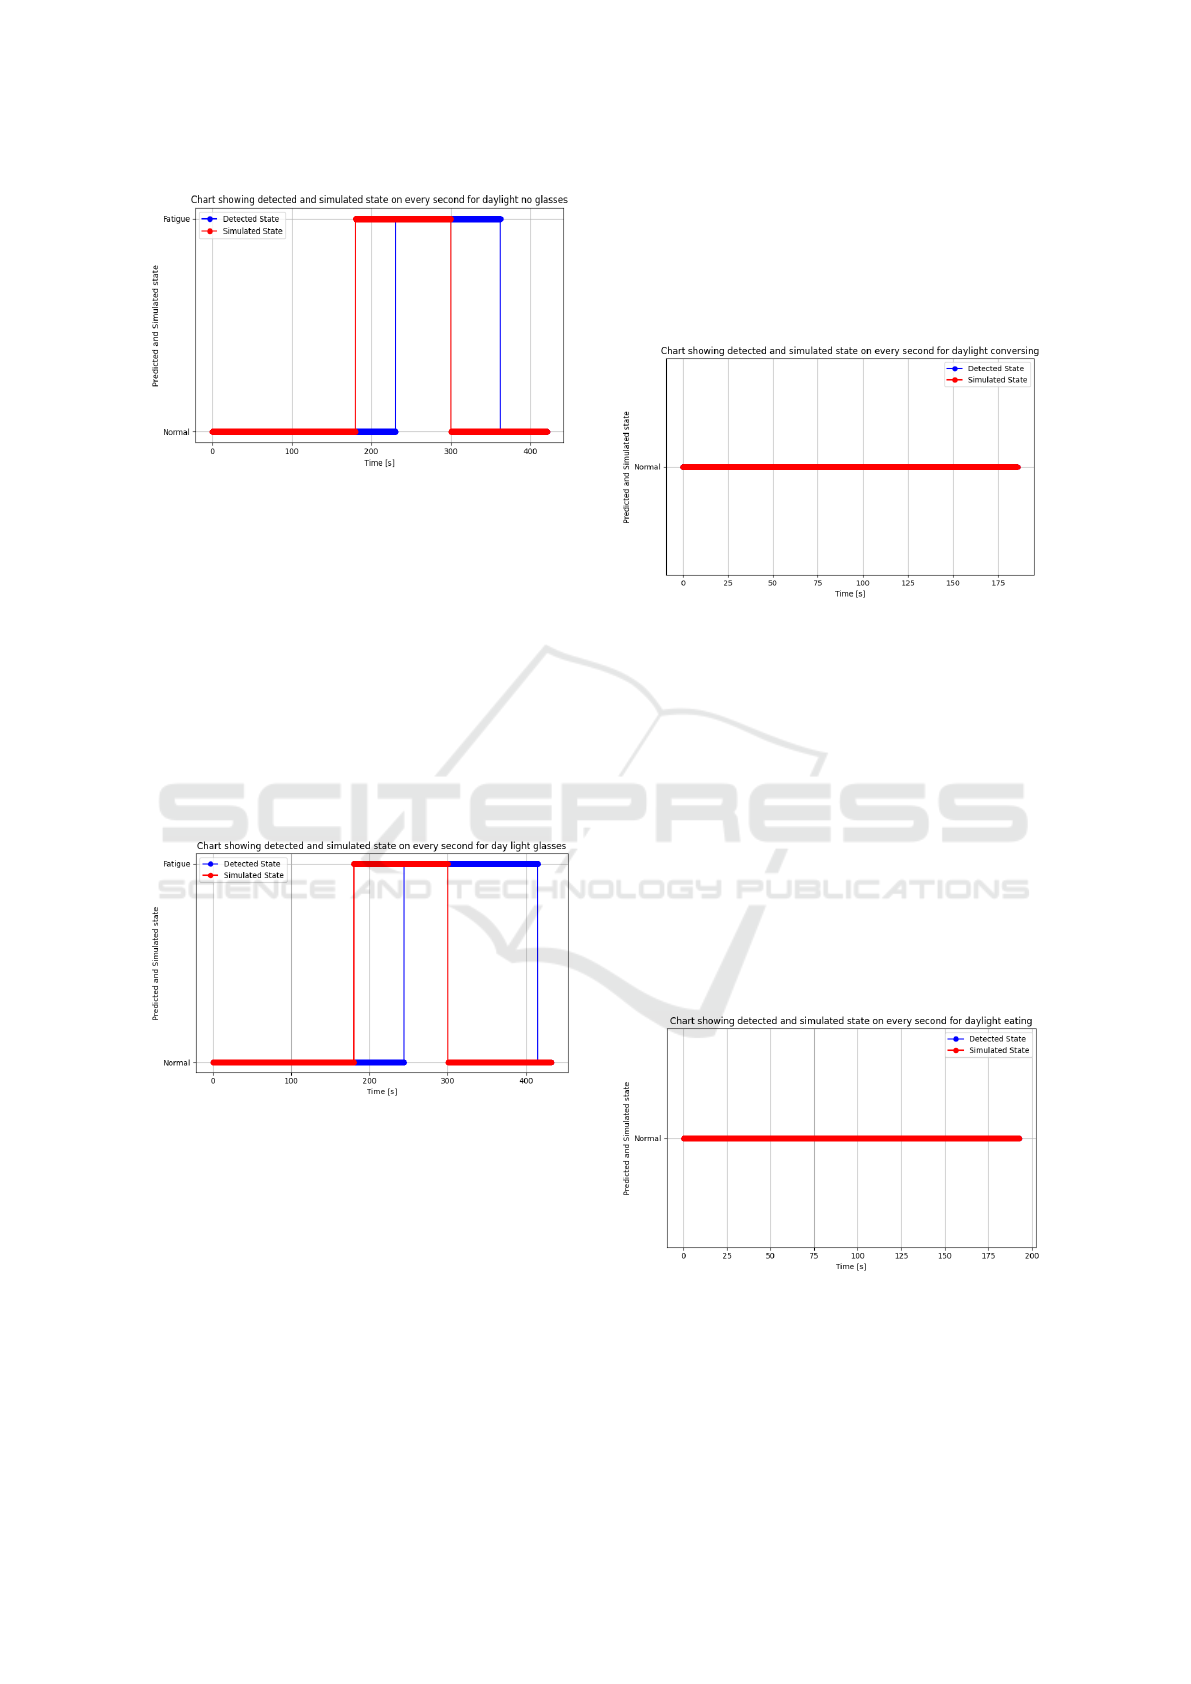
Figure 4: Chart showing detected and simulated state for
video with daylight conditions without corrective glasses.
was recorded in natural daylight without corrective
glasses. This scenario ensures minimal interference
from external variables that could affect the system’s
accuracy. Figure 4 shows the simulation of the fa-
tigue state which started at 180 seconds of the video
and stopped at 300 seconds. The system detected the
fatigue state at 236 seconds and stopped detecting it
at 352 seconds of the video.
6.2 Daylight Conditions with Corrective
Glasses
Figure 5: Chart showing detected and simulated state for
video with daylight conditions with corrective glasses
The second video introduces a new variable to the
baseline scenario by adding corrective glasses. This
is designed to evaluate the system’s ability to detect
fatigue when visual obstructions or distortions caused
by the glasses are present. Figure 5 shows a graphical
representation of the result, similarly, as before the fa-
tigue state has been simulated after third minute and
lasts for the next two minutes. The system detected
a fatigue state at 244 seconds and stopped detecting
it at 415 seconds of the video. Even though the sys-
tem detected the fatigue and returned to normal, the
duration was extended. Comparing these results with
the baseline scenario suggests that corrective glasses
may increase the system’s detection latency and false-
positive duration.
6.3 Daylight Conversing
Figure 6: Chart showing detected and simulated state for
video with daylight conditions while conversing.
The third video was also taken in normal daylight
conditions but the subject was talking with another
person. Figure 6 shows a graphical result of this sce-
nario. The video is three minutes long, the fatigue
state was not simulated, and the system has not de-
tected it either. However, despite the physical move-
ment of the mouth during the conversation, the system
did not determine that such activity met its threshold
to recognize a fatigue state. This indicates the ability
to differentiate between ordinary facial activities and
fatigue-related indicators.
6.4 Daylight Eating
Figure 7: Chart showing detected and simulated state for
video with daylight conditions while eating.
The fourth video was taken in daylight conditions
and the subject was eating for three minutes without
simulating the fatigue state. This scenario checks if
the system detects such activity as fatigue. Figure 7
Automatic Detection of the Driver Distractions Based on the Analysis of Face Videos
547
shows a graphical representation of the detection re-
sult. Those findings demonstrate that the system oper-
ates effectively in this real-world scenario, as it accu-
rately retained from detecting any fatigue state during
this activity. Even though eating involves noticeable
mouth movements, the system did not classify such
activity as a fatigue state. This highlights the sys-
tem’s ability to distinguish between context-specific
facial movements and the physiological signs associ-
ated with fatigue such as yawning. The system proved
once more its robustness and reliability in a real-world
scenario.
6.5 Nightlight Conditions
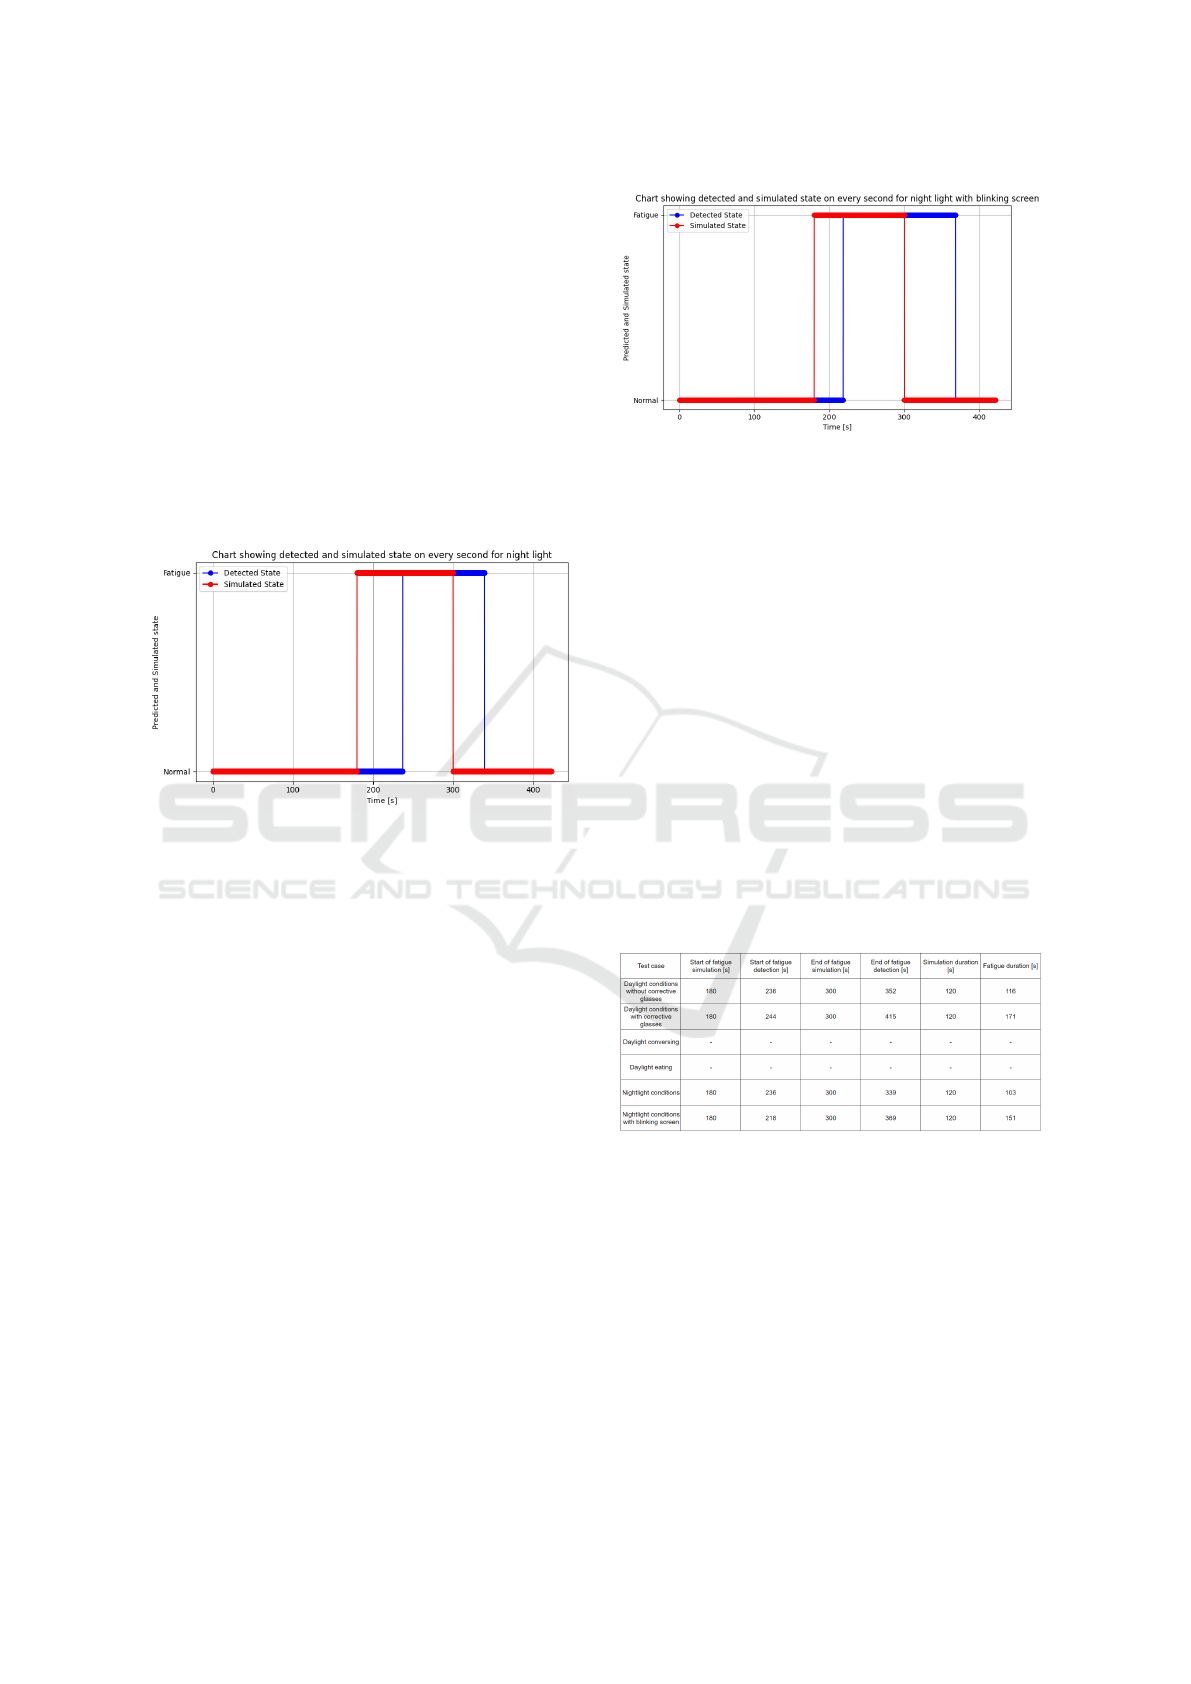
Figure 8: Chart showing detected and simulated state for
video with nightlight condition.
This video was recorded in nightlight conditions and
the subject did not wear corrective glasses during
recording to ensure that the system was tested without
interference from reflective surfaces. Figure 8 shows
the detected and simulated state from the recording.
Similarly, as before when fatigue was simulated, the
subject started the simulation after third minute and
finished the simulation after two minutes. The system
detected a fatigue state at 236 seconds and stopped
detecting at 339 seconds of the video. This scenario
demonstrates the system’s capability to detect fatigue
states even in challenging lighting conditions. These
findings underscore the robustness of the system in
maintaining reliable performance in low-light envi-
ronments. This highlights its potential utility in night-
time scenarios without the usage of infrared cameras.
6.6 Nightlight Conditions with Blinking
Screen
This video was recorded in nightlight conditions and
the subject did not wear corrective glasses. This sce-
nario introduces a blinking screen to simulate the ef-
fect of passing car lights. The aim was to replicate
Figure 9: Chart showing detected and simulated state for
video with nightlight condition with blinking light.
a common-world scenario such as driving at night,
where intermittent light sources may influence visual
clarity and fatigue detection. Figure 9 shows a graph-
ical result of the detection. The fatigue simulation
started in the third minute and lasted for the next two
minutes. The system detected a fatigue state at 218
seconds of the video and stopped detecting it at 369
seconds. The accurate detection of fatigue under these
conditions demonstrates the robustness and reliabil-
ity of the system. Importantly, the blinking screen
did not cause any false positives in the accuracy of
the system, indicating its resilience to environmental
lighting fluctuations. This result showcases the sys-
tem’s potential in scenarios where users are exposed
to different lighting conditions.
6.7 General Results
Table 1: Detection results for different test scenarios.
Table 1 shows results for different test scenarios with
simulation duration and fatigue duration. In tests 6.1,
6.2, 6.5, and 6.6 the blue line (fatigue detection) is
shifted to the right. This is expected behavior since
the system checks the 120 seconds and then examines
whether the threshold has been exceeded. The same
applies to the time after the simulation of the fatigue
state when the system still detects drowsiness even
when it was not simulated. This phenomenon results
from the inertia of the detection process.
VISAPP 2025 - 20th International Conference on Computer Vision Theory and Applications
548

7 CONCLUSIONS
The results indicate that the system performs effec-
tively in both daylight and nightlight scenarios, accu-
rately identifying fatigue states when they were simu-
lated. These results suggest that the method is robust
and reliable, even in the presence of corrective eye-
wear. Importantly, the system also demonstrated its
ability to ignore non-fatigue activities, such as con-
versing and eating, under daylight conditions, further
confirming its accuracy and relevance in real-world
driving scenarios. Nightlight conditions presented a
more challenging environment, yet the system still
detected fatigue with similar accuracy, even with the
presence of fluctuating light sources, such as a blink-
ing screen simulating passing car lights. These find-
ings show that the method holds promise for practical
applications in driver monitoring systems, especially
in varying environmental conditions.
In conclusion, this fatigue detection method has
the potential to significantly improve road safety by
providing a reliable real-time solution to identify fa-
tigued drivers. Further research and testing can be
conducted to refine the response times and adapt-
ability of the system to other driving scenarios, but
the results indicate a strong foundation for future de-
velopment. In addition, the authors plan to conduct
broad research to compare the presented method with
other existing SOTA methods, ensuring a comprehen-
sive evaluation of its performance and potential ad-
vantages. Furthermore, the authors intend to test the
performance of the system under dynamic lighting
changes to assess its robustness and reliability in vary-
ing environmental conditions.
REFERENCES
Bakheet, S. and Al-Hamadi, A. (2021). A framework for in-
stantaneous driver drowsiness detection based on im-
proved hog features and naïve bayesian classification.
Brain Sciences, 11(2):240.
Chirra, V. R. R., Uyyala, S. R., and Kolli, V. K. K.
(2019). Deep cnn: A machine learning approach for
driver drowsiness detection based on eye state. Rev.
d’Intelligence Artif., 33(6):461–466.
Cichocka, S. and Ruminski, J. (2024). Driver fatigue detec-
tion method based on facial image analysis. In 2024
16th International Conference on Human System In-
teraction (HSI), pages 1–6. IEEE.
Desai, B., Kushwaha, U., Jha, S., and NMIMS, M. (2020).
Image filtering-techniques algorithms and applica-
tions. Applied GIS, 7(11):970–975.
Dwivedi, K., Kumar, B., and Sethi, A. (2014). Drowsy
driver detection using representation learning. In 2014
IEEE International Advance Computing Conference
(IACC), pages 995–999. IEEE.
European Parliament and Council (2019). Regulation (EU)
2019/2144 of the European Parliament and of the
Council of 27 November 2019. https://eur-lex.eur
opa.eu/eli/reg/2019/2144/oj. Accessed: 2024-11-06.
Fu, B., Boutros, F., Lin, C.-T., and Damer, N. (2024). A
survey on drowsiness detection – modern applications
and methods. IEEE Transactions on Intelligent Vehi-
cles, doi: 10.1109/TIV.2024.3395889.
Kazemi, V. and Sullivan, J. (2014). One millisecond face
alignment with an ensemble of regression trees. In
Proceedings of the IEEE conference on computer vi-
sion and pattern recognition, pages 1867–1874.
Laxton, V., Oliveira, E., Stuttard, N., Avis, A., and Hosten,
P. (2022). Technical support to assess the upgrades
necessary to the advanced driver distraction warning
systems. Final report. European Commission, Brus-
sels. https://trl.co.uk/uploads/trl/documents/XPR118
---Technical-support-to-assess-the-upgrades-neces
sary-to-the-advanced-driver-distraction-warning-sys
tems-(6).pdf.
Mandal, B., Li, L., Wang, G. S., and Lin, J. (2016). Towards
detection of bus driver fatigue based on robust visual
analysis of eye state. IEEE Transactions on Intelligent
Transportation Systems, 18(3):545–557.
Perumandla, D. (2020). Drowsiness dataset, Kaggle.
https://www.kaggle.com/datasets/dheerajperumandla/
drowsiness-dataset/data. Accessed: 2024-11-11.
Rajkar, A., Kulkarni, N., and Raut, A. (2022). Driver
drowsiness detection using deep learning. In Applied
Information Processing Systems: Proceedings of IC-
CET 2021, pages 73–82. Springer.
Saradadevi, M. and Bajaj, P. (2008). Driver fatigue de-
tection using mouth and yawning analysis. Interna-
tional journal of Computer science and network secu-
rity, 8(6):183–188.
Setiawan, W., Suhadi, M. M., Pramudita, Y. D., et al.
(2022). Histopathology of lung cancer classi-
fication using convolutional neural network with
gamma correction. Commun. Math. Biol. Neurosci.,
2022:Article–ID.
Tang, X.-X. and Guo, P.-Y. (2024). Fatigue driving de-
tection methods based on drivers wearing sunglasses.
IEEE Access.
Vijaypriya, V. and Uma, M. (2023). Facial feature-based
drowsiness detection with multi-scale convolutional
neural network. IEEE Access, 11:63417–63429.
Yang, L., Yang, H., Wei, H., Hu, Z., and Lv, C. (2024).
Video-based driver drowsiness detection with opti-
mised utilization of key facial features. IEEE Trans-
actions on Intelligent Transportation Systems.
Zhao, Z., Zhou, N., Zhang, L., Yan, H., Xu, Y., and Zhang,
Z. (2020). Driver fatigue detection based on convolu-
tional neural networks using em-cnn. Computational
intelligence and neuroscience, 2020(1):7251280.
Automatic Detection of the Driver Distractions Based on the Analysis of Face Videos
549
