
Multilabel Classification of Otoscopy Images in Deep Learning for
Detailed Assessment of Eardrum Condition
Antoine Perry
1
, Ilaria Renna
2 a
, Florence Rossant
1 b
and Nicolas Wallaert
3
1
ISEP, 28 Rue Notre Dame des Champs, 75006 Paris, France
2
Department of Economics and Management, University of Trento, via Vigilio Inama 5, 38122 Trento, Italy
3
MyMedicalAssistant SAS, 5 Bis Cours Anatole France, 51100 Reims, France
fl
Keywords:
Otoscopy Imaging, Multi-Label, Convolutional Neural Network.
Abstract:
This study presents a ResNet50-based CNN framework for multi-label classification of eardrum images, fo-
cusing on a detailed diagnosis of otologic disorders. Unlike prior studies centered on common pathologies,
our approach explores less common eardrum conditions using a dataset of 4836 images annotated by two
audiologists. The model effectively identifies various pathologies and conditions that can coexist in clinical
practice, with a Jaccard score of 0.84, indicating a high level of agreement with the annotations made by an
expert. This score notably exceeds the interoperator agreement (0.69) between the two audiologists. This
demonstrates the model’s accuracy but also its potential as a reliable tool for clinical diagnosis.
1 INTRODUCTION
Otoscopy has significantly advanced with Deep Neu-
ral Networks (DNNs), especially Convolutional Neu-
ral Networks (CNNs), revolutionizing medical image
classification (LeCun et al., 2015) and sometimes out-
performing human experts (Gulshan et al., 2016). The
adoption of the CNN multilabel classification in oto-
scopy, which enables the simultaneous identification
of multiple ear pathologies, aligns closely with real-
world clinical complexities, improving diagnostic rel-
evance.
Recent studies using otoscopic images have pre-
dominantly applied binary (Habib et al., 2023b;
Habib et al., 2023a) or multiclass (Zeng et al.,
2021; Cha et al., 2019; Wu et al., 2020) classifica-
tion approaches with very good results: 92.1% with
InceptionResnet-v2 and 3 classes (Cha et al., 2019),
95.59% with DenseNet and 8 classes (Zeng et al.,
2021), 97.47 with MobileNet and 3 classes (Wu et al.,
2020), 84.4% with a custom CNN and 3 classes (Liv-
ingstone et al., 2019), 91% with DenseNet and 1 class
(Habib et al., 2023a), often limiting the scope to a few
common pathologies (Chen et al., 2022; Zeng et al.,
2021; Viscaino et al., 2020; Wu et al., 2020; Living-
stone et al., 2019).
a
https://orcid.org/0009-0001-8140-9881
b
https://orcid.org/0000-0003-2517-5213
These approaches, while useful, falls short in clin-
ical settings where a broad spectrum of ear conditions,
including rare diseases, may be present (Cha et al.,
2019). In fact the number of pathologies examined
in these studies has been typically low, restricting the
ability to provide comprehensive diagnostic insights.
In contrast, our research focuses on advanced oto-
scopy image analysis through multi-label classifica-
tion enabling several tympanic conditions to be iden-
tified simultaneously, with a novel approach: we
tested several Convolutional Neural Network (CNN)
architectures and finally tailored a ResNet model for
our purpose. Our study uniquely encompasses an ex-
tensive array of 18 ear pathologies and conditions, in-
cluding those seldom seen in clinical settings. This
broad spectrum approach enables us to provide a near-
complete description of various eardrum states.
Our objective is to narrow the gap between high-
performing artificial intelligence models and their
real-world applicability in diverse medical scenarios.
This paper outlines our methodology and showcases
the results from our cutting-edge approach.
794
Perry, A., Renna, I., Rossant, F. and Wallaert, N.
Multilabel Classification of Otoscopy Images in Deep Learning for Detailed Assessment of Eardrum Condition.
DOI: 10.5220/0013316700003905
In Proceedings of the 14th International Conference on Pattern Recognition Applications and Methods (ICPRAM 2025), pages 794-800
ISBN: 978-989-758-730-6; ISSN: 2184-4313
Copyright © 2025 by Paper published under CC license (CC BY-NC-ND 4.0)
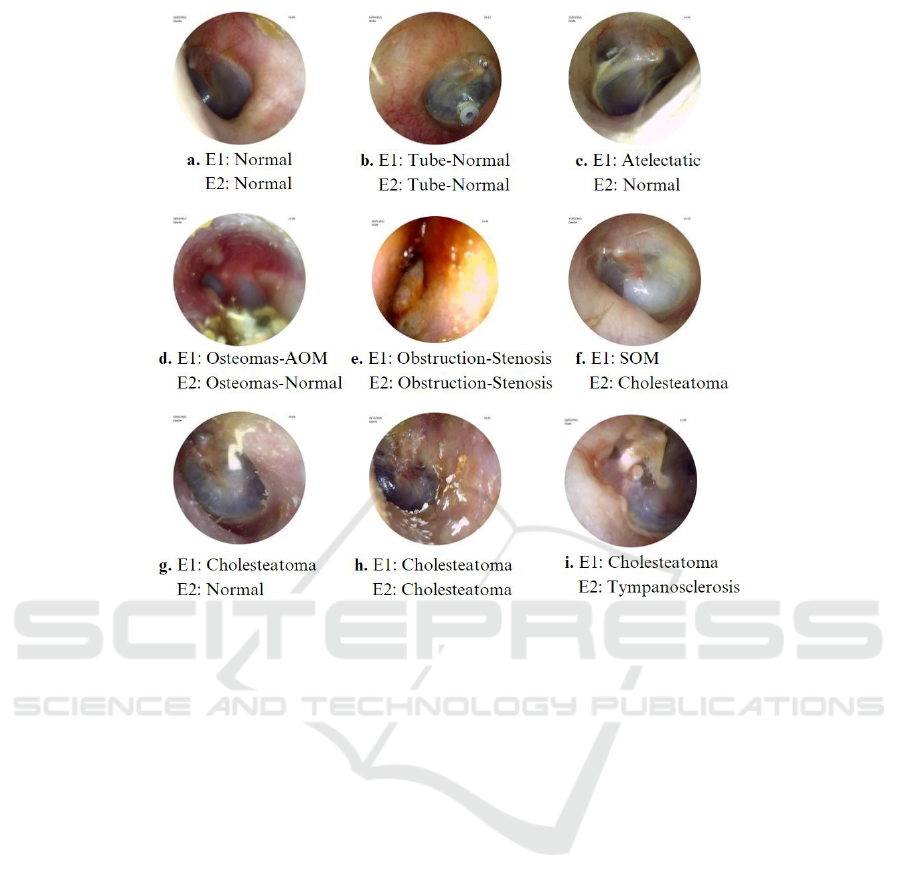
Figure 1: Various conditions of the tympanic membrane and the labeling given by two experts, E1 and E2.
2 MATERIALS AND METHODS
2.1 Description of the Otoscopy Dataset
We used a dataset from the ”Auditis Clinic” in Reims,
France, which consists of 4836 otoscopy images, each
of size 720px by 720px. These eardrum images were
annoted by two audiologists, henceforth denoted from
here on by E1 and E2, in a multi-label context, with
up to 3 labels per image, to ensure an accurate de-
scription of the condition of every imaged eardrum.
Figure 1 illustrates the variability in labeling tym-
panic membranes by two experts. For instance, im-
age c received conflicting labels of Normal (E2) and
Atelectatic Otitis (E1), while image f was differently
labeled as Cholesteatoma and SOM. This highlights
the challenges in consistent eardrum labeling, as an
eardrum can appear normal but still present a pathol-
ogy. Consensus was, for the Cholesteatoma label,
reached only in image h, with disagreement on im-
ages g and i, marked as Normal and Tympanoscle-
rosis. These inconsistencies emphasize the need for
standardized, automated eardrum image analysis.
The dataset (Table 1) shows a skewed label distri-
bution due to subject pre-selection. Most ears have
been previously assessed by otolaryngologists, result-
ing in an over-representation of the Normal label.
This contrasts with the 17 other labels indicating var-
ious ear conditions. Such skewness is crucial to con-
sider in machine learning model training to avoid bias
towards the Normal condition. Additionally, some la-
bels denote conditions that are inherently challenging
to detect, leading to diagnostic variability, as illus-
trated above.
Figure 2 presents confusion matrices for every la-
bel, highlighting the agreement level between the two
experts in our multi-label classification task. These
matrices exclude True Negatives and are normalized
by L , which represents the number of images la-
belled with the pathology by at least one expert.
The presented confusion matrices illustrate the highly
variable degrees of agreement between experts, de-
pending on the pathology. For example, Ventila-
tion Tube (Jaccard Score: J = 1.00, see Eq. 5) and
Partial Obstruction (J = 0.87) exhibit high concor-
dance, whereas Serous Otitis Media (J = 0.03) and
Cholesteatoma (J = 0.04) show low agreement. This
indicates differing opinions or diagnostic ambiguity
among experts. Note that on this scale, a Jaccard
Score is considered high when it reaches 0.6 or above,
Multilabel Classification of Otoscopy Images in Deep Learning for Detailed Assessment of Eardrum Condition
795
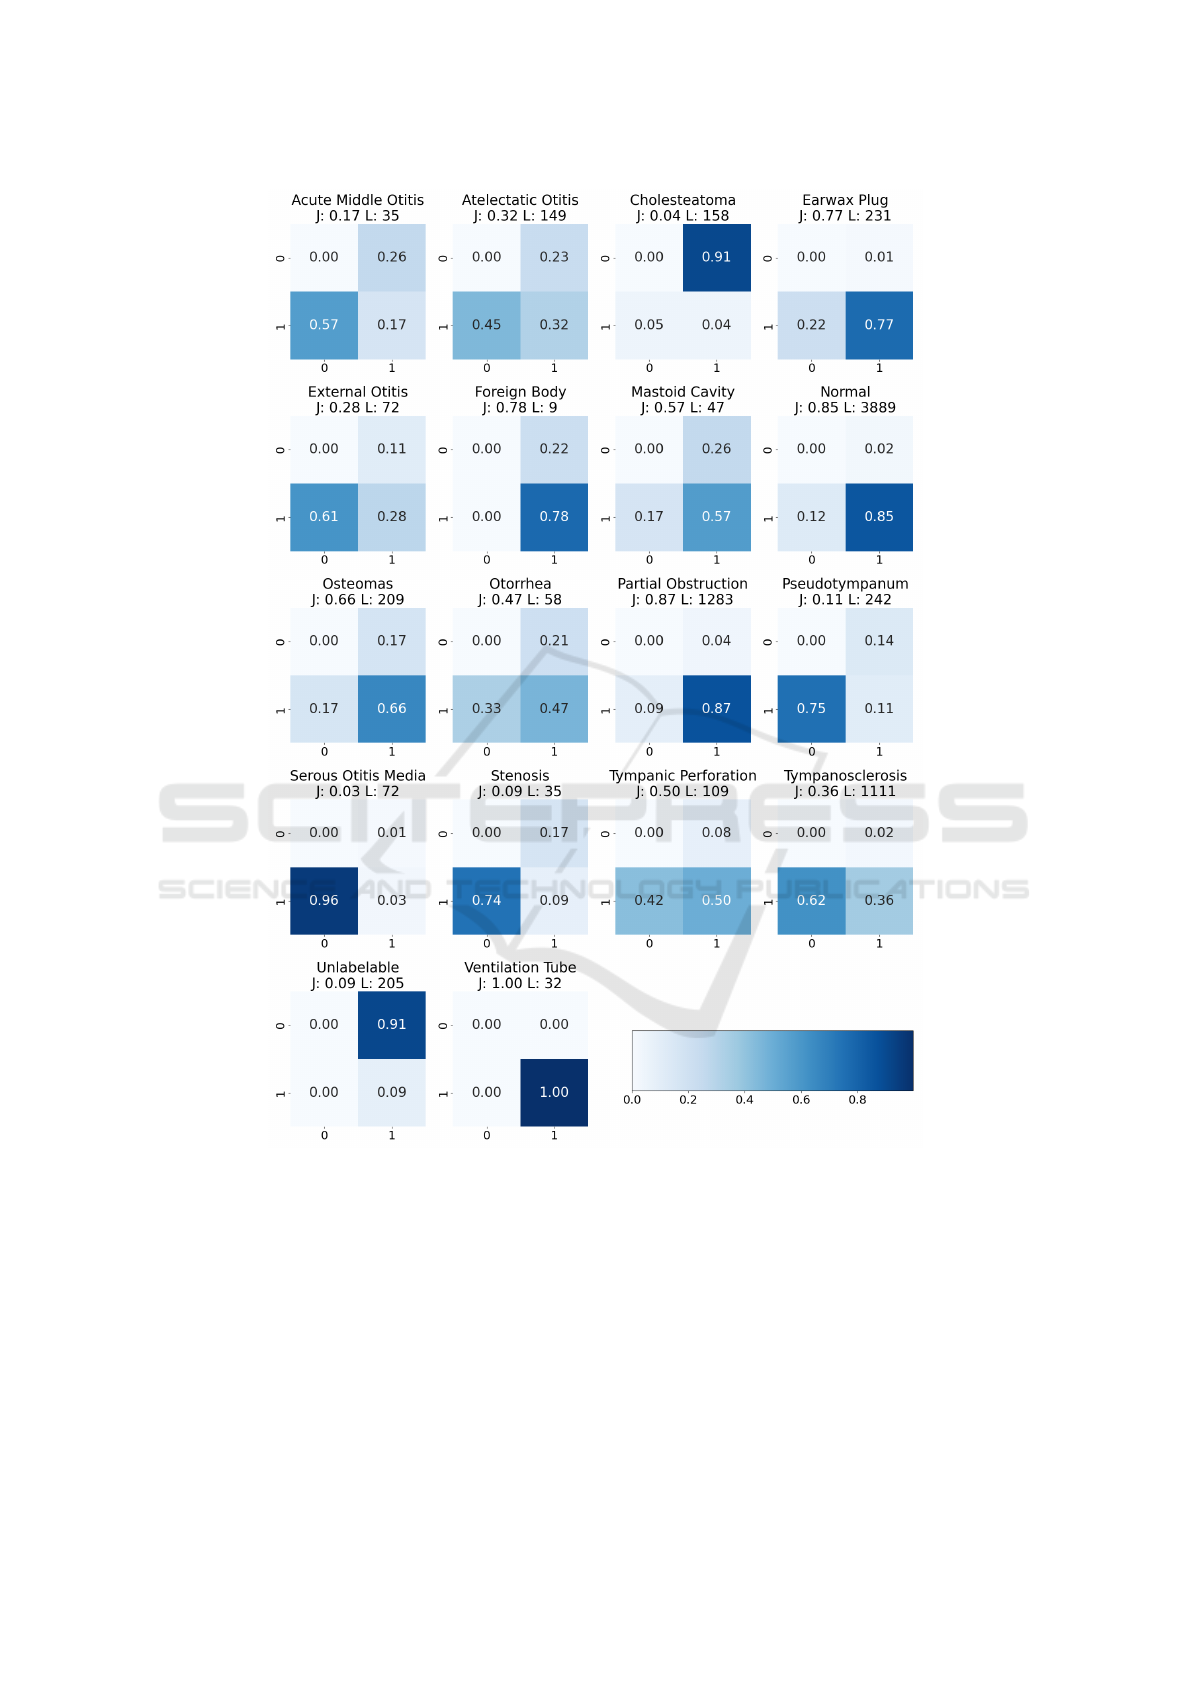
Figure 2: Confusion matrices presenting Labels (i.e. ear conditions) repartition over experts, and variability in eardrum
pathology labelization.
and very good to excellent when it falls between 0.8
and 1. E1 generally uses a broader array of labels
per image (average: 1.50 ± 0.63), suggesting a more
inclusive approach. In contrast, E2 averages fewer la-
bels (1.25 ± 0.48), indicating a focus on prominent
features. This variance in labeling strategies is signif-
icant, with E1 identifying 2710 problematic images
compared to E2’s 2335.
2.2 Performance Evaluation Metrics
In evaluating our multilabel otoscopy labeling system,
we focus on key metrics: precision (p), recall (r), and
F1 score (Olson and Delen, 2008). Precision, indicat-
ing the accuracy of positive predictions, is crucial in
medical contexts as it minimizes false positives. Re-
call, reflecting the ability to identify all positive cases,
is vital to reduce missed diagnoses. F1 score provides
a balanced view of the overall performance.
ICPRAM 2025 - 14th International Conference on Pattern Recognition Applications and Methods
796

Table 1: Summary of ear conditions with the number of
cases labeled by two experts (E1 and E2).
Label E1 E2
Earwax Plug 228 181
Normal 3795 3404
Tympanosclerosis 1088 420
Osteomas 173 174
Atelectatic Otitis 114 82
Otorrhea 46 39
Ventilation Tube 32 32
External Otitis 64 28
Mastoid Cavity 35 39
Partial Obstruction 1236 1165
Unlabelable 18 205
Cholesteatoma 15 150
Acute Middle Otitis 26 15
Pseudotympanum 209 60
Serous Otitis Media 71 3
Stenosis 29 9
Tympanic Perforation 100 63
Foreign Body 7 9
In multi-label classification, particularly with im-
balanced datasets, the samples average F1 score is
often preferable as it calculates the F1 score for each
individual sample and then averages these scores;
each sample is so treated equally, regardless of its
label combination, ensuring that the model’s ability
to predict all possible label combinations is evaluated
and not just the more frequently occurring labels or
classes. The formula for the samples average F1
score, incorporating precision and recall calculations
with label-specific vector notation, is given by:
F1 =
1
N
N
∑
i=1
F1
i
(1)
with
p
i
=
∑
k
TP
i
(k)
∑
k
TP
i
(k) +
∑
k
FP
i
(k)
, (2)
r
i
=
∑
k
TP
i
(k)
∑
k
TP
i
(k) +
∑
k
FN
i
(k)
, (3)
F1
i
=
2 × p
i
× r
i
p
i
+ r
i
(4)
where r
i
and y
i
are vectors of K elements (K=18 ear
conditions), representing respectively reference val-
ues and predicted values for image i; and TP
i
(k) = 1
if y
i
(k) = r
i
(k) = 1 (true positive for label k in im-
age i), FP
i
(k) = 1 if y
i
(k) = 1 and r
i
(k) = 0 (false
positive), FN
i
(k) = 1 if y
i
(k) = 0 and r
i
(k) = 1 (false
negative), and N the number of images.
The Jaccard Score is key in non-exclusive class
models, such as in medical multi-label classification
where multiple diagnoses may coexist. It measures
the similarity between predicted and true label sets.
The samples average Jaccard Score is calculated as:
J =
1
N
N
∑
i=1
∑
k
TP
i
(k)
∑
k
TP
i
(k) +
∑
k
FP
i
(k) +
∑
k
FN
i
(k)
(5)
which averages the Jaccard Scores for each image.
2.3 Experiments
Our exploration in neural network architectures for
otoscopy image analysis involved evaluating a vari-
ety of models. This included a baseline Convolu-
tional Neural Network (CNN) and several advanced
models such as VGG16 (Simonyan and Zisserman,
2014), ResNet50 (He et al., 2016), DenseNet (Huang
et al., 2017). All these models were pretrained on
large datasets and subsequently adapted for otoscopy.
This adaptation involved integrating a custom fully
connected layer with a dropout layer to prevent over-
fitting on the training dataset. To address the chal-
lenges of label imbalance, we employed a weighted
binary cross-entropy loss function (Zhou et al., 2021).
This approach allows for the adjustment of weights
inversely proportional to the frequency of the classes
in the training data, thus giving higher importance to
less frequent classes. Additionally, we utilized the
Adam optimizer (Kingma and Ba, 2015), to facilitate
more effective training of our neural network models.
The training was conducted using TensorFlow and the
computational work was performed on RTX 2080Ti
GPU.
The training was a two-stage process, based on
E1’s labelisation: initially, the newly added layers
were trained with the base model’s weights fixed, fol-
lowed by fine-tuning the entire network at a learn-
ing rate of 1e-5, thus balancing general and otoscopy-
specific features.
For assessment, we used 5-fold cross-validation
(Kohavi, 1995) with an 80-10-10 data partition for
comprehensive evaluation.
Image consistency was maintained by standard-
izing resolutions to 128x128 pixels. Zoom/dezoom,
contrast, and brightness variations were applied to en-
hance the dataset. Mirror augmentation (Shorten and
Khoshgoftaar, 2019) further improved model general-
ization.
Multilabel Classification of Otoscopy Images in Deep Learning for Detailed Assessment of Eardrum Condition
797

3 RESULTS
3.1 Overall Performance
Most models showed high Jaccard scores (Table2).
ResNet50 excelled with a J = 0.84, outdoing the
inter-annotator score of 0.79, indicating superior reli-
ability. Six out of seven models surpassed this bench-
mark, as Table 2 shows. ResNet50, with a 0.01
standard deviation, displayed consistent performance
across folds, highlighting its accuracy and generaliza-
tion potential. DenseNet201 and VGG19 also per-
formed well, scoring J = 0.82 and J = 0.81, respec-
tively.
In refining our model for eardrum image clas-
sification, we employed threshold optimization on
ResNet50, our top-performing architecture, to en-
hance prediction accuracy (Davis and Goadrich,
2006). This process involved iteratively testing dif-
ferent thresholds and assessing their impact on the F1
for each label on the validation set. By selecting label-
specific thresholds that maximize the F1, we finely
tuned the balance between false positives and nega-
tives for each pathology. The subsequent classifica-
tion report (Table 3) demonstrates final performance
achieved with ResNet50.
On normal hearing, the F1 improved marginally
from 0.94 to 0.95, indicating a slight enhancement in
the model’s accuracy for this prevalent condition. In
the case of Earwax Plug, there was a notable increase
in the F1 from 0.72 to 0.75, reflecting an improve-
ment in both precision and recall for this condition.
For Partial Obstruction, the F1 increased from 0.77
to 0.82.
However, for less represented classes, this pro-
cess led to a decrease in performance. Notably,
Cholesteatoma witnessed a reduction in F1, drop-
ping from 1.00 to 0.67. This decrease suggests that
while the model has become more adept at identify-
ing more common conditions, it struggles with rarer.
Final thresholds adjustments showed higher recall and
lower precision.
3.2 Comparison with Human
Inter-Observer Agreement
Key insights emerge from a comparison of Table 3
(ResNet50 metrics using E1’s labels), Table 4 (com-
parison of expert annotations), and Table 5 (ResNet50
metrics using E2’s labels for the most represented la-
bels, i.e., labels that appear more than 200 times).
These labels were chosen because they are the most
commonly encountered by audioprosthetists, provid-
ing a sufficient number of images to effectively train
our CNN. It is important to note that the model used
in Table 5 is the same one trained with Expert 1’s an-
notations. This selection was necessary due to the sig-
nificant disparity in the number of labels for less fre-
quently represented classes (e.g., Cholesteatoma with
15 labels from E1 and 150 from E2).
• Normal Condition: The model achieves an F1 of
0.95 against E1 and 0.90 against E2, demonstrat-
ing good precision-recall balance compared to the
inter-observer F1 of 0.92. This class presents high
inter-operator agreement with (J = 0.85, Fig.3)
that demonstrates such effectiveness by the ex-
perts.
• Partial Obstruction: F1 are 0.82 (E1) and 0.72
(E2). Despite a high inter-operator J of 0.87, this
indicates a need for enhanced precision and po-
tential confusion with similar conditions, as Un-
labelable (J = 0.09, Fig.3).
• Tympanosclerosis: The model’s F1 of 0.75 (E1)
significantly surpasses the inter-observer F1 of
0.53, demonstrating improved detection capabil-
ities. In contrast, the F1 drops to 0.50 when com-
pared with E2, indicating a variability in detec-
tion accuracy across different experts. The ob-
served disagreement between the two experts (J =
0.36, Fig.3) underscores the complexity of this
task, particularly in efficiently detecting patholo-
gies that may only slightly affect the tympanum’s
appearance.
• Earwax Plug: The model achieves an F1 of 0.75
when evaluated against E1’s labels, which is be-
low the inter-observer F1 of 0.87. It scores higher
against E2, with an F1 of 0.90, with a perfect re-
call of 1. The software correctly detects the clear-
est cases of this pathology, similar to E2 who was
more restrictive than E1 in his annotations.
• Pseudotympanum: Demonstrates an F1 of 0.58
(E1), but decreases to 0.18 on E2, which is in ac-
cordance with the low inter-observer F1 of 0.20.
The low J of 0.11 for this condition underscores
its complexity.
The F1 of the model against E2 is 0.82, indicating
somewhat less optimal performance, which is normal
as the model has been trained with E1 annotations.
However, the decrease is not important considering
the high inter-operator variability, demonstrating the
robustness of the model.
So our model achieved a 91% accuracy rate across
5 classes (Table 6), incorporating a multilabel ap-
proach. Accuracy, in this context, refers to the propor-
tion of correctly predicted instances among the total
instances. This performance is comparable to bench-
ICPRAM 2025 - 14th International Conference on Pattern Recognition Applications and Methods
798

Table 2: Jaccard scores of various models across five folds with their mean and standard deviation.
Model Fold 1 Fold 2 Fold 3 Fold 4 Fold 5 Mean (±SD)
ResNet50 0.83 0.83 0.85 0.84 0.83 0.84 (±0.01)
ResNet101 0.83 0.82 0.84 0.83 0.83 0.83 (±0.01)
VGG16 0.78 0.77 0.83 0.83 0.83 0.81 (±0.03)
VGG19 0.83 0.79 0.86 0.82 0.77 0.81 (±0.03)
DenseNet121 0.78 0.81 0.80 0.78 0.80 0.79 (±0.01)
DenseNet201 0.83 0.79 0.84 0.82 0.82 0.82 (±0.02)
Table 3: ResNet50 classification metrics for otoscopy im-
ages using E1’s labels on the test dataset. L
F
indicates mean
label count in each fold. Optimizing thresholds can lead
to an improvement of up to 2 points in the sample average
score.
Label p r F1 L
F
Ventilation Tube 1.00 0.67 0.80 3
Earwax Plug 0.83 0.68 0.75 22
Mastoid Cavity 0.64 0.64 0.64 11
Cholesteatoma 0.50 1.00 0.67 1
Foreign Body 1.00 1.00 1.00 1
Unlabelable 0.50 0.50 0.50 2
Normal 0.94 0.95 0.95 374
Partial Obstruction 0.78 0.86 0.82 131
Osteomas 1.00 0.07 0.12 15
Atelectatic Otitis 1.00 0.27 0.42 15
External Otitis 1.00 0.67 0.80 6
Serous Otitis Media 0.67 1.00 0.80 4
Acute Middle Otitis 1.00 1.00 1.00 2
Otorrhea 0.80 0.80 0.80 5
Tympanic Perforation 0.60 0.55 0.57 11
Pseudotympanum 0.50 0.70 0.58 20
Stenosis 1.00 0.50 0.67 4
Tympanosclerosis 0.72 0.80 0.75 104
Samples Avg 0.88 0.88 0.88 731
marks set in other studies, which include 92.1% accu-
racy using InceptionResnet-v2 across 3 classes (Cha
et al., 2019), 95.59% with DenseNet for 8 classes
(Zeng et al., 2021), 97.47% with MobileNet for 3
classes (Wu et al., 2020), 84.4% with a custom CNN
for 3 classes (Livingstone et al., 2019), and 91% with
DenseNet for a single class (Habib et al., 2023a). This
underscores the efficacy of our approach in handling
complex multiclass scenarios.
4 CONCLUSION AND FUTURE
WORKS
Our study validates the ResNet50 CNN’s effective-
ness in multi-label otoscopy image classification,
Table 4: Classification metrics for otoscopy images, com-
paring E2’s annotations with E1’s labels. L denotes label
support.
Label p r F1 L
Ventilation Tube 1.00 1.00 1.00 32
Earwax Plug 0.98 0.78 0.87 228
Mastoid Cavity 0.69 0.77 0.73 35
Cholesteatoma 0.05 0.47 0.08 15
Foreign Body 0.78 1.00 0.88 7
Unlabelable 0.09 1.00 0.16 18
Normal 0.97 0.87 0.92 3795
Partial Obstruction 0.96 0.90 0.93 1233
Osteomas 0.79 0.80 0.80 173
Atelectatic Otitis 0.57 0.41 0.48 114
External Otitis 0.71 0.31 0.43 64
Serous Otitis Media 0.67 0.03 0.05 71
Acute Middle Otitis 0.40 0.23 0.29 26
Otorrhea 0.69 0.59 0.64 46
Tympanic Perforation 0.86 0.54 0.66 100
Pseudotympanum 0.45 0.13 0.20 209
Stenosis 0.33 0.10 0.16 29
Tympanosclerosis 0.95 0.36 0.53 1088
Samples Avg 0.89 0.80 0.83 7283
Table 5: ResNet50 classification metrics for otoscopy im-
ages, focusing on the most represented labels (with more
than 200 items present in the dataset) using E2’s labels on
the test dataset. L
F
indicates mean label count in each fold.
Label p r F1 L
F
Earwax Plug 0.82 1.00 0.90 9
Normal 0.84 0.95 0.90 359
Partial Obstruction 0.88 0.61 0.72 140
Pseudotympanum 0.13 0.29 0.18 7
Tympanosclerosis 0.50 0.69 0.58 77
Samples Avg 0.80 0.83 0.82 637
achieving a notable F1 of 0.88 against first expert,
and 0.82 against second expert. This indicates its high
accuracy in identifying various ear conditions simul-
taneously. Our approach advances beyond traditional
single-condition diagnostics, offering a more compre-
Multilabel Classification of Otoscopy Images in Deep Learning for Detailed Assessment of Eardrum Condition
799

Table 6: Accuracy scores for main represented labels.
Label Accuracy
Ear Wax 0.99
Normal 0.84
Partial Obstruction 0.85
Pseudotympanum 0.98
Tympanosclerosis 0.87
Mean 0.91
hensive multi-label analysis.
We plan to enhance our model by expanding our
dataset to include a wider range of conditions, espe-
cially rare ones, improving robustness and diagnostic
accuracy. Additionally, we will adopt a multimodal
approach, integrating tonal and vocal audiometry with
endoscopy imaging to enhance diagnostic precision.
We also aim to leverage advanced vision language
models like LLaMA to boost our classification per-
formance. These developments are expected to signif-
icantly advance patient outcomes in clinical settings.
5 COMPLIANCE WITH ETHICAL
STANDARDS
This study was conducted in accordance with the prin-
ciples outlined in the Declaration of Helsinki. In-
formed consent was obtained from all individual par-
ticipants involved in the study. Additionally, all pa-
tient data were collected in the current clinical prat-
ice without modifying the patient’s treatment path-
way. To date, no study suggests that a photo of an
eardrum or a earcanal can be used to identify a pa-
tient. Taken together, this data does not fall within
the CNIL’s definition of paersonal sensitive data. The
data were anonymized to ensure privacy and confi-
dentiality. Prior to their treatment, patients have given
their consent for their data to be processed electron-
ically and used anonymously for clinical and scien-
tific studies, in accordance with general data protec-
tion regulations.
REFERENCES
Cha, D., Pae, C., Seong, S., Choi, J., and Park, H. (2019).
Automated diagnosis of ear disease using ensem-
ble deep learning with a big otoendoscopy image
database.
Chen, Y.-C., Chu, Y.-C., Huang, C.-Y., Lee, Y.-T., Lee, W.-
Y., Hsu, C.-Y., Yang, A. C., Liao, W.-H., and Cheng,
Y.-F. (2022). Smartphone-based artificial intelligence
using a transfer learning algorithm for the detection
and diagnosis of middle ear diseases: A retrospective
deep learning study.
Davis, J. and Goadrich, M. (2006). The relationship be-
tween precision-recall and roc curves. pages 233–240.
Gulshan, V., Peng, L., and et al., M. C. (2016). Develop-
ment and validation of a deep learning algorithm for
detection of diabetic retinopathy in retinal fundus pho-
tographs. JAMA, 316(22):2402–2410.
Habib, A., Xu, Y., Bock, K., et al. (2023a). Evaluating
the generalizability of deep learning image classifi-
cation algorithms to detect middle ear disease using
otoscopy. Scientific Reports, 13:5368.
Habib, A.-R., Xu, Y., Bock, K., Mohanty, S., Sederholm,
T., Weeks, W. B., Dodhia, R., Ferres, J. L., Perry, C.,
Sacks, R., and Singh, N. (2023b). Evaluating the gen-
eralizability of deep learning image classification al-
gorithms to detect middle ear disease using otoscopy.
Scientific Reports, 13(1):5368.
He, K., Zhang, X., Ren, S., and Sun, J. (2016). Deep resid-
ual learning for image recognition. pages 770–778.
Huang, G., Liu, Z., van der Maaten, L., and Weinberger,
K. Q. (2017). Densely connected convolutional net-
works. Journal of Neural Networks.
Kingma, D. P. and Ba, J. (2015). Adam: A method for
stochastic optimization.
Kohavi, R. (1995). A study of cross-validation and boot-
strap for accuracy estimation and model selection.
14(2):1137–1145.
LeCun, Y., Bengio, Y., and Hinton, G. (2015). Deep learn-
ing. Nature, 521(7553):436–444.
Livingstone, D., Talai, A. S., Chau, J., and Forkert, N. D.
(2019). Building an otoscopic screening prototype
tool using deep learning. Journal of Otolaryngology -
Head & Neck Surgery, 48(66). Published: 26 Novem-
ber 2019. Accesses: 3521, Citations: 27, Altmetric:
1.
Olson, D. and Delen, D. (2008). Advanced data mining
techniques.
Shorten, C. and Khoshgoftaar, T. M. (2019). A survey on
image data augmentation for deep learning. Journal
of Big Data, 6(1):Article 60.
Simonyan, K. and Zisserman, A. (2014). Very deep con-
volutional networks for large-scale image recognition.
arXiv preprint arXiv:1409.1556.
Viscaino, M., Maass, J., Delano, P., Torrente, M., Stott, C.,
et al. (2020). Computer-aided diagnosis of external
and middle ear conditions: A machine learning ap-
proach. PLOS ONE, 15(3):e0229226.
Wu, Z., Lin, Z., Li, L., Pan, H., Chen, G., Fu, Y., and Qiu,
Q. (2020). Deep learning for classification of pediatric
otitis media. Pediatrics. First published: 28 December
2020. Editor’s Note: This Manuscript was accepted
for publication on November 23, 2020. The authors
have no funding, financial relationships, or conflicts
of interest to disclose.
Zeng, X., Jiang, Z., and et al., W. L. (2021). Efficient and
accurate identification of ear diseases using an ensem-
ble deep learning model.
Zhou, Z., Huang, H., and Fang, B. (2021). Application of
weighted cross-entropy loss function in intrusion de-
tection. Journal of Computer and Communications,
9(11):1.
ICPRAM 2025 - 14th International Conference on Pattern Recognition Applications and Methods
800
