
Using Under-Represented Subgroup Fine Tuning to Improve Fairness for
Disease Prediction
Yanchen Wang
1 a
, Rex Bone
1 b
, Will Fleisher
1 c
, Carole Roan Gresenz
1 d
, Jean Mitchell
1 e
,
Wilbert van der Klaauw
2 f
, Crystal Wang
2 g
and Lisa Singh
1 h
1
Georgetown University, Washington, DC, U.S.A.
2
Federal Reserve Bank New York, New York, NY, U.S.A.
Keywords:
Machine Learning Fairness, Disease Prediction, Multivariate Sensitive Attribute, Model Fine Tuning.
Abstract:
The role of artificial intelligence is growing in healthcare and disease prediction. Because of its potential
impact and demographic disparities that have been identified in machine learning models for disease predic-
tion, there are growing concerns about transparency, accountability and fairness of these predictive models.
However, very little research has investigated methods for improving model fairness in disease prediction,
particularly when the sensitive attribute is multivariate and when the distribution of sensitive attribute groups
is highly skewed. In this work, we explore algorithmic fairness when predicting heart disease and Alzheimer’s
Disease and Related Dementias (ADRD). We propose a fine tuning approach to improve model fairness that
takes advantage of observations from the majority groups to build a pre-trained model and uses observations
from each underrepresented subgroup to fine tune the pre-trained model, thereby incorporating additional
specific knowledge about each subgroup. We find that our fine tuning approach performs better than other
algorithmic fairness fixing methods across all subgroups even if the subgroup distribution is very imbalanced
and some subgroups are very small. This is an important step toward understanding approaches for improving
fairness for healthcare and disease prediction.
1 INTRODUCTION
Algorithmic decision making that relies on artificial
intelligence is increasingly impacting people’s daily
lives in areas such as credit approval, job hiring, and
criminal justice. We are also seeing its growth with re-
spect to disease prediction and clinical decision mak-
ings (Jiang et al., 2017; Secinaro et al., 2021; Yu
et al., 2018). Given the importance of such deci-
sion making, there are growing concerns about the
transparency, accountability, and fairness of the pre-
dictive models being designed (Binns, 2018; Center
for Democracy & Technology, 2024). In September
a
https://orcid.org/0000-0002-7822-7163
b
https://orcid.org/0009-0000-2778-9783
c
https://orcid.org/0000-0002-5980-3970
d
https://orcid.org/0000-0002-7381-7914
e
https://orcid.org/0000-0002-2765-4624
f
https://orcid.org/0000-0002-7977-3342
g
https://orcid.org/0009-0003-2970-0887
h
https://orcid.org/0000-0002-8300-2970
2022, the U.S. Food and Drug Administration (FDA)
issued a guidance for Clinical Decision Support Soft-
ware. The guidance mentions potential risks associ-
ated with software intended to provide recommenda-
tions to a healthcare provider about prevention, diag-
nosis, or treatment of a disease or condition. It de-
scribes an automation bias where human tends to over
rely on suggestions from automated systems. They
recommend that algorithmic decision making not re-
place or direct the judgment of healthcare profession-
als (FDA, 2022).
The guidance from the FDA is not unfounded.
Researchers have identified demographic disparities
in disease diagnosis and treatment usage (Barthold
et al., 2020; Straw et al., 2024; Allen et al., 2020).
Researchers have also identified demographic dispar-
ities in machine learning models predicting disease
(Yuan et al., 2023; Davoudi et al., 2024; Fazelpour
and Danks, 2021). For example, Davoudi and col-
leagues study machine learning models predicting the
risk of hospitalization and emergency department vis-
its in home healthcare patients and identify signif-
240
Wang, Y., Bone, R., Fleisher, W., Gresenz, C. R., Mitchell, J., van der Klaauw, W., Wang, C. and Singh, L.
Using Under-Represented Subgroup Fine Tuning to Improve Fairness for Disease Prediction.
DOI: 10.5220/0013318600003911
Paper published under CC license (CC BY-NC-ND 4.0)
In Proceedings of the 18th International Joint Conference on Biomedical Engineering Systems and Technologies (BIOSTEC 2025) - Volume 2: HEALTHINF, pages 240-253
ISBN: 978-989-758-731-3; ISSN: 2184-4305
Proceedings Copyright © 2025 by SCITEPRESS – Science and Technology Publications, Lda.

icant disparities in model performance across both
racial and gender subgroups (Davoudi et al., 2024).
These examples suggest that members of marginal-
ized groups unfairly receive worse predictions than
those in advantaged groups.
While researchers have continued to identify dis-
parities in drug use and disease prediction models,
comparatively little research has focused on devel-
oping mitigation algorithms to improve the model
fairness for health care applications. This focus on
healthcare is important since the design and appli-
cation of fairness may be different than other do-
mains. For example, one important difference is that
demographic variables are expected to be part of the
model since risk factors associated with many differ-
ent health conditions are known to vary based on pa-
tient demographics. A technical consideration, given
this, is that it is possible for there to be multiple differ-
ent sensitive attributes, some of which are multivari-
ate. Since most algorithmic fairness literature to date
focuses on corrections for binary sensitive attributes,
more work is needed to develop technical solutions
for handling this situation.
Disparities in model performance for people in
different social groups can have significant conse-
quences for the well-being of people in marginal-
ized groups. Inaccurate or failed diagnoses, for in-
stance, can result in people failing to receive appro-
priate medical care. If a diagnostic system is only
accurate for members of advantaged social groups,
advantaged group members are likely to receive bet-
ter care and a disproportionate amount of medical re-
sources. If these disparities are the result of failures
in the collection of data, or at other points in the ma-
chine learning pipeline, then the use of machine learn-
ing models can contribute to an unfair distribution of
medical care and resources. Our goal in this project
is to develop methods that help mitigate these dispar-
ities with respect to the accuracy of machine learning
models used for healthcare decisions.
To that end, this paper focuses on improving
the algorithmic fairness of machine learning models
for disease prediction. We explore existing strate-
gies and propose a new strategy for reducing model
bias. We demonstrate its effectiveness on a heart
disease data set and synthetic data designed for de-
tecting Alzheimer’s Disease and Related Dementias
(ADRD). Our new approach focuses on pretraining a
model using available (possibly skewed) initial data
to provide sufficient contextual insight for the model,
and then fine tuning the pretrained model on exam-
ples from subgroups that are not well represented in
the training data set. This results in a set of models
that are upgraded for different under-represented sub-
groups.
Our main contributions can be summarized as fol-
lows. (1) We propose a novel fine tuning approach for
improving model fairness across all subgroups, even
in the presence of an imbalanced group distribution.
(2) Our approach considers multivariate sensitive at-
tributes with highly skewed, imbalanced group distri-
bution, where previous literature has focused on bi-
nary sensitive attributes and/or more balanced sensi-
tive attribute distributions. (3) We develop and release
the source code for a synthetic data generator that can
generate temporal data sets containing variables fol-
lowing a range of distributions, thereby allowing re-
searchers to easily generate synthetic data for disease
prediction applications so private health data does not
need to be shared.
2 RELATED LITERATURE
2.1 Disease Prediction Using Machine
Learning
In the past decade, we have seen a growth in disease
prediction research that uses machine learning mod-
els. Some recent surveys have discussed the strengths
and limitations of different methods for specific pre-
diction tasks (Shah et al., 2020; Singh and Kumar,
2020; Fatima and Pasha, 2017). To date, heart dis-
ease prediction is the task that has received the most
attention in the literature. The models being used
for heart disease prediction tend to be developed us-
ing classic machine learning methods, including ran-
dom forest, decision trees, logistic regression, and
support vector machine (SVM). Recently, Xie and
colleagues conducted a survey of disease prediction
research that uses deep learning models (Xie et al.,
2021). They showed that deep learning models are
outperforming classic models, especially when the
data are not in tabular form. For example, when the
data are image-based, e.g., X-ray, computed tomog-
raphy (CT), and magnetic resonance imaging (MRI)
scans, deep learning neural network models, includ-
ing convolutional neural networks (CNNs) and recur-
rent neural networks (RNNs) have performed better.
When the data are in tabular format, artificial neural
networks (ANNs) sometimes still perform better than
the classic models.
Machine Learning for Predicting Alzheimer’s Dis-
ease and Related Dementias Diagnosis. Existing
machine learning models predicting ADRD mostly
use features from medical images (Rathore et al.,
Using Under-Represented Subgroup Fine Tuning to Improve Fairness for Disease Prediction
241

2017) and medical exams, e.g. blood plasma spec-
troscopy (Paraskevaidi et al., 2018; Doecke et al.,
2012). While these machine learning models can
achieve relatively high accuracy using features ex-
tracted from these data sources, the data sets are ex-
pensive, making it hard to scale to population lev-
els (Frisoni, 2001). In recent years, researchers have
started to understand the relationship between ADRD
and personal finances. For example, Gresenz and col-
leagues find that early-stage ADRD can negatively af-
fect household financial worth (Gresenz et al., 2020).
Agarwal and Muckley have similar findings that older
persons’ money management difficulty can help iden-
tify individuals with early-stage dementia (Agarwal
and Muckley, 2024).
In this work, we focus on fairness related to heart
disease prediction, because of its prevalence in the lit-
erature, and ADRD prediction, because of its link to
personal financial management. Our team has exper-
tise in economics and finance. This allows us to gen-
erate realistic, synthetic financial data that we use in
this paper.
2.2 Bias Mitigation Algorithms
While fairness metrics for multivariate sensitive at-
tributes are similar to binary ones, bias mitigation al-
gorithms for multivariate sensitive attribute are very
different (Kang et al., 2022; Ma et al., 2021; Chen
et al., 2024), even though they have also been ap-
plied at different stages of the modeling process: pre-
processing (Kamiran and Calders, 2012; Feldman
et al., 2015; Chakraborty et al., 2021), in-processing
(Tarzanagh et al., 2023; Shui et al., 2022; Chen et al.,
2022; Peng et al., 2022) and post-processing (Hardt
et al., 2016; Pleiss et al., 2017).
Beginning with a pre-processing method, Wang
and Singh propose a resampling approach to im-
prove fairness. This method achieves statistical in-
dependence between the sensitive attributes and the
outcome (Wang and Singh, 2021). Chakraborty
and colleagues propose Fair-SMOTE (Chakraborty
et al., 2021). It utilizes the existing Synthetic Mi-
nority Over-sampling Technique (SMOTE) algorithm
(Chawla et al., 2002) to generate synthetic samples
by using k-nearest neighbors (KNN) to generate new
observations that are close to existing observations.
Chen and colleagues (Chen et al., 2022) pro-
pose MAAT, an in-processing method for improving
ML fAirness-performAnce Trade-of. Their approach
trains two models, one that optimizes performance
and one that optimizes fairness using the training
data. The fairness optimization model corrects selec-
tion bias by undersampling over-represented groups
to improve fairness and the performance optimiza-
tion model uses a classic machine learning model, e.g.
such as random forest and logistic regression, to opti-
mize performance.
Finally, Hardt and colleagues (Hardt et al., 2016)
propose equalized odds processing, a post-processing
method to improve fairness. In this method, the au-
thors utilize the decision probability from the classi-
fier to determine a different probability threshold for
each subgroup, instead of the traditional 50/50 split.
None of these proposed methods address a major
challenge that arises when we have a multivariate sen-
sitive attribute: limited training data for multiple, spe-
cific subgroups, not just a single minority class. To
address this problem, recent research uses multi-level
modeling. Shui and colleagues (Shui et al., 2022) pro-
pose a bi-level objective model. In the lower-level, the
subgroup specific predictors are trained using a small
amount of data from each subgroup then in the upper-
level, the model takes feedback from each of the lower
level results and updates the model to be close to all
subgroup specific predictors. However, this approach
tends to overfit the data, especially when the distribu-
tion of data for each subgroup is different (Tarzanagh
et al., 2023).
Fine Tuning Approach. Fine tuning is a process-
ing of adapting a pre-trained deep learning model for
specific machine learning tasks. One can view this
as adding domain-specific knowledge to a more gen-
eral knowledge-base. Specifically, the process up-
dates parameters in a neural network model using the
domain-specific training examples, thereby adjusting
the pre-trained model to perform better on the spe-
cific learning task of interest. It accomplishes this
using a very small amount of training data. This ap-
proach has been shown to be effective for natural lan-
guage processing (NLP) models. Specific examples
include fine tuning Bidirectional Encoder Represen-
tations from Transformers (BERT) (Sun et al., 2019;
Liu et al., 2019), and more recent GPT models devel-
oped by OpenAI (Houlsby et al., 2019; Howard and
Ruder, 2018; Min et al., 2023). In this paper, we pro-
pose a fine tuning approach that focuses on fairness
improvement instead of general model performance
improvement. We will further discuss our approach
in Section 3.2.
2.3 Machine Learning Fairness on
Disease Prediction
In many areas such as hiring and credit approval, de-
cision makers are prohibited by law from using de-
mographic features of individuals to make decisions.
HEALTHINF 2025 - 18th International Conference on Health Informatics
242

The goal is to remove the influence of demograph-
ics to reduce the likelihood of bias, e.g. sexism or
racism. In disease prediction, demographic features
such as sex, race and age can provide necessary in-
sight into possible risk factors for specific diseases
and are therefore, often included as training features
in machine learning models (Grampurohit and Sagar-
nal, 2020; Arumugam et al., 2023). This means that
we expect that there are differences in predictive ac-
curacy across subpopulations and we can easily de-
termine which subpopulations have higher predictive
accuracy and which do not. For those who do not, our
goal is to develop strategies for improving the predic-
tive model accuracies to ones that are similar to the
highest ones when more training data are not avail-
able.
Existing Work to Identify and Reduce Bias in Dis-
ease Prediction Models. Research on fairness in
disease prediction is fairly limited and mostly focuses
on fairness for binary sensitive attributes (Li et al.,
2023; Chae et al., 2023; Davoudi et al., 2024; Feng
et al., 2024; Grote and Keeling, 2022; Raza et al.,
2023; Chen et al., 2023). Li and colleagues study
the bias in machine learning models for cardiovascu-
lar disease prediction and compare the performance
of various bias mitigation strategies. They use binary
sensitive attributes, sex and race, with both classic
machine learning and deep learning models. Their
bias mitigation algorithms include resampling using
two approaches: (1) resampling the training data by
group, e.g., sampling the binary sex feature so that
each group has the same number of observations, and
(2) resampling the training data by label and remov-
ing the sensitive attribute from training data during
model training and prediction (Li et al., 2023).
Chae and colleagues build time series risk models
using the AutoGluon model and the LightGBM model
to predict emergency department visits and hospital-
izations for patients with heart failure. Features in-
cluded patients demographics, vital signs, medical
history, and notes from prior visits (Chae et al., 2023).
A year later, the same team investigate the fairness
gaps in the same two models with respect to race and
gender. They use error rate balance and predictive
parity as fairness metrics and find that there are signif-
icant disparities in model performance across demo-
graphic subgroups. However, in the paper, the authors
do not propose or use any existing bias mitigation al-
gorithms to improve fairness (Davoudi et al., 2024).
We extend the literature in the following ways: (1)
we consider cases when the sensitive attribute is mul-
tivariate, (2) we propose an approach that fine tunes
the model using subpopulations that are not well rep-
resented (resampling by group) to improve fairness of
the multivariate sensitive attribute, (3) and unlike (Li
et al., 2023) that remove the sensitive attribute to im-
prove fairness, our approach includes sensitive demo-
graphic attributes in the training data because these
attributes are associated with risk factors that are im-
portant for building robust disease prediction models.
3 FINE TUNING FOR FAIRNESS
This section begins with definitions and notation. We
then describe our proposed fine tuning approach.
3.1 Preliminaries
Let Y = {y
1
, y
2
, ··· , y
n
} be the set of binary labels we
want to predict and for the ith observation, y
i
∈ {0, 1},
where y
i
= 1 indicating being diagnosed with the dis-
ease and y
i
= 0 indicating not being diagnosed with
the disease. Similarly, let
ˆ
Y = { ˆy
1
, ˆy
2
, · ·· , ˆy
n
} and
ˆy
i
∈ {0, 1} be the predicted label for the ith obser-
vation. Let X = {x
1
, x
2
, · ·· , x
n
} be the set of train-
ing features. A machine learning model M is trained
using X and Y . Using the model M we get a set of
predicted labels
ˆ
Y = M(X). Let S = {s
1
, s
2
, · ·· , s
n
},
where S ⊂ X and s
i
∈ {sensitive attribute group}, is
the sensitive attribute for the ith observation.
The task we are interested in is to train our ma-
chine learning model M so that it is fair for subgroups
in S. We measure the model performance and fairness
using X, Y ,
ˆ
Y and S.
3.2 Proposed Approach
There are multiple approaches to improve machine
learning fairness. One approach is to build one model
for the entire data set and use various bias mitiga-
tion algorithms to improve the fairness and make the
model fair across all subgroups. This approach works
well when the number of sensitive attribute groups is
small and each group is well represented in the train-
ing data set. However, when there are more sensitive
attribute groups and the subgroup distribution of the
training data is very imbalanced, one model may not
perform well for all subgroups. Another approach to
improve the fairness is to build a model for each group
so that each model is optimized for each subgroup.
If we build models from scratch using training data
from each subgroup, any model that is built using sub-
groups with limited training data may perform poorly.
There are over-sampling techniques that can be used
to increase the size of training sample. However, be-
cause they are of a similar distribution as the original
Using Under-Represented Subgroup Fine Tuning to Improve Fairness for Disease Prediction
243

observations, the overall model performance may not
improve. We propose addressing these limitations by
using a fine tuning approach that is designed to adjust
the model to improve performance on subgroups with
fewer training observations (see Section 2.2 for fine
tuning background).
Consider a disease prediction task where we have
a large amount of data and the subgroup distribution
is very imbalanced. Our approach, similar to oth-
ers, begins by training a general pre-trained model
using a large number of examples so that the pre-
trained model has good overall performance on our
task and learns important background about our pre-
diction task. We can view this step as being simi-
lar to state of the art large language models such as
BERT and GPT. These models were trained on large
data sets that provide general information that can be
useful for specific prediction tasks. We then use train-
ing examples specific to the smaller subgroups to fine
tune the pre-trained model. The fine tuning step en-
ables us to utilize the general knowledge from the
pre-trained model and achieve higher performance for
smaller subgroups using a small number of training
examples.
Figure 1 illustrates our approach. In step one,
we first split the available labeled data into three
non-overlapping partitions using stratified sampling:
training, hold out for fine tuning and hold out for val-
idation. The hold out set for validation has the same
distribution as the raw data and the hold out set for
fine tuning is a stratified sample of the raw data, where
the number of observations for each subpopulation is
the same. The remaining data serves as the training
data set. In step 2, during model training, we train
a large neural network model from scratch using the
training data. Because this model is developed us-
ing a large data set, it is likely biased toward accurate
prediction for the groups that have more training ex-
amples. We then use this base model as a pre-trained
model and fine tune it on minority sensitive attribute
groups, those having relatively low performance and
fairness scores. We use the hold out set for fine tun-
ing for this step. During fine tuning, the model pa-
rameters are updated. In step 3, after the fine tuning
process, we have a model for each sensitive attribute
group and we use the holdout for validation set to
measure model performance and fairness.
4 SYNTHETIC DATA
GENERATOR
Given the concerns around health data privacy, we
have developed a synthetic data generator to allow
researchers to generate data sets that can be used as
training data to develop initial models before devel-
oping a final one in a privacy-preserving environment
with the actual patient data. Our data generator al-
lows researchers to generate temporal and non-time
varying records, vary the distribution for different fea-
tures, and use group level statistics to generate indi-
vidual records. Example statistics include mean, me-
dian, min, max, skewness, and covariance. This en-
ables safeguarding individual data while optimizing
models. We make our open-source synthetic genera-
tor available to the research community
1
.
If the data generator is used to create data sets
with temporal variables, the researcher begins by se-
lecting a distribution for the temporal period. For ex-
ample, if the researcher wants to generate data from
2010 to 2020 with one observation per year, the re-
searcher needs to decide on the underlying population
distribution at the first observation period, e.g., 2010
in this case. The first row of Table 1 shows all the
available distributions in the synthetic data generator.
It contains both univariate and multivariate distribu-
tions. The distribution selection can be determined
using the Kolmogorov-Smirnov goodness of fit test
(Massey Jr, 1951) on the aggreagated data set. For
temporal data, the researcher also needs to select a
trend for the temporarily. The trend measures how
observations change over time. There are four dif-
ferent trends available: linear, uniform, polynomial
and exponential. The parameters for each trend can
be chosen using regression analysis on the aggregated
data. With each trend, the researcher can specify
the amount of noise (random or non-random) for the
trend.
5 EXPERIMENTAL DESIGN
The discussion of the experimental design is broken
down as follows: the data sets, the evaluation mea-
sures, the machine learning models, and the bias mit-
igation algorithms.
5.1 Data Sets
We use the following two data sets: the UCI Machine
Learning Repository heart disease data set and a syn-
thetic data set that has a similar distribution to a subset
of financial data used to predict ADRD.
1
https://github.com/GU-DataLab/healthinf_synthetic
HEALTHINF 2025 - 18th International Conference on Health Informatics
244
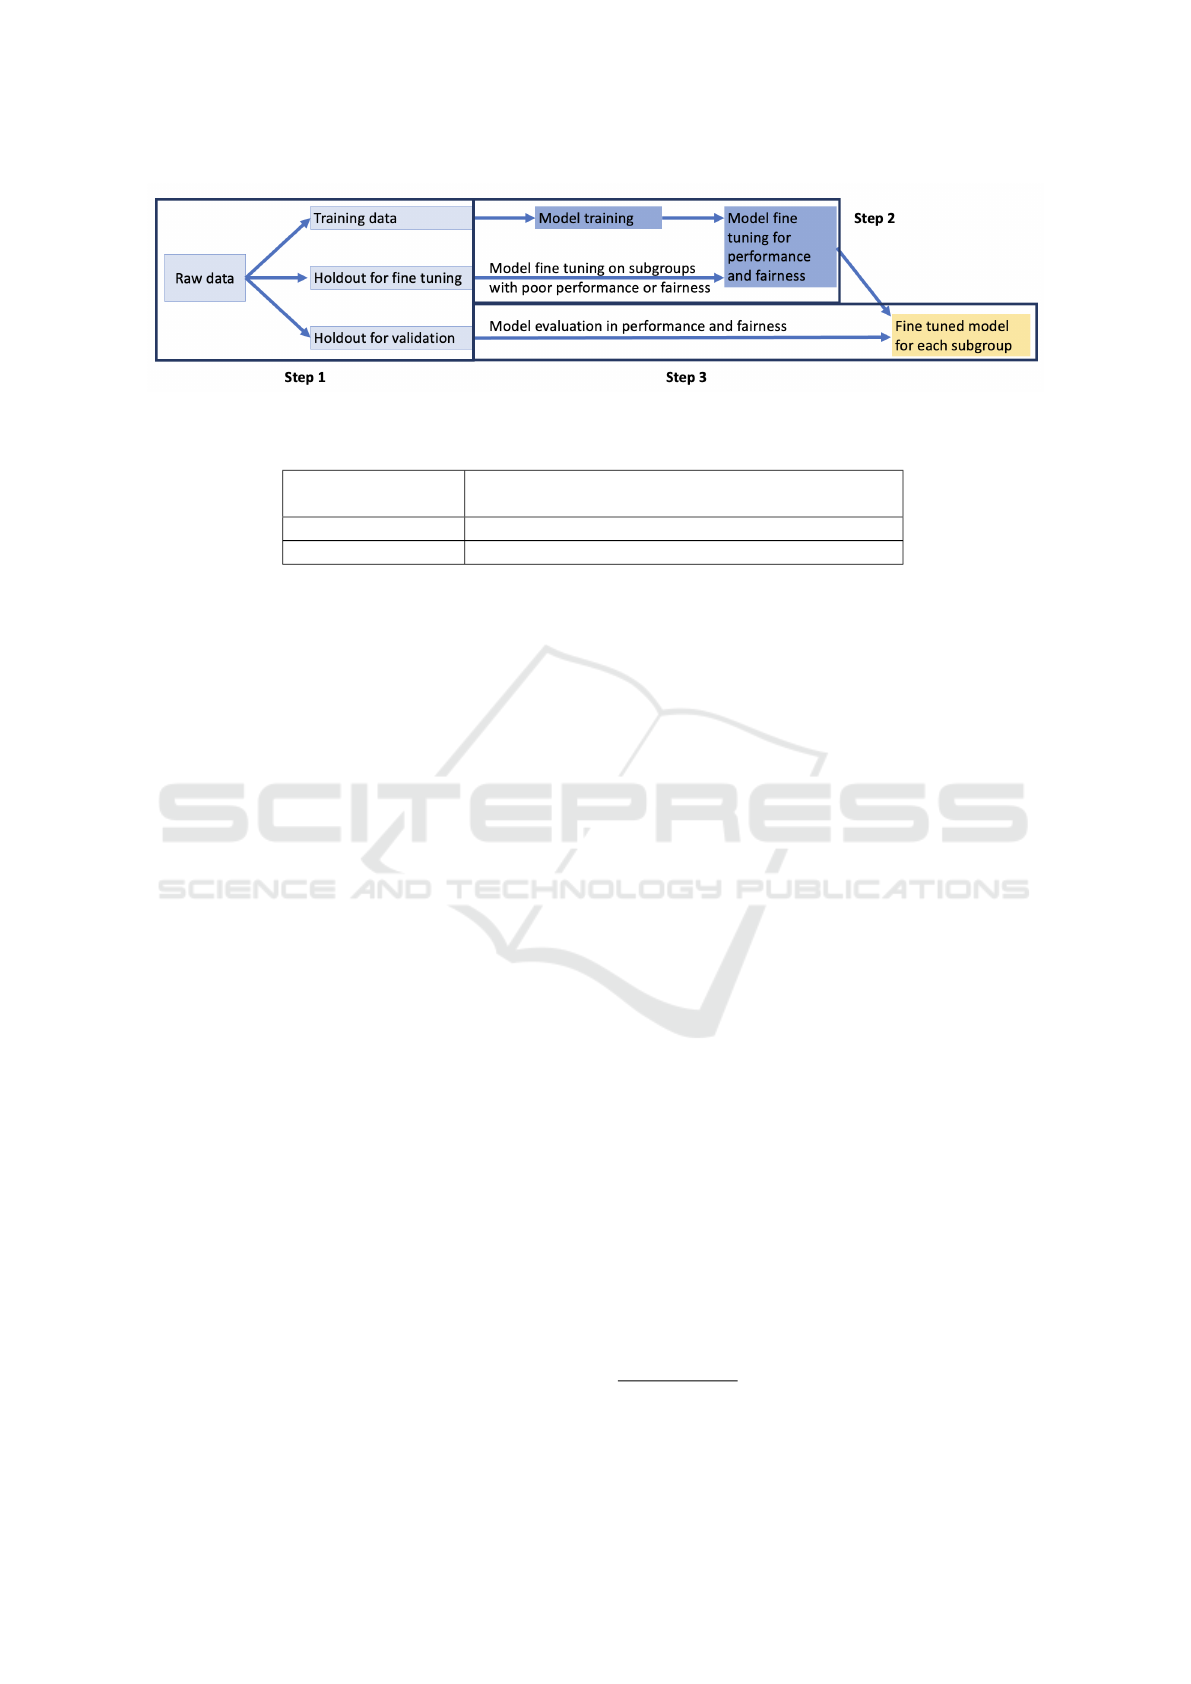
Figure 1: Fine tuning for fairness steps.
Table 1: Synthetic data generator parameters.
Type of distribution
gamma, beta, normal, uniform, weibull, log normal,
multivariate normal, multivariate log normal
Temporal trend linear, uniform, polynomial, exponential
Type of data categorical, continuous numeric
5.1.1 UCI Heart Disease Data
The heart disease data from the UCI Machine Learn-
ing Repository contains 304 observations with 14 fea-
tures, including age, sex, and medical record infor-
mation, e.g. blood pressure and heart rate. The task
is to predict whether the individual has heart disease.
This data set was obtained from the Cleveland Clinic
and it has been extensively used by machine learn-
ing researchers (Janosi et al., 1988). We consider two
features as sensitive attributes: sex (a binary variable)
and age (multivariate, binned, attribute). For the sex
variable, there are 207 male observations and 97 fe-
male observations. Age is a numeric continuous vari-
able in the original data set. We create three imbal-
anced bins with 25%, 50%, and 25% of the data in
each bin.
5.1.2 Synthetic Data for ADRD Prediction
Our second task is predicting ADRD. As described
in Section 2.1, researchers have identified a link be-
tween money management ability and ADRD (Gre-
senz et al., 2020; Agarwal and Muckley, 2024). We
use that knowledge to generate financial features and
basic health information that maps to existing credit
and health data sets.
The credit data that we map our distribution to is
credit data from Equifax. These data are the basis of
the Federal Reserve Bank of New York’s Consumer
Credit Panel. These data have been merged at the in-
dividual level using a unique common identifier (So-
cial Security number) with Medicare enrollment and
claims data for fee-for-service (FFS) enrollees. The
merged data set only contains individuals over than
65 years old who are enrolled in Medicare fee-for-
service. This data set encompasses quarterly obser-
vations on financial features for each quarter between
1999 and 2017 (Gresenz et al., 2024). In addition to
financial features, the merged data set contains ba-
sic demographic information of individuals such as
age, sex, and race.
2
We use the race feature as the
sensitive attribute and there are 6 sensitive attribute
groups: White, Black, Asian, Hispanic, Native Amer-
ican and others/unknown. We construct a random
subsample of the data set that contains 5 percent of
the merged data with a subset of 12 features from ap-
proximately 1000 features in the merged data. The 12
features are training features about financial indica-
tors such as number of account, balance amount and
past due amount. In the rest of the paper, we refer
this five percent merged set as the Merged Subsample
of Consumer Credit Panel data (MS-CCP data). The
synthetic data we generate is based on the statistical
properties of the MS-CCP data.
5.2 Evaluation
5.2.1 Fairness Metrics
In our fairness evaluation, we use two metrics to
quantify fairness, equal opportunity (Hardt et al.,
2016) and accuracy disparity (Berk et al., 2021; Zafar
et al., 2017). There are many other fairness metrics
available. Feng and colleagues published a survey of
machine learning fairness in healthcare and present
nine different fairness metrics used in literature (Feng
et al., 2024). To the best of our knowledge, no best
metric has been selected by health research commu-
nity. In this work, we use equal opportunity and ac-
curacy disparity to show the effectiveness of our pro-
posed method. We expect the results will generalize
2
The demographic information is from the Medicare
data. No explicit race or ethnicity data is obtained from
Equifax.
Using Under-Represented Subgroup Fine Tuning to Improve Fairness for Disease Prediction
245

to other fairness metrics and demonstrating this is one
of our future research directions.
The formal equal opportunity metric—also called
true positive rate parity—is inspired by eponymous
principles of justice from political philosophy, which
have broad acceptance (Barocas et al., 2023; Loi
et al., 2021). Equality of opportunity principles re-
quire, roughly, that people have the same chances of
obtaining some good outcome, regardless of which
social groups they belong to. The formal metric be-
low represents such a requirement as it applies to the
good outcome of an accurate decision from a machine
learning model. Accuracy disparity is a generaliza-
tion of the equality of opportunity metric, and is jus-
tified on the same grounds.
Equal Opportunity. Equal opportunity measures
the difference of true positive rate (TPR) across all
sensitive attribute groups. TPR for each sensitive at-
tribute group is defined as:
P(
ˆ
Y = 1|S = s, y = 1)
∀s ∈ {sensitive attribute group}
For a classifier that perfectly satisfies equal oppor-
tunity, the TPRs are the same across all sensitive at-
tribute groups.
Accuracy Disparity. Accuracy disparity is similar
to equal opportunity. It measures the difference of ac-
curacy across all sensitive attribute groups. Accuracy
is defined as:
P(
ˆ
Y = 1|S = s, y = 1) +P(
ˆ
Y = 0|S = s, y = 0)
P(S = s)
∀s ∈ {sensitive attribute group}
For a classifier that perfectly satisfies accuracy
disparity, the accuracy scores should be the same
across all groups.
Computing Fairness Measures. In this work, we
focus on multivariate sensitive attributes and we use
the deviation from mean to compute equal opportu-
nity and accuracy disparity. It is defined as:
1
n
n
∑
i=i
|( f
i
) −
¯
F|
where n is the number of sensitive attribute
groups, f
i
is the fairness score (TPR or accuracy) for
the i
th
sensitive attribute group and
¯
X is the mean
value of the fairness score (TPR or accuracy) across
all sensitive attribute groups. In both fairness met-
rics, we want the deviation to be as small as possi-
ble, thereby indicting that the machine learning model
perform equally well on each group.
5.2.2 Model Performance and Fairness
Measurement
For both data sets, we use the train/test split approach
to measure the model performance and fairness. We
randomly select 20% of the raw data as the hold out
set for testing and the remaining 80% as the training
data. In the fine tuning step, we further conduct strat-
ified sampling on the training data as the hold out set
for fine tuning. In particular, we randomly select a
fixed number of individuals from each subgroup to
fine tune the pre-trained model.
To evaluate the model performance and fairness,
we compute the metrics on the hold out set. For model
performance, we use accuracy and true positive rate
(TPR) for each subgroup. We use true positive rate
in addition to accuracy because in disease prediction,
getting a wrong predictive outcome may lead to a mis-
diagnosis (overdiagnosis or underdiagnosis). In heart
disease and ADRD prediction, underdiagnosis could
be more harmful since it can lead to a delayed diagno-
sis and lost opportunity to have an early intervention
(Ginsberg et al., 2014; Wenger, 2012). Compared to
accuracy, TPR can better measure underdiagosis of
disease. For fairness, we use equal opportunity and
accuracy disparity.
5.2.3 Machine Learning Models
Because our focus is on fairness, we present dif-
ferent fairness measures on an artificial neural net-
work model. We tested some classic models (decision
tree, random forest, logistic regression and SVM), but
none of them performed as well. Due to space con-
straint, we focus our analysis on the artificial neural
network models.
5.2.4 Bias Mitigation Algorithms
Table 2: Subgroup distribution in MS-CCP data.
Proportion
White 0.8
Black 0.1
Hispanic < 0.05
Asian < 0.02
Others/unknown < 0.01
Native American < 0.01
To evaluate the effectiveness of proposed fine tuning
approach, we compare the proposed approach against
two existing bias mitigation algorithms: resampling
and training a separate model for each group.
Resampling. Wang and Singh propose resampling
to improve fairness with binary sensitive attribute
HEALTHINF 2025 - 18th International Conference on Health Informatics
246

Table 3: Model performance on UCI heart disease data with binary sex sensitive attribute.
Without fixing Fine tuning Resampling Training by group
Accuracy TPR Accuracy TPR Accuracy TPR Accuracy TPR
Male 0.78 0.673 0.804 0.786 0.829 0.814 0.805 0.728
Female 0.95 0.857 0.839 0.767 0.858 0.776 0.75 0.767
Overall 0.836 0.745 0.822 0.786 0.829 0.796 0.786 0.741
(Wang and Singh, 2021). We extend the resampling
method from Wang and Singh described in Section
2.2 to the multivariate setting. The goal of resampling
is to remove selection bias and selection bias occurs if
some groups in the sample are oversampled and oth-
ers are undersampled. If the data set is unbiased, we
should observe statistical independence between the
sensitive attribute S and outcome Y . It is defined as:
P
exp
(S = s, Y = y) = P(S = s) ×P(Y = y)
∀s ∈ {sensitive attribute group}, y ∈ {0, 1}
Separate Model for Each Subgroup. Another
strategy is to individually train a separate model for
each subgroup instead of building a single model
containing training examples from all the subgroups.
This second baseline uses the available training for
each subgroup to training a separate model for the
subgroup.
5.2.5 MS-CCP Synthetic Data Generation
One advantage of synthetic data generator is the abil-
ity to manipulate the sample distribution. To test the
effectiveness of different bias mitigation algorithms,
including the proposed fine tuning approach, we cre-
ate three synthetic data sets with different sample dis-
tributions: the original, balanced by outcome label
only (Y ), and balanced by subgroup only (S).
The original data set has the same distribution
as the 5% random sample of the MS-CCP merged
data. The overall ratio of non-ADRD to ADRD is
approximately 8 to 1. Table 2 shows the racial sub-
group distribution in the MS-CCP data.
3
We see that
the sample is very imbalanced with White individ-
uals having the vast majority of samples and some
subgroups (such as Asian, Native American and oth-
ers/unknown) each having less than 2% representa-
tion in the sample. We generate synthetic data sets
using 14 features having a multivariate log normal
distribution with a linear trend on 12 temporal win-
dows.
The balanced by label data set, has a balanced la-
bel distribution, making the number of individuals di-
3
Due to privacy concerns, we only show the approxi-
mated racial distribution.
agnosed with ADRD the same as the number of in-
dividuals not diagnosed with ADRD. The subgroup
distribution is not altered. The balanced by subgroup
data set, balances the data across racial groups. In
other words, the number of individuals in each racial
group is the same and the outcome label distribution
is the same as the original sample. The two addi-
tional balanced data sets are less biased than the orig-
inal data set. While these are less realistic, we in-
clude them here to evaluate the effectiveness of the
proposed fine tuning approach on input data with dif-
ferent levels of bias.
6 EXPERIMENTS
Table 4: Model fairness on UCI heart disease data set with
binary sex sensitive attribute.
Accuracy
disparity
Equal
opportunity
Without fixing 0.09 0.092
Fine tuning 0.013 0.01
Resampling 0.014 0.015
Training by group 0.02 0.02
6.1 Heart Disease Prediction
Table 3 shows the neural network model performance
on the UCI heart disease data. Recall, that the sensi-
tive attribute for this data set is a binary sex variable.
Each row shows the results for a specific subgroup.
Comparing the overall results across fixing methods,
we see that the accuracy without fixing is 1% to 5%
more accurate than after applying a fixing method,
while the TPR is higher for the resampling and fine
tuning fixing methods. In general, the training by
group performs worse than the other two fixing meth-
ods, particularly on the female subgroup because of
the imbalanced training data. Table 4 shows the fair-
ness scores on the UCI heart disease data with the sex
sensitive attribute. Each row shows the fixing method
and each column shows a fairness metric: accuracy
disparity and equal opportunity. We see that all three
methods have similar fairness scores that are large im-
provements (7% improvement in accuracy disparity
and 7-8% improvement in equal opportunity) over the
fairness scores when fixing is not applied. The im-
Using Under-Represented Subgroup Fine Tuning to Improve Fairness for Disease Prediction
247

Table 5: Model performance on UCI heart disease data with multivariate age sensitive attribute.
Without fixing Fine tuning Resampling Training by group
Accuracy TPR Accuracy TPR Accuracy TPR Accuracy TPR
Age bin 1 0.84 0.4 0.833 0.75 0.817 0.692 0.791 0.625
Age bin 2 0.853 0.789 0.842 0.784 0.819 0.741 0.675 0.688
Age bin 3 0.696 0.696 0.796 0.783 0.773 0.744 0.671 0.727
Overall 0.836 0.715 0.828 0.775 0.813 0.73 0.687 0.672
Table 6: Model fairness on UCI heart disease data with mul-
tivariate age sensitive attribute.
Accuracy
disparity
Equal
opportunity
Without fixing 0.067 0.152
Fine tuning 0.009 0.015
Resampling 0.017 0.022
Training by group 0.052 0.037
provements are statistically significant.
Table 5 shows the neural network model perfor-
mance on UCI heart disease data set when the sensi-
tive attribute is multivariate age. Similar to binary sex,
fixing using fine tuning or resampling have similar ac-
curacy model performance compared to the baseline
model, whereas fixing using the training by subgroup
approach has the worst model performance with an
accuracy that is 15% lower and a TPR that is 5%
lower. Again, this results because of the imbalanced
data, with some subgroups having an even smaller
sample size than the sex sensitive attribute. Table 6
shows the fairness scores when applying different fix-
ing methods for the age sensitive attribute. Among
the three bias mitigation approaches, fine tuning has
the highest fairness score with a 6% improvement in
accuracy disparity and a 13% improvement in equal
opportunity. Resampling has similar results as fine
tuning but the improvement is smaller. Training by
group has little improvement (1.5%) in accuracy dis-
parity, but the improvement in equal opportunity is
11%. This improvement is statistically significant
over without fixing. When comparing all three bias
mitigation algorithms, fine tuning has the best perfor-
mance in terms of fairness improvement and overall
model performance.
6.2 ADRD Prediction
We now present results on ADRD prediction using
three synthetic data sets with different distributions
based on a random 5% sample that uses approxi-
mately 2% of the feature set.
6.2.1 Original Distribution
Table 7 shows the model performance on synthetic
data with the same subgroup and label distribution as
the MS-CCP data (Table 2). Across three bias miti-
gation algorithms, they all have similar overall accu-
racy (within 1% difference) and a relatively close TPR
(within 4%). However, if we look at the subgroups,
the resampling and the training by group methods
have much worse performance on small subgroups
(Asian, Native American and others/unknown pop-
ulation), whereas the proposed fine tuning approach
has more consistent accuracy and TPR across all sub-
groups, small and large. In resampling, when the
subgroup is very small, the algorithm replicates the
same individuals multiple times. The model is un-
likely to learn much new information about the sub-
group from repeated entries and may overfit the train-
ing data. When using the training by group approach,
for the smaller groups, the sample size is too small
to train a good model, leading to model underfitting.
For example, there are less than 1% Native American
individuals in the sample, decreasing the likelihood
of building an effective neural network model. On
the other hand, the proposed fine tuning approach is
able to first build a good pre-trained model contain-
ing knowledge about predicting ADRD using a large
random sample of all the observations. Then this pre-
trained model is fine tuned using samples from each
subgroups with less representation. This improves
each model’s understanding of the specific subgroup
of interest.
Table 8 shows the fairness scores on the synthetic
data mapping to the original distribution. Fine tuning
has the best fairness score with an improvement in
accuracy disparity of over 3% and an improvement in
equal opportunity of 9%. Fixing using resampling has
a less than 1% improvement in accuracy disparity and
a 4% improvement in equal opportunity. Fixing using
the training by group method has the worst accuracy
disparity (about 2% worse) and no change in equal
opportunity. The improvement on fairness in the fine
tuning approach is statistically significant over the
fairness without fixing and the other two baseline bias
mitigation algorithms.
6.2.2 Balanced by Label Sample
In this sample, the number of individuals with and
without the disease is the same. Tables 9 and 10 show
the model performance and fairness for this experi-
HEALTHINF 2025 - 18th International Conference on Health Informatics
248

Table 7: Model performance on synthetic data with original distribution.
Without fixing Fine tuning Resampling Training by group
Accuracy TPR Accuracy TPR Accuracy TPR Accuracy TPR
White 0.799 0.482 0.787 0.529 0.794 0.502 0.796 0.519
Black 0.822 0.415 0.816 0.555 0.811 0.447 0.808 0.529
Asian 0.702 0.085 0.812 0.522 0.692 0.299 0.626 0.302
Hispanic 0.698 0.263 0.792 0.542 0.741 0.392 0.699 0.497
Native American 0.702 0.313 0.798 0.513 0.712 0.348 0.602 0.311
Others/unknown 0.731 0.317 0.826 0.538 0.791 0.376 0.645 0.339
Overall 0.804 0.481 0.795 0.526 0.794 0.506 0.796 0.492
Table 8: Model fairness on synthetic data with original dis-
tribution.
Accuracy
disparity
Equal
opportunity
Without fixing 0.049 0.102
Fine tuning 0.012 0.011
Resampling 0.041 0.062
Training by group 0.067 0.099
ment, respectively. The results are very similar to the
previous experiment in terms of model performance.
All the fixing methods have a similar accuracy and
TPR. But the subgroup performance has more vari-
ation since the sample is balanced by outcome label
only and the subgroup distribution is still very im-
balanced. In terms of fairness, similar to the orig-
inal sample, the fine tuning approach performs the
best, but the improvement is not as significant (2%
improvement) for accuracy disparity and equal oppor-
tunity. Training by group performs the worst in terms
of accuracy disparity and about the same for equal op-
portunity.
6.2.3 Balanced by Subgroup Sample
The number of individuals in each racial subgroup is
the same and the label distribution remains the same
as the MS-CCP data in this sample. Tables 11 and 12
show the model performance and fairness. In terms
of model performance, the baseline, fixing using fine
tuning and resampling have similar accuracies (within
1%) and TPR (within 4%). Fixing using training by
group has a much lower accuracy (4-5% lower) be-
cause each subgroup has the same number of obser-
vations, leading to insufficient data for all the groups.
In terms of fairness scores, all the methods have ap-
proximately the same fairness score (less than 1% dif-
ference).
6.3 Discussion
Our results for the heart disease and ADRD prediction
tasks show that the proposed fine tuning approach ef-
fectively increases the fairness of the machine learn-
ing models. It performs particularly well when the
sensitive attribute is multivariate and the subgroup
distribution is very imbalanced. The design of the fine
tuning approach takes advantage of the large amount
of training data from the majority subgroups to build a
pre-trained model that has reasonable overall knowl-
edge about the prediction task and the fine tuning step
allows the pre-trained model to learn more specific in-
formation about each subgroup. Other advantages of
the fine tuning approach include its flexibility to work
with any number of subgroups, any type of loss func-
tion, and any type of deep learning model.
This work focuses on machine learning model
fairness for disease prediction with multivariate sensi-
tive attribute. We acknowledge that the fine tuning ap-
proach with deep learning is not clinically explainable
and interpretable and may not be appropriate to ap-
ply in real applications. We consider a clinical analy-
sis that considers information about treatments, costs,
model explainability, etc., an important next step.
As we mentioned in Section 5.2.1, we only con-
sider two fairness metrics, accuracy disparity and
equal opportunity. While an important first step, fu-
ture work should evaluate the performance of pro-
posed fine tuning approach on other fairness metrics.
Also, in our analysis, we used the original data set
sizes to determine the number of observations used
for fine tuning. Future work can consider analyzing
the minimum amount of data required for fine tuning
each underrepresented subgroup. Another direction
would combine information from multiple sensitive
attributes to ensure fairness across all of them. Within
that setting, there are many more subgroups and the
minority groups will have even smaller amounts of
available training data. Therefore, this fine tuning
approach may not be as effective without combining
subgroups that are similar.
Lastly, there are two types of bias to consider
when working on disease prediction: the algorithmic
bias we study in this paper and bias associated with
the probability of diagnosis. Demographic disparities
in the probability of diagnosis are common when di-
agnosing different diseases and would be an impor-
Using Under-Represented Subgroup Fine Tuning to Improve Fairness for Disease Prediction
249

Table 9: Model performance on synthetic data with balanced by label sample.
Without fixing Fine tuning Resampling Training by group
Accuracy TPR Accuracy TPR Accuracy TPR Accuracy TPR
White 0.854 0.794 0.858 0.802 0.851 0.778 0.852 0.791
Black 0.817 0.822 0.859 0.812 0.809 0.802 0.813 0.812
Asian 0.925 0.771 0.917 0.808 0.891 0.773 0.718 0.706
Hispanic 0.856 0.761 0.869 0.784 0.846 0.758 0.789 0.752
Native American 0.934 0.859 0.901 0.863 0.899 0.856 0.662 0.754
Others/unknown 0.919 0.724 0.909 0.822 0.904 0.719 0.735 0.741
Overall 0.857 0.799 0.859 0.823 0.852 0.782 0.836 0.808
Table 10: Model fairness on synthetic data with balanced
by label sample.
Accuracy
disparity
Equal
opportunity
Without fixing 0.042 0.037
Fine tuning 0.024 0.018
Resampling 0.032 0.024
Training by group 0.057 0.028
tant extension to our work.
7 ETHICAL CONSIDERATIONS
Given the fundamental importance of health to peo-
ple’s well-being, disease prediction is one of the
most consequential areas for algorithmic decision-
making. An inaccurate prediction concerning a med-
ical diagnosis can have dire consequences. A per-
son might miss out on treatment they need, or be
given unnecessary treatment that carries damaging
side effects. Moreover, many societies, including the
United States, have a long history of inequality and
injustice in the distribution of medical care and re-
sources (Chen et al., 2023). Historically, people from
marginalized groups receive fewer resources and sub-
par care. Models that inherit bias from the historical
data they are trained on—or from other sources in the
machine learning development pipeline—can com-
pound or exacerbate existing injustices in the distribu-
tion of medical care.When there are limitations in the
available data for marginalized or minority groups,
this too can result in subpar performance and thus
have similarly unjust results.
This paper offers a novel technical method for
building fairer machine learning models. The goal is
to lessen the degree to which algorithmic decision-
making contributes to unjust disparities in healthcare.
The fine tuning method presented in this paper pro-
motes a more equal distribution of accuracy and error
faced by decision subjects receiving disease predic-
tions from a machine learning model.
However, the use of technical solutions—
including the appeal to formal fairness metrics—
raises concerns of “techno-solutionism” and “ethics-
washing”. Specifically, there is a concern that tech-
nical solutions will be used exclusively, and perhaps
used as an excuse to avoid other efforts to combat
injustice (Grote and Keeling, 2022; Fazelpour and
Danks, 2021). However, while technical fairness
methods are insufficient for ensuring justice in dis-
ease prediction, they are still one valuable tool among
many. Achieving a just distribution of healthcare ac-
cess and medical resources is a complex and difficult
problem. Any full solution to that problem will re-
quire a variety of efforts, potentially including signif-
icant changes to existing social institutions and power
structures. The fine tuning methods discussed here
promote a more equal distribution of the risk of error
across important subpopulations. It is only one piece
of a complex solution to equitably improve health out-
comes for all subgroups.
8 FINAL THOUGHTS
This work studies machine learning fairness in dis-
ease prediction when the sensitive attribute is mul-
tivariate and the training data for different sensitive
attribute subgroups is imbalanced. Our method im-
proves fairness by fine tuning a pretrained model
using examples from subgroups that are underrep-
resented in the base model. We demonstrate the
effectiveness of our approach on heart disease and
Alzheimer’s Disease and Related Dementias (ADRD)
prediction using real and synthetic data. We also in-
troduce a synthetic data generator that uses basic ag-
gregated statistics such as mean, median, and standard
deviation to generator temporal synthetic data with
varying levels of sparsity. This is particularly impor-
tant in the health domain where patient data needs to
remain private.
On four data sets, the UCI heart disease data and
three synthetic data sets with different distributions,
we find that the fine tuning approach can effectively
improve machine learning model fairness, especially
when the subgroup distribution is very imbalanced.
HEALTHINF 2025 - 18th International Conference on Health Informatics
250

Table 11: Model performance on synthetic data with balanced by subgroup sample.
Without fixing Fine tuning Resampling Training by group
Accuracy TPR Accuracy TPR Accuracy TPR Accuracy TPR
White 0.782 0.398 0.789 0.452 0.769 0.439 0.742 0.403
Black 0.789 0.374 0.783 0.439 0.781 0.398 0.751 0.386
Asian 0.813 0.358 0.825 0.399 0.799 0.387 0.749 0.369
Hispanic 0.782 0.377 0.788 0.402 0.764 0.4 0.736 0.385
Native American 0.858 0.419 0.848 0.431 0.851 0.433 0.78 0.422
Others/unknown 0.849 0.356 0.797 0.389 0.839 0.398 0.801 0.378
Overall 0.812 0.385 0.805 0.419 0.801 0.41 0.76 0.391
Table 12: Model fairness on synthetic data with balanced
by subgroup sample.
Accuracy
disparity
Equal
opportunity
Without fixing 0.024 0.016
Fine tuning 0.018 0.019
Resampling 0.02 0.015
Training by group 0.025 0.017
Due to privacy considerations of financial and health
data, we are not releasing the parameters of the real
data or the generated synthetic data. However, we re-
lease the code for our synthetic data generator to help
researchers working with private data create data sets
that can be used to improve models for disease pre-
diction.
ACKNOWLEDGMENTS
This research was funded by the National Institute
on Aging of the National Institutes of Health under
award #R01AG080623, and the Massive Data Insti-
tute (MDI) at Georgetown University. We thank our
funders for supporting this work.
The content of and views expressed in this paper
are ours alone and do not necessarily represent the
official views of the National Institutes of Health or
the Federal Reserve Bank of New York or the Federal
Reserve System.
REFERENCES
Agarwal, S. and Muckley, C. B. (2024). Money manage-
ment difficulties and older people: Detection of early-
stage dementia in financial data. Michael J. Brennan
Irish Finance Working Paper Series.
Allen, A., Mataraso, S., Siefkas, A., Burdick, H., Braden,
G., Dellinger, R. P., McCoy, A., Pellegrini, E., Hoff-
man, J., Green-Saxena, A., et al. (2020). A racially
unbiased, machine learning approach to prediction of
mortality: algorithm development study. JMIR public
health and surveillance, 6(4):e22400.
Arumugam, K., Naved, M., Shinde, P. P., Leiva-Chauca, O.,
Huaman-Osorio, A., and Gonzales-Yanac, T. (2023).
Multiple disease prediction using machine learning al-
gorithms. Materials Today: Proceedings, 80:3682–
3685.
Barocas, S., Hardt, M., and Narayanan, A. (2023). Fairness
and Machine Learning: Limitations and Opportuni-
ties. MIT Press.
Barthold, D., Joyce, G., Ferido, P., Drabo, E. F., Marcum,
Z. A., Gray, S. L., and Zissimopoulos, J. (2020). Phar-
maceutical treatment for alzheimer’s disease and re-
lated dementias: utilization and disparities. Journal of
Alzheimer’s Disease, 76(2):579–589.
Berk, R., Heidari, H., Jabbari, S., Kearns, M., and Roth, A.
(2021). Fairness in criminal justice risk assessments:
The state of the art. Sociological Methods & Research,
50(1):3–44.
Binns, R. (2018). Fairness in machine learning: Lessons
from political philosophy. In Conference on Fair-
ness, Accountability and Transparency, pages 149–
159. PMLR.
Center for Democracy & Technology (2024).
AI & Machine Learning.
Chae, S., Davoudi, A., Song, J., Evans, L., Hobensack, M.,
Bowles, K. H., McDonald, M. V., Barrón, Y., Rossetti,
S. C., Cato, K., et al. (2023). Predicting emergency de-
partment visits and hospitalizations for patients with
heart failure in home healthcare using a time series
risk model. Journal of American Medical Informatics
Association, 30(10):1622–1633.
Chakraborty, J., Majumder, S., and Menzies, T. (2021). Bias
in machine learning software: Why? how? what to
do? In Conference and Symposium on the Founda-
tions of Software Engineering, pages 429–440.
Chawla, N. V., Bowyer, K. W., Hall, L. O., and Kegelmeyer,
W. P. (2002). Smote: synthetic minority over-
sampling technique. Journal of Artificial Intelligence
Research, 16:321–357.
Chen, R. J., Wang, J. J., Williamson, D. F., Chen, T. Y.,
Lipkova, J., Lu, M. Y., Sahai, S., and Mahmood, F.
(2023). Algorithmic fairness in artificial intelligence
for medicine and healthcare. Nature Biomedical En-
gineering, 7(6):719–742.
Chen, Z., Zhang, J. M., Sarro, F., and Harman, M. (2022).
Maat: a novel ensemble approach to addressing fair-
ness and performance bugs for machine learning soft-
ware. In Conference and Symposium on the Founda-
tions of Software Engineering, pages 1122–1134.
Using Under-Represented Subgroup Fine Tuning to Improve Fairness for Disease Prediction
251

Chen, Z., Zhang, J. M., Sarro, F., and Harman, M.
(2024). Fairness improvement with multiple protected
attributes: How far are we? In Conference on Soft-
ware Engineering.
Davoudi, A., Chae, S., Evans, L., Sridharan, S., Song,
J., Bowles, K. H., McDonald, M. V., and Topaz, M.
(2024). Fairness gaps in machine learning models for
hospitalization and emergency department visit risk
prediction in home healthcare patients with heart fail-
ure. Journal of Medical Informatics, page 105534.
Doecke, J. D., Laws, S. M., Faux, N. G., Wilson, W., Burn-
ham, S. C., Lam, C.-P., Mondal, A., Bedo, J., Bush,
A. I., Brown, B., et al. (2012). Blood-based pro-
tein biomarkers for diagnosis of alzheimer disease.
Archives of neurology, 69(10):1318–1325.
Fatima, M. and Pasha, M. (2017). Survey of machine learn-
ing algorithms for disease diagnostic. Journal of In-
telligent Learning Systems and Applications, 9(01):1–
16.
Fazelpour, S. and Danks, D. (2021). Algorithmic bias:
Senses, sources, solutions. Philosophy Compass,
16(8):e12760.
FDA (2022). Clinical decision support software: guidance
for industry and food and drug administration staff.
FDA Digirepo. NLM. NIH.
Feldman, M., Friedler, S. A., Moeller, J., Scheidegger, C.,
and Venkatasubramanian, S. (2015). Certifying and
removing disparate impact. In Conference on Knowl-
edge Discovery and Data Mining, pages 259–268.
Feng, Q., Du, M., Zou, N., and Hu, X. (2024). Fair machine
learning in healthcare: A survey. IEEE Transactions
on Artificial Intelligence.
Frisoni, G. (2001). Structural imaging in the clinical diag-
nosis of alzheimer’s disease: problems and tools.
Ginsberg, Y., Quintero, J., Anand, E., Casillas, M.,
and Upadhyaya, H. P. (2014). Underdiagnosis of
attention-deficit/hyperactivity disorder in adult pa-
tients: a review of the literature. The Primary Care
Companion for CNS Disorders, 16(3):23591.
Grampurohit, S. and Sagarnal, C. (2020). Disease predic-
tion using machine learning algorithms. In Confer-
ence for Emerging Technology, pages 1–7. IEEE.
Gresenz, C. R., Mitchell, J. M., Marrone, J., and Federoff,
H. J. (2020). Effect of early-stage alzheimer’s disease
on household financial outcomes. Health Economics,
29(1):18–29.
Gresenz, C. R., Mitchell, J. M., Rodriguez, B., Turner, R. S.,
and Van der Klaauw, W. (2024). The financial conse-
quences of undiagnosed memory disorders. The Fed-
eral Reserve Bank of New York.
Grote, T. and Keeling, G. (2022). Enabling fairness in
healthcare through machine learning. Ethics and In-
formation Technology, 24(3):39.
Hardt, M., Price, E., and Srebro, N. (2016). Equality of op-
portunity in supervised learning. Advances in Neural
Information Processing Systems, 29.
Houlsby, N., Giurgiu, A., Jastrzebski, S., Morrone, B.,
De Laroussilhe, Q., Gesmundo, A., Attariyan, M., and
Gelly, S. (2019). Parameter-efficient transfer learning
for nlp. In Conference on Machine Learning, pages
2790–2799. PMLR.
Howard, J. and Ruder, S. (2018). Universal language model
fine-tuning for text classification. arXiv preprint
arXiv:1801.06146.
Janosi, A., Steinbrunn, W., Pfisterer, M., and Detrano, R.
(1988). Heart Disease. UCI Machine Learning Repos-
itory. DOI: https://doi.org/10.24432/C52P4X.
Jiang, F., Jiang, Y., Zhi, H., Dong, Y., Li, H., Ma, S., Wang,
Y., Dong, Q., Shen, H., and Wang, Y. (2017). Arti-
ficial intelligence in healthcare: past, present and fu-
ture. Stroke and Vascular Neurology, 2(4).
Kamiran, F. and Calders, T. (2012). Data preprocessing
techniques for classification without discrimination.
Knowledge and Information Systems, 33(1):1–33.
Kang, J., Xie, T., Wu, X., Maciejewski, R., and Tong, H.
(2022). Infofair: Information-theoretic intersectional
fairness. In Conference on Big Data, pages 1455–
1464. IEEE.
Li, F., Wu, P., Ong, H. H., Peterson, J. F., Wei, W.-Q.,
and Zhao, J. (2023). Evaluating and mitigating bias
in machine learning models for cardiovascular dis-
ease prediction. Journal of Biomedical Informatics,
138:104294.
Liu, X., He, P., Chen, W., and Gao, J. (2019). Multi-task
deep neural networks for natural language understand-
ing. arXiv preprint arXiv:1901.11504.
Loi, M., Herlitz, A., and Heidari, H. (2021). Fair equality
of chances for prediction-based decisions. Economics
& Philosophy, pages 1–24.
Ma, J., Deng, J., and Mei, Q. (2021). Subgroup generaliza-
tion and fairness of graph neural networks. Advances
in Neural Information Processing Systems, 34:1048–
1061.
Massey Jr, F. J. (1951). The kolmogorov-smirnov test for
goodness of fit. Journal of the American statistical
Association, 46(253):68–78.
Min, B., Ross, H., Sulem, E., Veyseh, A. P. B., Nguyen,
T. H., Sainz, O., Agirre, E., Heintz, I., and Roth, D.
(2023). Recent advances in natural language process-
ing via large pre-trained language models: A survey.
ACM Computing Surveys, 56(2):1–40.
Paraskevaidi, M., Morais, C. L., Halliwell, D. E., Mann,
D. M., Allsop, D., Martin-Hirsch, P. L., and Mar-
tin, F. L. (2018). Raman spectroscopy to diagnose
alzheimer’s disease and dementia with lewy bodies
in blood. ACS Chemical Neuroscience, 9(11):2786–
2794.
Peng, K., Chakraborty, J., and Menzies, T. (2022). Fair-
mask: Better fairness via model-based rebalancing of
protected attributes. Transactions on Software Engi-
neering, 49(4):2426–2439.
Pleiss, G., Raghavan, M., Wu, F., Kleinberg, J., and Wein-
berger, K. Q. (2017). On fairness and calibration. Ad-
vances in Neural Information Processing Systems, 30.
Rathore, S., Habes, M., Iftikhar, M. A., Shacklett, A., and
Davatzikos, C. (2017). A review on neuroimaging-
based classification studies and associated feature ex-
traction methods for alzheimer’s disease and its pro-
dromal stages. NeuroImage, 155:530–548.
HEALTHINF 2025 - 18th International Conference on Health Informatics
252

Raza, S., Pour, P. O., and Bashir, S. R. (2023). Fairness in
machine learning meets with equity in healthcare. In
AAAI Symposium Series, volume 1, pages 149–153.
Secinaro, S., Calandra, D., Secinaro, A., Muthurangu, V.,
and Biancone, P. (2021). The role of artificial in-
telligence in healthcare: a structured literature re-
view. BMC Medical Informatics and Decision Mak-
ing, 21:1–23.
Shah, D., Patel, S., and Bharti, S. K. (2020). Heart dis-
ease prediction using machine learning techniques. SN
Computer Science, 1(6):345.
Shui, C., Xu, G., Chen, Q., Li, J., Ling, C. X., Arbel, T.,
Wang, B., and Gagné, C. (2022). On learning fair-
ness and accuracy on multiple subgroups. Advances
in Neural Information Processing Systems, 35:34121–
34135.
Singh, A. and Kumar, R. (2020). Heart disease prediction
using machine learning algorithms. In Conference on
Electrical and Electronics Engineering, pages 452–
457. IEEE.
Straw, I., Rees, G., and Nachev, P. (2024). Sex-based perfor-
mance disparities in machine learning algorithms for
cardiac disease prediction: Exploratory study. Journal
of Medical Internet Research, 26:e46936.
Sun, C., Qiu, X., Xu, Y., and Huang, X. (2019). How to
fine-tune bert for text classification? In Chinese com-
putational linguistics, pages 194–206. Springer.
Tarzanagh, D. A., Hou, B., Tong, B., Long, Q., and Shen,
L. (2023). Fairness-aware class imbalanced learning
on multiple subgroups. In Uncertainty in Artificial In-
telligence, pages 2123–2133. PMLR.
Wang, Y. and Singh, L. (2021). Analyzing the impact of
missing values and selection bias on fairness. In-
ternational Journal of Data Science and Analytics,
12(2):101–119.
Wenger, N. K. (2012). Women and coronary heart disease:
a century after herrick: understudied, underdiagnosed,
and undertreated. Circulation, 126(5):604–611.
Xie, S., Yu, Z., and Lv, Z. (2021). Multi-disease prediction
based on deep learning: a survey. Computer Modeling
in Engineering & Sciences, 128(2):489–522.
Yu, K.-H., Beam, A. L., and Kohane, I. S. (2018). Artificial
intelligence in healthcare. Nature Biomedical Engi-
neering, 2(10):719–731.
Yuan, C., Linn, K. A., and Hubbard, R. A. (2023). Al-
gorithmic fairness of machine learning models for
alzheimer disease progression. JAMA Network Open,
6(11):e2342203–e2342203.
Zafar, M. B., Valera, I., Rodriguez, M., Gummadi, K., and
Weller, A. (2017). From parity to preference-based
notions of fairness in classification. Advances in Neu-
ral Information Processing Systems, 30.
Using Under-Represented Subgroup Fine Tuning to Improve Fairness for Disease Prediction
253
