
Reproducible Gating for High-Resolution Flow Cytometric
Characterization of Extracellular Vesicles in Next-Generation Biomarker
Studies
Ishwor Thapa
1 a
, Yohan Kim
2 b
, Fabrice Lucien
2 c
and Hesham Ali
1 d
1
College of Information Science and Technology, University of Nebraska at Omaha, Omaha, U.S.A.
2
Department of Urology, Mayo Clinic, Rochester, U.S.A.
Keywords:
Extracellular Vesicles, High Resolution Flow Cytometry, Automated Gating, Reproducibility and Robustness,
Biological Signals, FCS.
Abstract:
With the continuous advancements of biomedical technologies, we have access to instruments capable of
producing new types of biological data or generating traditional data with higher degrees of quality. With
the support of such data, researchers and practitioners continue to explore the possibilities of developing new
approaches to obtain valuable data-driven signatures or biosignals to be used for diagnosis, classification, or
assessment of treatments. However, with the emergence of new types of data, it is often the case that they
are available in raw formats that are not suitable for extracting the needed biomarkers. Hence, much work
is needed to process the raw data sets obtained from new medical instruments and transform the signals into
products capable of capturing the desired knowledge. Next-generation biomarkers such as “liquid biopsies” are
emerging tools to improve cancer diagnostics, disease stratification, and treatment monitoring. As potential
cancer biomarkers, circulating Extracellular Vesicles (EV) levels may early-predict disease recurrence and
resistance to treatment. High-resolution flow cytometry (hrFC) is a sensitive and high-throughput method for
quantifying circulating levels of EVs with minimal sample processing. One of the benefits of using hrFC
is that there is no need to isolate or purify the molecules of interest from the biological samples prior to
running the flow. However, signals in hrFC data currently depend on manual and subjective approaches to
gating the positive events. Such approaches are often time-consuming, error-prone, and lack the levels of
robustness and reproducibility needed to trust the obtained information. This study proposes an automated
quantitative technique to process flow cytometry data for EVs with a high degree of accuracy consistency. A
publicly available Shiny web application is presented that performs quality check of flow cytometry files and
automated gating of biosignals, viz. subpopulations of EVs that are of interest to next generation biomarker
studies.
1 INTRODUCTION
According to the International Society for Extracel-
lular Vesicles (ISEV), extracellular vesicle (EV) is
a generic term for particles naturally released from
the cell that are delimited by a lipid bilayer and can-
not replicate, i.e. do not contain a functional nu-
cleus (Th
´
ery et al., 2018). EVs are heterogenous in
size (<100nm to >1µm) and their distribution fol-
lows a power-law function, meaning that the large
a
https://orcid.org/0000-0002-3594-1631
b
https://orcid.org/0000-0002-2378-0068
c
https://orcid.org/0000-0001-6149-345X
d
https://orcid.org/0000-0002-8016-6144
number of EVs of small size are observed and the
concentration of EVs decreases with increasing size.
EVs are released by normal and malignant cells in
body fluids such as blood and urine. Various stud-
ies have shown that circulating EVs may be the next-
generation of biomarkers for the management of mul-
tiple diseases including cancers, neurodegenerative
diseases and chronic liver diseases (Lucien et al.,
2022), (Samuel et al., 2018), (Pan et al., 2023), (El-
lison et al., 2023), (Ohmichi et al., 2019), (Aharon
et al., 2020), (Newman et al., 2022).
EVs can be extracted from biofluids like plasma
and urine in a wet-lab setting. This is of great
significance in a clinical setting because with this
technology, EVs can directly be characterized from
1020
Thapa, I., Kim, Y., Lucien, F. and Ali, H.
Reproducible Gating for High-Resolution Flow Cytometric Characterization of Extracellular Vesicles in Next-Generation Biomarker Studies.
DOI: 10.5220/0013318900003911
Paper published under CC license (CC BY-NC-ND 4.0)
In Proceedings of the 18th International Joint Conference on Biomedical Engineering Systems and Technologies (BIOSTEC 2025) - Volume 1, pages 1020-1027
ISBN: 978-989-758-731-3; ISSN: 2184-4305
Proceedings Copyright © 2025 by SCITEPRESS – Science and Technology Publications, Lda.

the biofluids. The isolation of EVs are often com-
plemented with antibody labeling of known mark-
ers such as Mammaglobin-A in breast cancer plasma
samples and PSMA in prostate cancer plasma or
urine samples to identify cancer marker enriched
EVs (Salmond et al., 2021), (Lucien et al., 2022).
The diluted EV fractions are then run through High
Resolution Flow Cytometry (hrFC) allowing high-
throughput detection and immunophenotyping of EVs
at the single-particle level (Kim et al., 2022). Us-
ing hrFC, it was observed that the levels of circu-
lating prostate cancer-specific extracellular vesicles
(PCEVs) were found to be the highest in metastatic
castration-resistant prostate cancer (mCRPC) patients
and were the lowest in localized prostate cancer (Lu-
cien et al., 2022). To address variability in EV exper-
iments, two initiatives viz. a) calibration of flow cy-
tometers in standard units and standardization of de-
tected EV concentration (van der Pol et al., 2018), and
b) transparent reporting (Welsh et al., 2020b) have
been established. The MIFLowCyt-EV framework
requires standardization of reporting the steps under-
taken, including experiment design, sample prepara-
tion, assay control, instrument calibration and data ac-
quisition (Welsh et al., 2020b). The implementation
of this framework is adapted into a public repository
for EV flow cytometry data (Arce et al., 2023). Addi-
tionally, Welsh et al. have developed FCMPass soft-
ware that provides a new method to standardize light
scatter utilizing the instrument specific sensitivity pa-
rameters (Welsh et al., 2020a).
Figure 1: Representative figure to show scatter plots of two
different fluorescence channels versus the large angle side
scatter channel.
For each captured EV particle, the forward-
scattered light, side-scattered light and dye-specific
fluorescence signals are captured and represented nu-
merically in a standard data file, called Flow Cytome-
try Standard (FCS) files. The FCS files can be visual-
ized in scatter plots with different channels on X and
Y axes. For example, in Figure 1, two different fluo-
rescence channels are plotted against the large angle
side scatter channel (LALS).
An objective method of quantification of EV lev-
els is critical in establishing the circulating EVs as
the next-generation of biomarkers. The current chal-
lenge in analyzing the flow cytometry data of EVs is
the manual gating (filtering) step where the popula-
tion of EVs that are potential markers for a biolog-
ical condition are separated from background noise.
Manual gating is not only time-consuming and user-
dependent but also error-prone, which ultimately can
result in irreproducible data. Our research goal is to
develop an automated quantitative technique to facil-
itate the manual gating process, which is key to next-
generation biomarker studies. We propose two auto-
mated gating techniques, viz. a) rectangular gating
and b) five-sided gating. In rectangular gating, the
algorithm is straight-forward and is primarily based
on minimum size of the particle and its fluorescence
level. However, this approach still captures some EVs
whose fluorescence doesn’t increase linearly with the
size. To reduce false positives, an additional point is
added in the gate to filter out EVs, which are larger
in size but not as fluorescent. Furthermore, we have
developed a web application based on Shiny R pack-
age to allow biomedical researchers to upload a FCS
file from hrFC and obtain number of positive events
in a sample using automated gating. Our tool also
summarizes the number of events for every second
over the duration of acquisition time in Flow Cytom-
etry. This provides a quality checking step in the
processing of hrFC and is a critical feature that can
identify flow runs that are prone with errors. The
results of gating obtained using the proposed auto-
mated gating pipeline show that it accurately identi-
fies the disease specific EV sub-population in an unbi-
ased manner and produces results comparable to that
of manual gating from experienced users. Addition-
ally, the method can be extended to identify unique
sub-population of EVs that can serve as significant
features in machine learning-based classification.
2 DATASET AND METHODS
2.1 EV Labeling and Quantification
In our previous work, we presented a strategy for
standardization of acquisition parameters for side-
scatter detection of extracellular vesicles (EVs) and
other particles from cell-depleted plasma and urine
(Kim et al., 2022). In this process, optimal acquisi-
tion settings such as illumination wavelength power,
side scatter triggering threshold, and flow rate for
cytometer (Apogee A60-Micro Plus) have been de-
rived to improve the sensitivity of EV detection.
PSMA and STEAP1 antibodies were labeled with two
Reproducible Gating for High-Resolution Flow Cytometric Characterization of Extracellular Vesicles in Next-Generation Biomarker Studies
1021
Alexa Fluor (AF647 and AF488) antibody labeling
kits. With desired concentration of urine and anti-
body mixture, the antibody-biofluid mixture can be
incubated to label prostate specific EVs with the an-
tibodies. Next, three technical replicates from urine
samples of thirty cancer patients were run on Apogee
A60-Micro Plus (A60MP, Apogee Flow Systems Inc.,
Northwood, UK) cytometer for 60 seconds as de-
scribed in our previous work (Kim et al., 2022). For
each run, the resulting data from cytometer are saved
in a FCS file.
2.2 FCS Files
The Flow Cytometry Standard (FCS) file provides
specifications and experimental data that includes the
light scatter and fluorescence measurements (Spidlen
et al., 2021), (Spidlen et al., 2010). The information
stored in FCS files can be read in a programming lan-
guage like R using packages such as flowCore (Hahne
et al., 2009). The flowCore package allows creation of
a flowFrame, a container storing all the metadata and
events captured in the Flow cytometry experiments
(Hahne et al., 2009). The experiment data is stored
in a matrix format that can be accessed from the exprs
slot of the flowFrame object. The rows of this matrix
represent the events and columns represent different
measurement channels including light scatter and flu-
orescence.
2.3 Quality Check Reporting
In the data section of information stored in FCS file,
the TIME variable is also stored that depicts the time
point of the event being recorded. The number of
events for every second is computed and is visualized
as a plot with additional mean and standard deviation
values (see Figure 2). It can also show how the num-
ber of events changes over time and can be used to as-
sess flow rate stability and artifacts (e.g. bubbles) that
could occur during acquisition and influence quantita-
tive analysis. In addition, boxplots are generated for
each channel to check any aberrant pattern in scatter
and fluorescence acquisition (see Figure 5).
2.4 Automated Gating for Enumeration
of EVs
Scatter plots such as one in Figure 1 show more than
49,000 events captured, among which majority of the
events belong to background noise and a small num-
ber of events (about 0.14% left and 0.33% right) are
positive events. Positive events are the EVs labeled
with a fluorescent antibody against a specific marker
0 3 6 9 12 16 20 24 28 32 36 40 44 48 52 56 60
No. of events over time
TIME
count of events
0 100 200 300 400 500 600
one standard dev.
mean
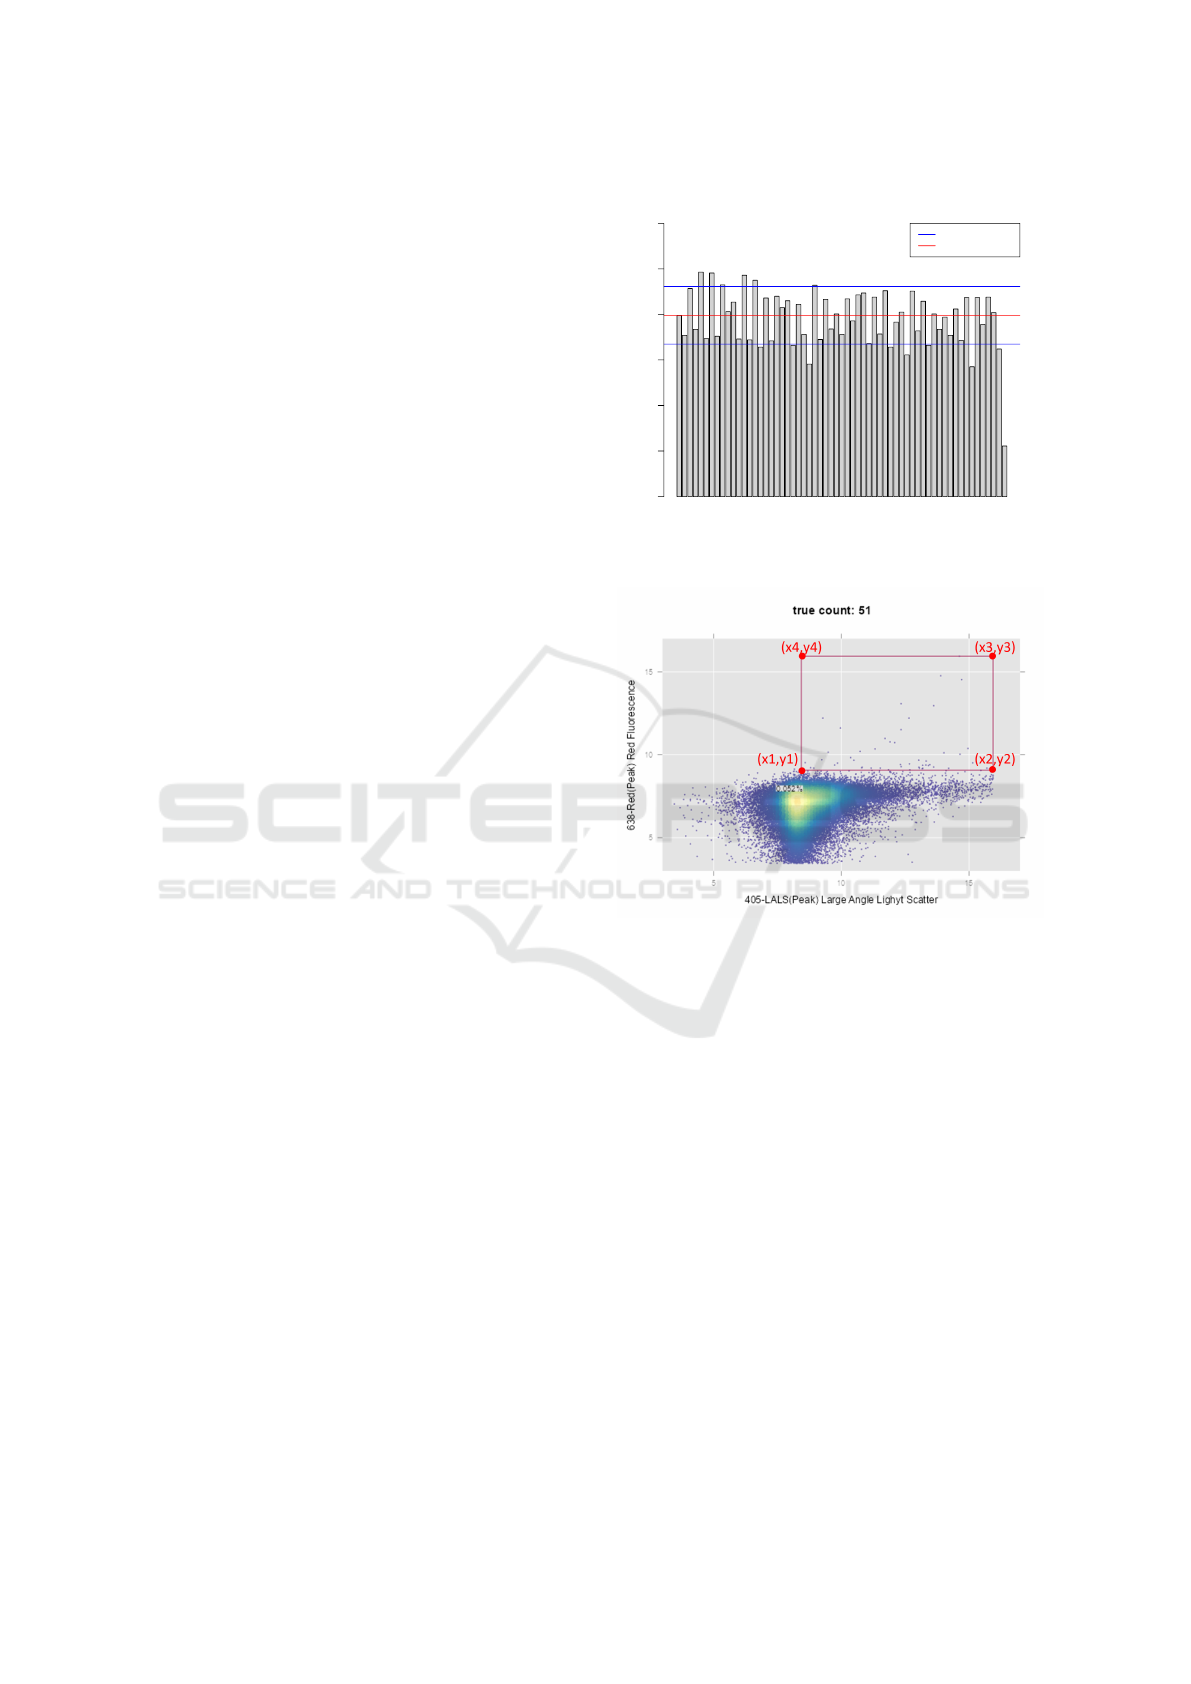
Figure 2: Total events captured per second.
Figure 3: Rectangular gate for identification of sub-
population of events.
and are characterized by linear relationship between
these channel readings.
One of the major limitations in the reproducibility
of EV studies is the manual gating of EVs . The gat-
ing process involves manual creation of boundaries
on the scatter plot using tools such as FlowJo to count
the events inside the boundaries. This manual step
is error-prone and can vary for different individuals
who gate these events. In order to overcome these
challenges, two automated gating strategies have been
developed to enumerate the positive EVs. The au-
tomated gating mechanisms involve identifying the
starting position for gate and finding the rest of gating
coordinates. In the first strategy, we describe a rect-
angular gating scheme based on minimum size of the
particle and its fluorescence. Since bigger EVs will
have greater surface area to accommodate binding of
more number of surface markers, the dye-specific flu-
orescence signal is expected to be higher. Hence, we
describe five-sided gating based on size exclusion cri-
BIOSIGNALS 2025 - 18th International Conference on Bio-inspired Systems and Signal Processing
1022
teria of EVs and linear scaling of fluorescence with
the size. We then compare the results of the auto-
mated gating to that of manual gating by two inde-
pendent reviewers.
Algorithm 1: Algorithm for rectangular automatic gating of
EVs. The points x[1-4] and y[1-4] refers to the points of
gates as shown in Figure 3.
Data: X1:= lower limit of the EV size,
inputMatrix is matrix of measurements
with ‘n’ events as rows and ‘m’
columns as channels
Result: (x1,y1,x2,y2,x3,y3,x4,y4)
1 trans f ormed := arcsinh(inputMatrix);
2 X := trans f ormed[1 : n,‘LALS
′
];
3 Y := trans f ormed[1 : n,‘RedChannel
′
];
4 x1 := arcsinh(X1);
5 densityY := density(Y );
6 poi := pointO f In f lection(densityY );
7 y1 := abscissa(poi) +
distance(peak(densityY ), poi);
8 x2 := max(X);
9 y2 := y1;
10 x3 := max(X);
11 y3 := max(Y );
12 x4 := x1;
13 y4 := max(Y );
14 return
(polygonGate(x1,y1,x2,y2, x3,y3,x4,y4));
2.4.1 Rectangular Gating
The gating involves plotting the EV particle size on
X-axis and fluorescence channel measurement on Y-
axis. A side scatter triggering threshold set at 2,300
arbitrary units (a.u.) on X-axis will be set as x1. This
marks the minimum size of the EVs. For identify-
ing the first point on Y-axis (y1), peak density of the
fluorescence values is identified and point of inflec-
tion in the downward slope of the density plot after
the peak is determined. The value of y1 is set to the
sum of abscissa of point of inflection and distance be-
tween point of inflection and peak. This ensures that
the background noise region in fluorescence axis is
avoided to begin the gating (see Figure 3). This is
a critical step in capturing the signal. Hence, it is
described independently as rectangular gating and all
the steps in this approach are listed in Algorithm 1.
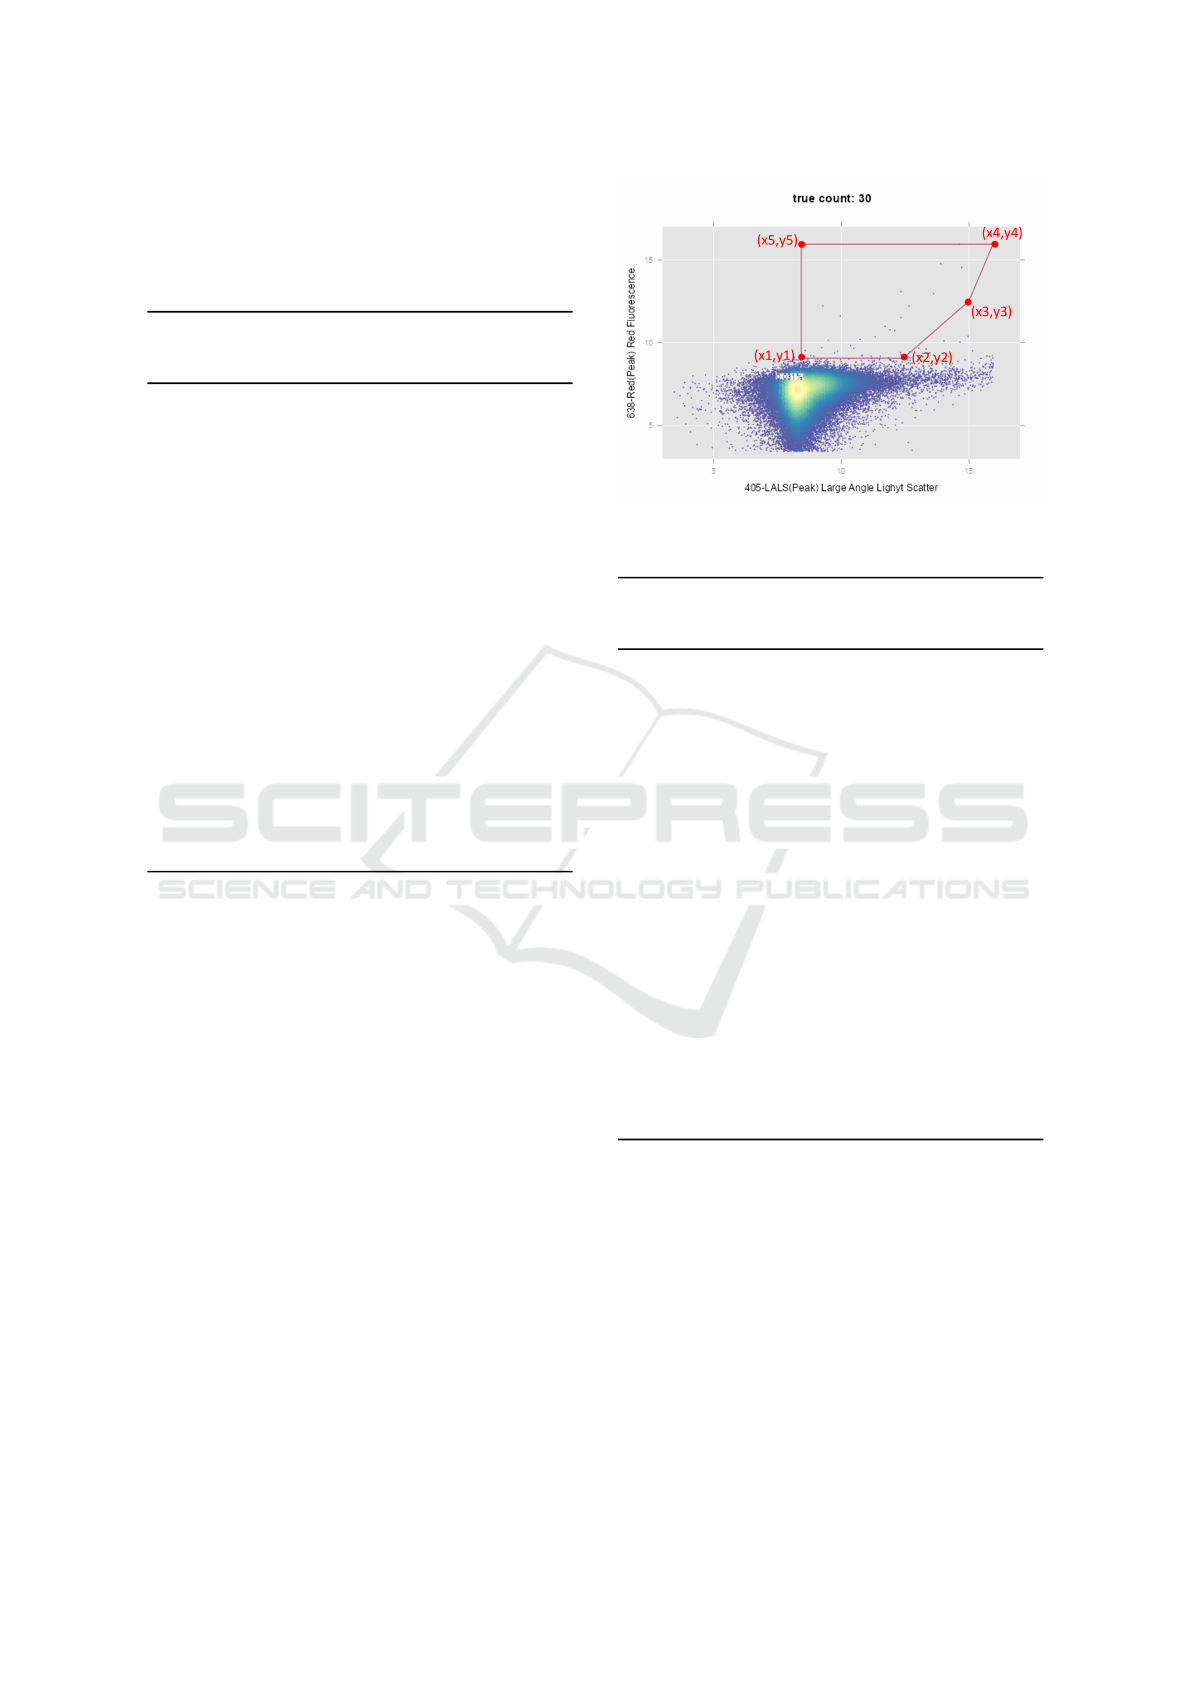
2.4.2 Five-Sided Gating
The rectangular gating has few shortcomings. Among
the larger EVs, those that do not exhibit elevated flu-
orescence may be misclassified as true positives be-
Figure 4: Five-sided gate for identification of sub-
population of events.
Algorithm 2: Algorithm for five-sided automatic gating of
EVs. The points x[1-5] and y[1-5] refers to the points of
gates as shown in Figure 4.
Data: X1:= lower limit of the EV size, X2 :=
higher limit of the EV size, inputMatrix is
matrix of measurements with ‘n’ events as
rows and ‘m’ columns as channels
Result: (x1,y1,x2,y2,x3,y3,x4,y4,x5,y5)
1 trans f ormed := arcsinh(inputMatrix);
2 X := trans f ormed[1 : n,‘LALS
′
];
3 Y := trans f ormed[1 : n,‘RedChannel
′
];
4 x1 := arcsinh(X1);
5 densityY := density(Y );
6 poi := pointO f In f lection(densityY );
7 y1 := abscissa(poi) +
distance(peak(densityY ), poi);
8 x2 := arcsinh(X2);
9 y2 := y1;
10 x4 := max(X);
11 y4 := max(Y);
12 x3 := ⌊x4⌋;
13 y3 := y2 +(y4 −y2)/2;
14 x5 := x1;
15 y5 := y4;
16 return
(polygonGate(x1, y1, x2, y2,x3,y3,x4,y4,x5,y5));
cause larger EVs typically have increased fluores-
cence due to their size. Incorporating this information
as a criteria to filter noise is critical in accurately iden-
tifying positive EVs. Based on the input from hrFC
experts in the team, rectangular gating is fine-tuned to
add a threshold of maximum size of EV. Algorithm 1
is updated to limit the size of EV to a specified value
(123,000 a.u.). In addition, one more polygon point
is added in between the minimum and maximum flu-
orescence. This point (x3, y3) as shown in Figure
4 will aid in filtering the points whose fluorescence
doesn’t scale linearly with EV size.
Reproducible Gating for High-Resolution Flow Cytometric Characterization of Extracellular Vesicles in Next-Generation Biomarker Studies
1023
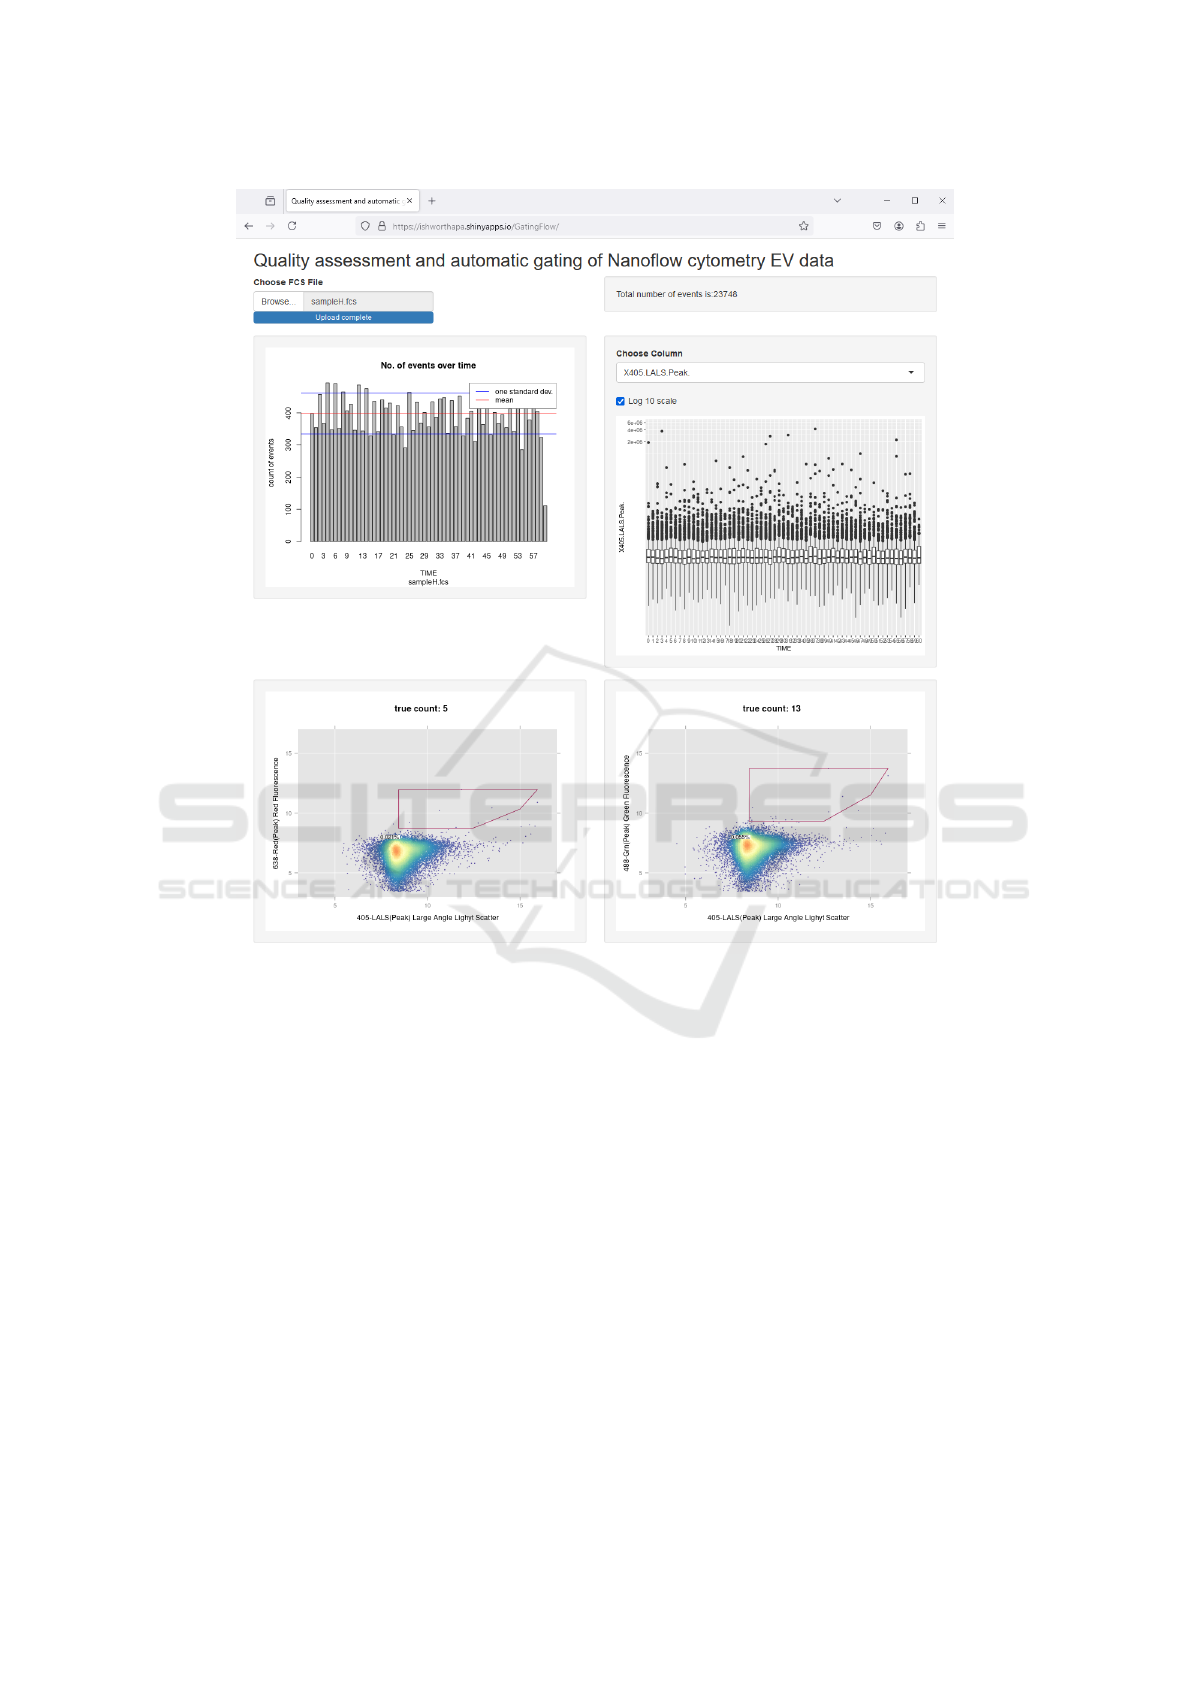
Figure 5: A snapshot of the Shiny web application.
Mathematical formulation of five-sided gating is
listed in an algorithm (see Algorithm 2). A R pro-
gram is written to implement this refined gating algo-
rithm in order to count the positive events within these
gates. The filter() function from flowCore R pack-
age is utilized for enumerating the sub-population of
events in the gate (Hahne et al., 2009). Additionally,
the flowViz R package that is compatible with data
structures defined in the flowCore package is utilized
for plotting the figures with the gates (Sarkar et al.,
2008).
2.5 Shiny R App for Automated Gating
An open-source R package called, Shiny is utilized
to create a web application for the quality assess-
ment and automated gating. The automated gating
in this app utilizes the five-sided gating strategy de-
scribed in Algorithm 2. The Shiny app is available
at the following URL: https://ishworthapa.shinyapps.
io/gatingflow/. In this web application, users can up-
load a FCS file for which the quality check and the
automated gating procedure will be carried out. A
snapshot of the user-interface is shown in Figure 5.
3 RESULTS
Next, we apply the quality checking step and auto-
mated gating algorithm on a real dataset from patient
samples using the Shiny app. The quality check fea-
ture provides a quick and effective way to identify
samples that are erroneous. Additionally, automated
gating algorithm performs sample specific gating that
accurately identifies the sub-population of events.
BIOSIGNALS 2025 - 18th International Conference on Bio-inspired Systems and Signal Processing
1024
3.1 Quality Check Identifies Run with
Erroneous Data
By plotting the values from different channels and
TIME variable, the web application provided easy
mechanism to identify samples with errors. For an
instance, samples that saved time information incor-
rectly were easily captured (see Figure 6). In this sam-
ple, the timeline represented by X-axis is incorrect
and should span from 0 to 60. In sample(s) that passed
the quality checking step, like the one shown in Fig-
ure 2, the plots provided assurance that the acquisi-
tion process remained consistent and did not show any
signs of deterioration over the observed time period.
Figure 6: An example sample with erroneous data in the
‘TIME’ column of the FCS file.
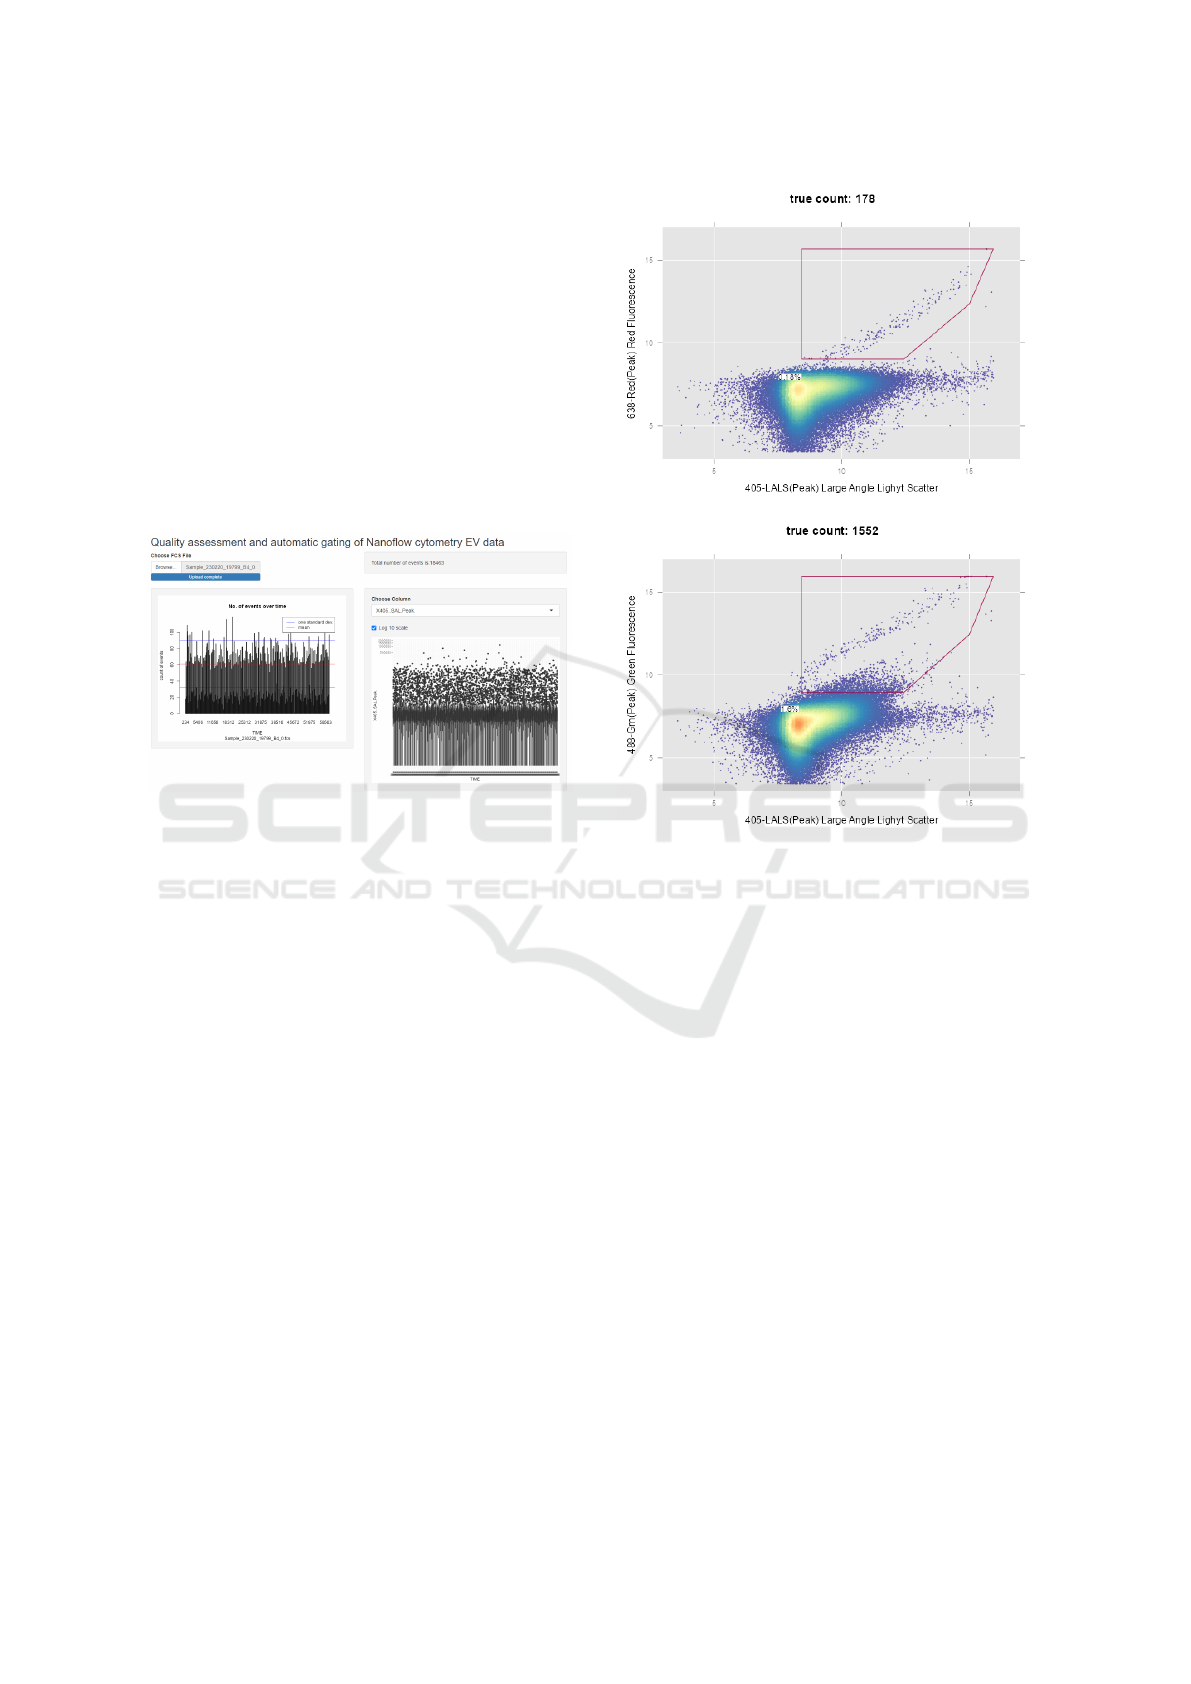
3.2 Automated Gating
Antibody labeling was performed with two markers
in the urine samples of cancer patients. A total of
90 FCS files (30 samples with 3 replicates each) were
analyzed using the automated gating algorithm within
the Shiny application. Between different marker pro-
teins, the five-sided automated gating shows appro-
priate selection of boundary between the noise and
the signal (see Figure 7). Additionally, to standard-
ize the counts from different experiments, the number
of positive events identified in automated gating was
translated into a scaled number with appropriate dilu-
tion factor obtained from wet-lab protocol.
3.3 Comparison of Automated and
Manual Gating Results
The final enumeration of positive EVs were then com-
pared between both automated gating strategies (rect-
angular and five-sided) and manual gating performed
by two independent reviewers. The comparison of
the standardized number of events (in log10 scale)
from both methods are shown in Figure 8. For PSMA
Figure 7: Automated (five-sided) gating results for two dif-
ferent markers showing accurate predictions of the gating
boundaries.
marker positive EVs, the counts from automated gat-
ing are slightly less than those obtained from man-
ual gating process. For STEAP1 marker positive EVs,
the counts from the automated and manual gating re-
sults fluctuate between samples as shown in Figure 8.
For both markers, the five-sided automated gating re-
sulted in less positive events than the rectangular gat-
ing by avoiding the points on the far right side of the
rectangular gating. Overall, the results show that the
automated gating is comparable to the manual gating,
especially for PSMA marker positive EVs.
Next, we investigated the correlation between the
gating results. As shown in Table 1, the Spearman’s
rank correlation value between manual gating from
two independent reviewers was 0.90 and 0.59 for
PSMA and STEAP1 markers, respectively. Interest-
ingly, correlation between manual gating from second
user and the automated gating approaches for PSMA
marker was the highest (ρ = 0.87). The correlation
values for STEAP1 marker are less than that for PSMA
marker.
In addition, intraclass correlation coefficient
Reproducible Gating for High-Resolution Flow Cytometric Characterization of Extracellular Vesicles in Next-Generation Biomarker Studies
1025
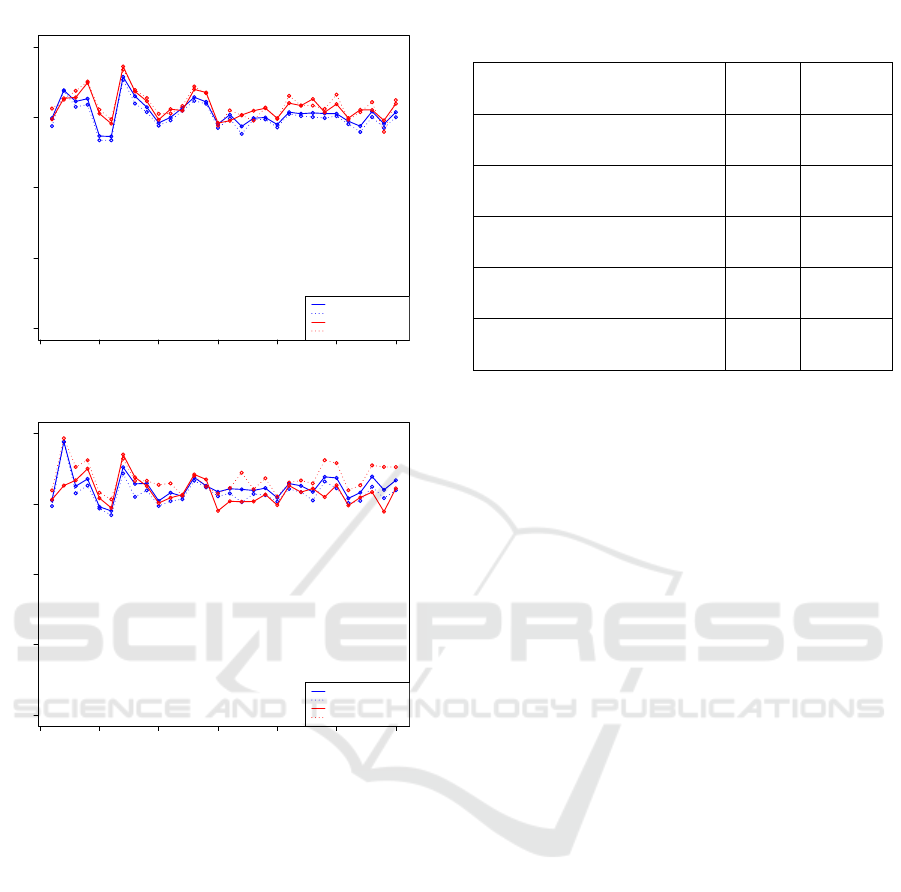
0 5 10 15 20 25 30
0 2 4 6 8
PSMA marker
samples
log10(standardized count)
Rectangular−Automated
Five−Sided−Automated
Manual 1
Manual 2
0 5 10 15 20 25 30
0 2 4 6 8
STEAP1 marker
samples
log10(standardized count)
Rectangular−Automated
Five−Sided−Automated
Manual 1
Manual 2
Figure 8: Manual versus automated gating results for PSMA
and STEAP1 markers (in log10 scale).
(ICC) was computed to measure index of inter-rater
reliability of quantitative data using ‘irr’ R package.
When comparing automated gating results with the
manual gating results from first reviewer, the intra-
class correlation value for PSMA and STEAP1 mark-
ers were observed to be 0.73 and 0.51, respectively.
Similarly, when comparing automated gating results
with the manual gating results from second reviewer,
ICC for PSMA and STEAP1 markers were 0.751 and
0.9, respectively. Together, these results show that the
automated gating enumeration is comparable to that
of manual gating performed by experienced person-
nel.
Table 1: Spearman’s rank correlation between gating results
for each marker(P − value < 0.01).
Correlation comparison
groups
PSMA STEAP1
Manual Reviewer1-vs-
Manual Reviewer2
0.90 0.59
Automated: Rectangular-vs-
Manual Reviewer1
0.85 0.74
Automated: Rectangular-vs-
Manual Reviewer2
0.87 0.85
Automated: Five-sided-vs-
Manual Reviewer1
0.86 0.73
Automated: Five-sided-vs-
Manual Reviewer2
0.87 0.73
4 CONCLUSIONS
This study proposed a novel computational platform
for processing of high-resolution Flow Cytometry
(hrFC) data from EV studies. We provide an auto-
mated method for checking the quality of cytome-
try data and algorithms to perform quantification of
positive events in hrFC. In addition, we developed
a web application that performs the quality check-
ing step and automatically identifies the gate for sub-
population of EVs that were otherwise enumerated by
creating the boundaries manually. We showed that
the manual gating step can vary between the individ-
uals who perform the gating and is time consuming
and not reproducible. However, our proposed algo-
rithm is robust, deterministic, and always produces
consistent gating highlighting the reproducible fea-
ture of our method. Currently, our web application
is at the prototype stage to highlight the relevance of
our pipeline and is compatible with data generated by
Apogee A60-Micro Plus flow cytometer. Additional
validation studies with larger number of samples are
required to ensure the reliability and accuracy of our
results, involving a larger pool of human reviewers
for manual gating. In the future, we plan to enhance
the app to allow multiple FCS files and accommodate
other instruments. A study like ours is critical to fa-
cilitate EV-based biomarker studies for the develop-
ment of innovative, next-generation molecular diag-
nostics in cancer. Accurate quantification and char-
acterization of EVs in modern oncology will play a
pivotal role in identifying prognostic, diagnostic and
predictive markers in everyday medical practice. Be-
fore reaching the clinic, limitations such as imprecise
EV clustering and traditional manual gating need to
be replaced.
BIOSIGNALS 2025 - 18th International Conference on Bio-inspired Systems and Signal Processing
1026

ACKNOWLEDGEMENTS
The authors would like to acknowledge Daniel Quest,
PhD from Mayo Clinic in constructive feedback dur-
ing our meetings.
REFERENCES
Aharon, A., Spector, P., Ahmad, R. S., Horrany, N., Sab-
bach, A., Brenner, B., and Aharon-Peretz, J. (2020).
Extracellular vesicles of alzheimer’s disease patients
as a biomarker for disease progression. Molecular
neurobiology, 57:4156–4169.
Arce, J. E., Welsh, J. A., Cook, S., Tigges, J., Ghiran, I.,
Jones, J. C., Jackson, A., Roth, M., and Milosavljevic,
A. (2023). The nanoflow repository. Bioinformatics,
39(6):btad368.
Ellison, T. J., Stice, S. L., and Yao, Y. (2023). Therapeu-
tic and diagnostic potential of extracellular vesicles in
amyotrophic lateral sclerosis. Extracellular Vesicle,
2:100019.
Hahne, F., LeMeur, N., Brinkman, R. R., Ellis, B., Haa-
land, P., Sarkar, D., Spidlen, J., Strain, E., and Gentle-
man, R. (2009). flowcore: a bioconductor package for
high throughput flow cytometry. BMC bioinformatics,
10(1):1–8.
Kim, Y., Van Der Pol, E., Arafa, A., Thapa, I., Britton, C. J.,
Kosti, J., Song, S., Joshi, V. B., Erickson, R. M., Ali,
H., et al. (2022). Calibration and standardization of
extracellular vesicle measurements by flow cytometry
for translational prostate cancer research. Nanoscale,
14(27):9781–9795.
Lucien, F., Kim, Y., Qian, J., Orme, J. J., Zhang, H., Arafa,
A., Abraha, F., Thapa, I., Tryggestad, E. J., Harm-
sen, W. S., et al. (2022). Tumor-derived extracellular
vesicles predict clinical outcomes in oligometastatic
prostate cancer and suppress antitumor immunity. In-
ternational Journal of Radiation Oncology* Biology*
Physics, 114(4):725–737.
Newman, L. A., Muller, K., and Rowland, A. (2022). Circu-
lating cell-specific extracellular vesicles as biomark-
ers for the diagnosis and monitoring of chronic liver
diseases. Cellular and Molecular Life Sciences,
79(5):232.
Ohmichi, T., Mitsuhashi, M., Tatebe, H., Kasai, T., El-
Agnaf, O. M. A., and Tokuda, T. (2019). Quantifica-
tion of brain-derived extracellular vesicles in plasma
as a biomarker to diagnose parkinson’s and related
diseases. Parkinsonism & related disorders, 61:82–
87.
Pan, Y., Lu, X., Shu, G., Cen, J., Lu, J., Zhou, M., Huang,
K., Dong, J., Li, J., Lin, H., et al. (2023). Extracellular
vesicle-mediated transfer of lncrna igfl2-as1 confers
sunitinib resistance in renal cell carcinoma. Cancer
Research, 83(1):103–116.
Salmond, N., Khanna, K., Owen, G. R., and Williams, K. C.
(2021). Nanoscale flow cytometry for immunopheno-
typing and quantitating extracellular vesicles in blood
plasma. Nanoscale, 13(3):2012–2025.
Samuel, P., Mulcahy, L. A., Furlong, F., McCarthy, H. O.,
Brooks, S. A., Fabbri, M., Pink, R. C., and Carter,
D. R. F. (2018). Cisplatin induces the release of ex-
tracellular vesicles from ovarian cancer cells that can
induce invasiveness and drug resistance in bystander
cells. Philosophical Transactions of the Royal Society
B: Biological Sciences, 373(1737):20170065.
Sarkar, D., Le Meur, N., and Gentleman, R. (2008). Using
flowviz to visualize flow cytometry data. Bioinformat-
ics, 24(6):878–879.
Spidlen, J., Moore, W., Parks, D., Goldberg, M., Blenman,
K., Cavenaugh, J. S., Force, I. D. S. T., and Brinkman,
R. (2021). Data file standard for flow cytometry, ver-
sion fcs 3.2. Cytometry Part A, 99(1):100–102.
Spidlen, J., Moore, W., Parks, D., Goldberg, M., Bray,
C., Bierre, P., Gorombey, P., Hyun, B., Hubbard, M.,
Lange, S., et al. (2010). Data file standard for flow cy-
tometry, version fcs 3.1. Cytometry Part A: The Jour-
nal of the International Society for Advancement of
Cytometry, 77(1):97–100.
Th
´
ery, C., Witwer, K. W., Aikawa, E., Alcaraz, M. J., An-
derson, J. D., Andriantsitohaina, R., Antoniou, A.,
Arab, T., Archer, F., Atkin-Smith, G. K., et al. (2018).
Minimal information for studies of extracellular vesi-
cles 2018 (misev2018): a position statement of the in-
ternational society for extracellular vesicles and up-
date of the misev2014 guidelines. Journal of extracel-
lular vesicles, 7(1):1535750.
van der Pol, E., Sturk, A., van Leeuwen, T., Nieuwland, R.,
Coumans, F., Mobarrez, F., Arkesteijn, G., Wauben,
M., Siljander, P.-M., S
´
anchez-L
´
opez, V., et al. (2018).
Standardization of extracellular vesicle measurements
by flow cytometry through vesicle diameter approx-
imation. Journal of thrombosis and haemostasis,
16(6):1236–1245.
Welsh, J. A., Horak, P., Wilkinson, J. S., Ford, V. J., Jones,
J. C., Smith, D., Holloway, J. A., and Englyst, N. A.
(2020a). Fcmpass software aids extracellular vesi-
cle light scatter standardization. Cytometry Part A,
97(6):569–581.
Welsh, J. A., Van Der Pol, E., Arkesteijn, G. J., Bremer, M.,
Brisson, A., Coumans, F., Dignat-George, F., Duggan,
E., Ghiran, I., Giebel, B., et al. (2020b). Miflowcyt-
ev: A framework for standardized reporting of extra-
cellular vesicle flow cytometry experiments. Journal
of extracellular vesicles, 9(1):1713526.
Reproducible Gating for High-Resolution Flow Cytometric Characterization of Extracellular Vesicles in Next-Generation Biomarker Studies
1027
