
Early Diagnosis of Parkinson’s Disease via Pro-Saccadic
Eye Movement Analysis: Multimodal Intermediate Fusion Framework
Ji-Yun Han
1,3 a
, Dae-Yong Cho
1,3 b
Dallah Yoo
2 c
, Tae-Beom Ahn
2,3 d
and Min-Koo Kang
1,3 e
1
Intelligence and Interaction Research Center, Korea Institute of Science and Technology (KIST), Seoul 02792,
Republic of Korea
2
Department of Neurology, Kyung Hee University Hospital, Kyung Hee University College of Medicine, Seoul,
Republic of Korea
3
KHU-KIST, Department of Converging Science and Technology, Kyung Hee University, Seoul 02447, Republic of Korea
Keywords:
Parkinson’s Disease, Eye-Tracking, Automated Diagnosis, Early Diagnosis, Deep Learning.
Abstract:
Early detection and timely treatment are essential for improving patient outcomes, but the lack of reliable
biomarkers impedes early diagnosis of Parkinson’s Disease (PD). Consequently, eye movement abnormalities,
known as early symptoms of PD, are gaining attention as crucial clues for early diagnosis. This study proposes
a novel multimodal intermediate fusion framework for the early diagnosis of PD using eye-tracking data.
The proposed framework improves the performance of classifying abnormal eye movement patterns in PD by
integrating local features from time-series data and global features from encoded time-series images. Focusing
on pro-saccade eye movements, this framework captures significant abnormalities like reduced peak saccadic
velocity and multi-step saccades frequently observed in PD. The experimental results show a precision of 82%
and a recall of 96% for PD, which demonstrates the effectiveness of the framework in minimizing missed
diagnoses during early detection. In addition, this study highlights the potential of eye-tracking data as a
biomarker for the early diagnosis of PD and predicts the advanced application of integrating wearable smart
glasses for daily monitoring of neurodegenerative diseases.
1 INTRODUCTION
Parkinson’s disease (PD) is a progressive neurode-
generative disorder characterized by motor and non-
motor symptoms. Early detection and timely treat-
ment are essential to improve patients quality of life,
as they can reduce symptoms, delay the need for L-
dopa therapy, and slow disease progression (Tinelli
et al., 2016). Despite these benefits, the current lack
of reliable biomarkers with high sensitivity and speci-
ficity in the early stages poses a challenge to the diag-
nosis of PD (Tolosa et al., 2021). Consequently, many
patients are diagnosed after motor symptoms and neu-
rophysiological damage become evident, which leads
to the loss of the opportunity for early treatment.
To overcome these challenges, eye-tracking tech-
nology is gaining attention as an alternative for early
a
https://orcid.org/0000-0009-8944-3409
b
https://orcid.org/0000-0002-6685-5306
c
https://orcid.org/0000-0002-9736-6118
d
https://orcid.org/0000-0002-7315-6298
e
https://orcid.org/0000-0003-1109-4818
diagnosis of PD (S¸tef
˘
anescu et al., 2024). This tech-
nology has the potential to detect abnormal eye move-
ment before motor symptoms and provides critical
clues for the early detection. (Turcano et al., 2019).
Moreover, as a non-invasive method without discom-
fort for patients, it shows significant potential as a
biomarker for long-term and cost-effective monitor-
ing of the progression of PD.
As a result, previous studies have focused on clas-
sifying PD from HC through analysis of eye move-
ments using machine learning techniques. They ex-
tract features such as saccade amplitude, reaction
time, and error rates from eye-tracking data collected
during specific visual tasks. However, feature ex-
traction reduces time-series data to summary values,
which limits the ability to capture complex temporal
patterns that are critical to understanding abnormali-
ties related to PD (Yang et al., 2024).
This study proposes a novel multimodal interme-
diate framework for classifying PD and HC by auto-
matically detecting eye movement patterns and cre-
ating features such as speed, acceleration, and eye
Han, J.-Y., Cho, D.-Y., Yoo, D., Ahn, T.-B. and Kang, M.-K.
Early Diagnosis of Parkinson’s Disease via Pro-Saccadic Eye Movement Analysis: Multimodal Intermediate Fusion Framework.
DOI: 10.5220/0013321700003911
Paper published under CC license (CC BY-NC-ND 4.0)
In Proceedings of the 18th International Joint Conference on Biomedical Engineering Systems and Technologies (BIOSTEC 2025) - Volume 2: HEALTHINF, pages 261-272
ISBN: 978-989-758-731-3; ISSN: 2184-4305
Proceedings Copyright © 2025 by SCITEPRESS – Science and Technology Publications, Lda.
261
movement states. This enables the framework to
identify critical features, such as decreased peak sac-
cadic velocities and multi-step saccades (White et al.,
1983), but are difficult to detect with positional data
alone. Subsequently, it improves performance by us-
ing a multimodal intermediate fusion network that in-
tegrates Convolutional Neural Networks (CNN) and
Transformer Networks.
This paper is structured as follows. Section 2 re-
views the literature on PD-related eye movement ab-
normalities and diagnostic methods. Section 3 pro-
vides the materials and methods, while Section 4
describes data acquisition, feature engineering, and
the proposed deep learning architectures. Section 5
presents the results, and Section 6 discusses implica-
tions, limitations, and future research. Finally, Sec-
tion 7 concludes the paper.
2 BACKGROUND
2.1 Eye Movement Abnormalities in PD
Excessive inhibition of the basal ganglia (BG) and
the superior culculus (SC) caused by dopamine defi-
ciency leads to abnormalities in eye movements asso-
ciated with PD (Pretegiani and Optican, 2017). These
abnormalities vary according to the specific type of
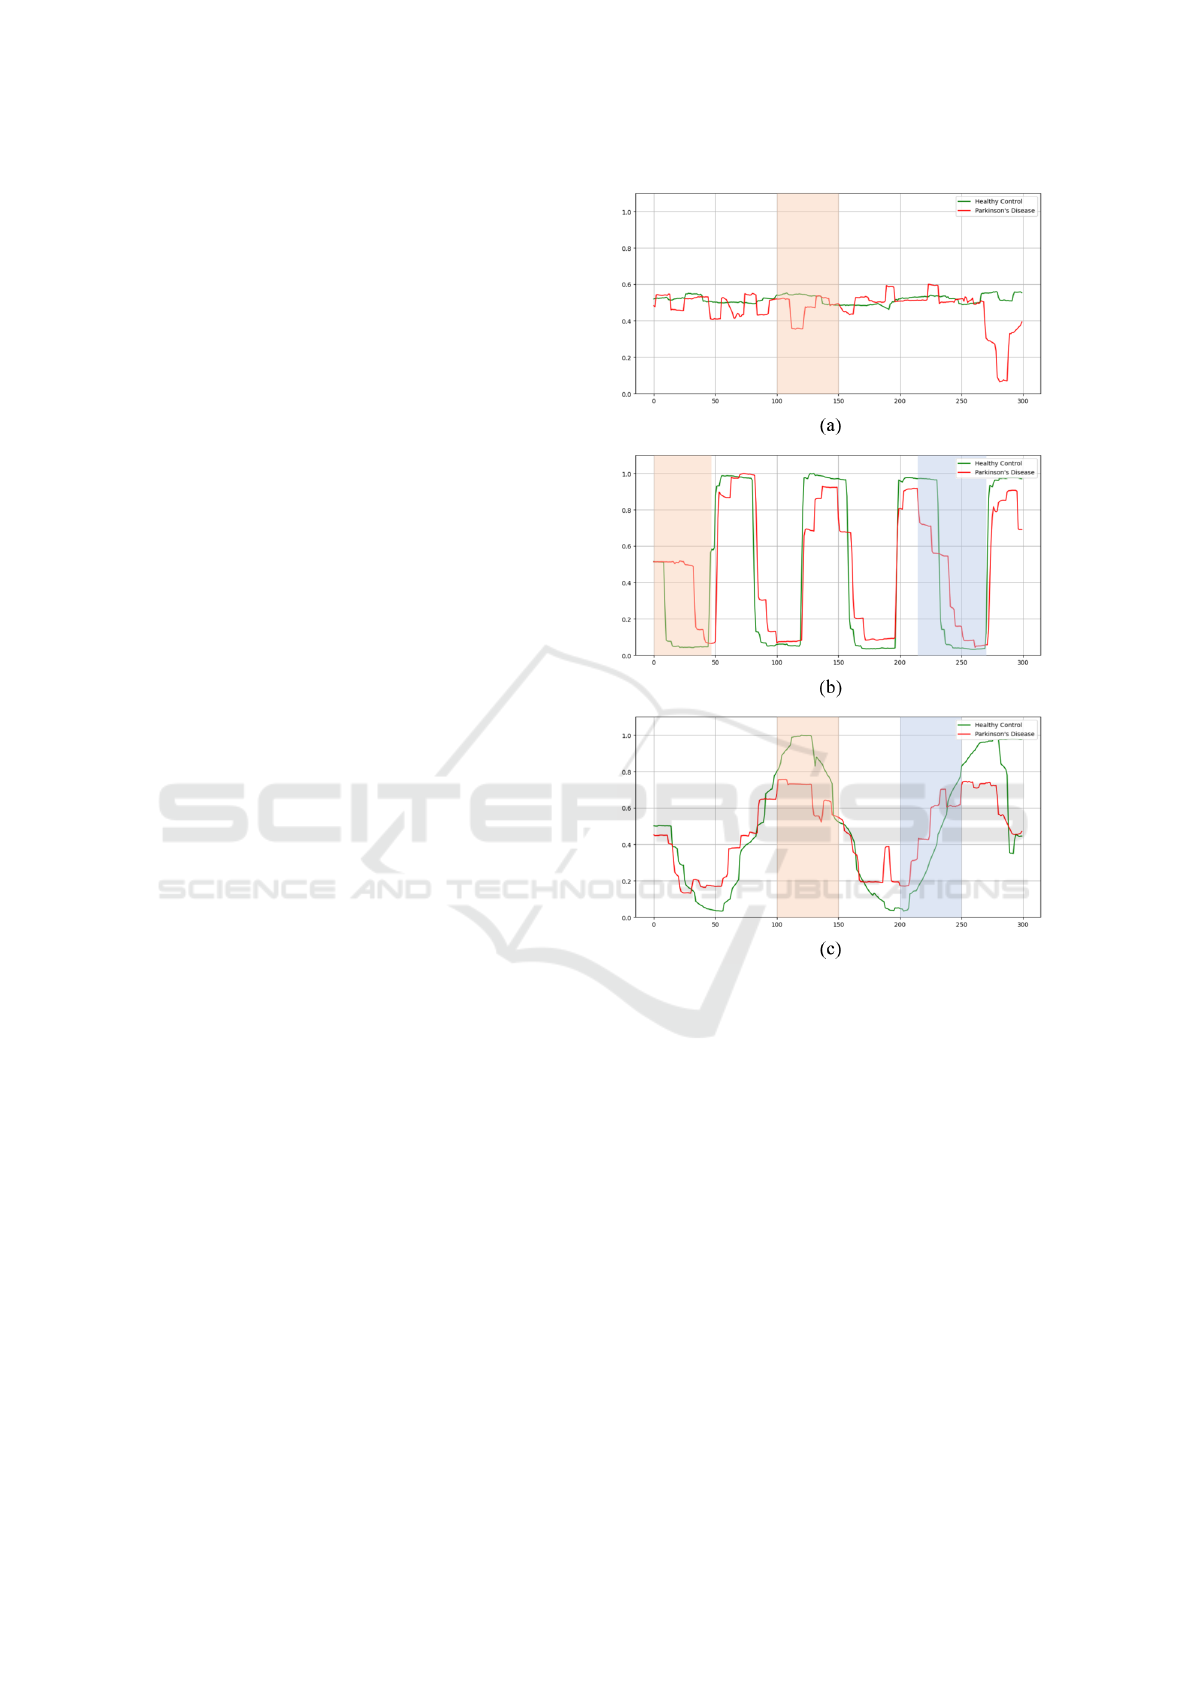
eye movement. Figure 1 illustrates the representative
abnormalities in eye movement in PD, including fixa-
tion, saccades, and smooth pursuit.
• Fixation: Patients with PD often experience chal-
lenges in maintaining a steady gaze, which leads
to instability or drift. Square Wave Jerks (SWJ),
small involuntary eye movements with deviations
of 0.5 to 5 ° from the fixation point, are particu-
larly common. These movements are character-
ized by a rapid return to the original target (Lal
and Truong, 2019). Figure 1(a) compares fixa-
tion in PD with HC, highlighting the characteristic
SWJ in the red area for PD.
• Saccade: Saccadic eye movements of patients
with PD become slower and less accurate, making
it difficult to quickly refocus the gaze. Reduced
peak velocity and prolonged latencies are com-
mon (Rascol et al., 1989). In addition, PD patients
also frequently exhibit multiple-step saccades,
characterized by small-amplitude sequences. Fig-
ure 1(b) compares saccades in PD and HC, high-
lighting prolonged latencies in red and multiple-
step saccades in blue.
• Smooth pursuit: Patients with PD experience vi-
sual attention deficits caused by saccadic intru-
Figure 1: Comparison of eye movements between HC
(green line) and PD (red line): (a) fixation, (b) saccade, and
(c) smooth pursuit. Abnormal eye movements in PD are
highlighted in red and blue areas.
sions during target fixation, which makes tracking
moving objects challenging (Frei, 2020). In ad-
dition, they experience hypometria, in which the
eyes fail to reach the target, leading to premature
stops and affecting the smoothness and accuracy
of eye movements. Figure 1(c) compares smooth
pursuit in PD with HC, highlighting hypometria
in red and saccadic intrusions in blue.
2.2 Related Works
Abnormal eye movements have potential as early
biomarkers for diagnosing PD even before the onset
of motor symptoms (Haslwanter and Clarke, 2010).
These abnormalities include characteristics such as
HEALTHINF 2025 - 18th International Conference on Health Informatics
262

reduced peak saccadic velocity and multiple-step sac-
cades (Ma et al., 2022). As a result, the potential of
abnormal eye movements as biomarkers for the diag-
nosis of PD has driven advancements, such as VOG
(Video-oculography), further expanding its applica-
tions in both clinical and research settings.
VOG is a widely used eye-tracking technology
in clinical settings to analyze abnormalities in eye
movements. Using high-speed cameras and data pro-
cessing software, it non-invasively examines char-
acteristic eye movement abnormalities and is ap-
plied to diagnose neurological diseases such as PD,
Alzheimer’s disease, and progressive supranuclear
palsy (Haslwanter and Clarke, 2010). By recording
and analyzing eye movement waveforms in real time,
clinicians and researchers receive precise information
on patient symptoms.
Recent studies have applied machine learning
techniques to classify PD and HC using eye-tracking
data obtained from systems like VOG. For exam-
ple, Brien et al. (Brien et al., 2023) trained a vot-
ing classifier that combined SVM, logistic regres-
sion, and random forests using both point estimates,
such as mean amplitudes, and functional estimates,
such as blink probabilities. de Villers-Sidani et al.
(de Villers-Sidani et al., 2023) identified key eye
movement metrics, including accuracy, velocity, and
latency from tasks involving fixation, pro-saccades,
and anti-saccades. Jiang et al. (Jiang et al., 2024) ex-
plored eye movements through a virtual reality-based
game, extracting latency and velocity characteristics
and using models such as k-NN, SVM and random
forests for classification. Zhang et al. (Zhang et al.,
2021) analyzed oculomotor parameters such as SWJ
frequency, vertical saccade latency, and smooth pur-
suit gain using VOG data to classify between PD and
HC. Przybyszewski et al. (Przybyszewski et al., 2023)
applied various machine learning algorithms, includ-
ing granular computing, naive bayes, decision trees,
and random forests, to classify the progression of PD
using eye movement parameters. Koch et al. (Koch
et al., 2024) utilized a tablet-based eye-tracking tool
to extract oculomotor parameters and used machine
learning techniques to assess cognitive abilities and
classify stages of disease in PD. The characteristics
and performance of the studies mentioned above are
summarized and compared in Table 4.
2.3 Challenges and Insight
Although machine learning-based approaches show
significant diagnostic potential, critical limitations re-
main. Current models primarily rely on feature ex-
traction, which risks losing crucial information and
fails to fully capture the complex eye movement pat-
terns. (Fawaz et al., 2019) Eye-tracking data are
inherently sequential, with complex interactions be-
tween time points being essential. However, existing
models often fail to capture these interactions effec-
tively, which leads to reduced diagnostic accuracy.
To overcome these challenges, this study proposes
a novel deep learning framework to classify PD and
HC using eye-tracking data. It fuse the features from
the CNN and Transformer to effectively capture both
global context and local details simultaneously. En-
coding time-series as images provides a comprehen-
sive view of eye movement patterns, which reduces
information loss. The proposed framework efficiently
leverages raw time-series data to detect subtle abnor-
malities, which enhances the potential for early diag-
nosis of PD and maximizes the effectiveness of early
treatment and intervention strategies.
3 MATERIALS
3.1 Participants
Table 1: Demographic details of participants. Continuous
variables: t-test; categorical variables: chi-square test.
Characteristic Parkinson’s Disease Control P-value
Age 66.2 ± 8.8 68.7 ± 8.1 0.051
Sex (Male : Female) 28 : 56 33 : 66 1.000
This study followed the tenets of the Declaration
of Helsinki and was approved by the Institutional
Review Board of Kyung Hee University Hospital
(KHUH 2021-04-032). In this retrospective study,
we enrolled drug-naive patients with PD who vis-
ited the outpatient clinic at the Department of Neu-
rology, Kyung Hee University Hospital, between Jan-
uary 1, 2012, and April 5, 2021. Patients were diag-
nosed with PD based on the UK Parkinson’s Disease
Society Brain Bank diagnostic criteria, confirmed
through expert examination (DY and TA). To be in-
cluded in the study, patients should have undergone
a VOG examination and demonstrated significant
terminal dopaminergic loss identified by dopamine
transporter imaging, or N-3-[18F]fluoropropyl-2β-
carbomethoxy-3β-4-iodophenyl nortropane positron
emission tomography. Patients were excluded if
they had a history of severe neurological or psy-
chiatric conditions requiring regular treatment, such
as dementia, stroke, traumatic brain injury, brain
tumor, history of brain surgery, or major depres-
sive disorder. Additionally, patients with neuro-
ophthalmologic or neuro-otologic comorbidities that
Early Diagnosis of Parkinson’s Disease via Pro-Saccadic Eye Movement Analysis: Multimodal Intermediate Fusion Framework
263
could influence VOG examination results, or those
with distinct structural lesions on brain magnetic res-
onance imaging or computed tomography that could
account for neurological symptoms were excluded.
The control group comprised patients who pre-
sented headache or dizziness and underwent VOG
tests. The controls were matched by sex and age to the
patient group and subject to the same exclusion crite-
ria. In total, the study included 183 participants: 84
with PD and 99 controls. Although there were no sig-
nificant differences in the sex distribution between the
groups (p=1.000), the mean age of the PD group was
66.2 years (standard deviation (SD)=8.8), compared
to 68.7 years (SD=8.1) in the control group. The age
difference was not statistically significant (p=0.051).
Table 1 shows the demographic details.
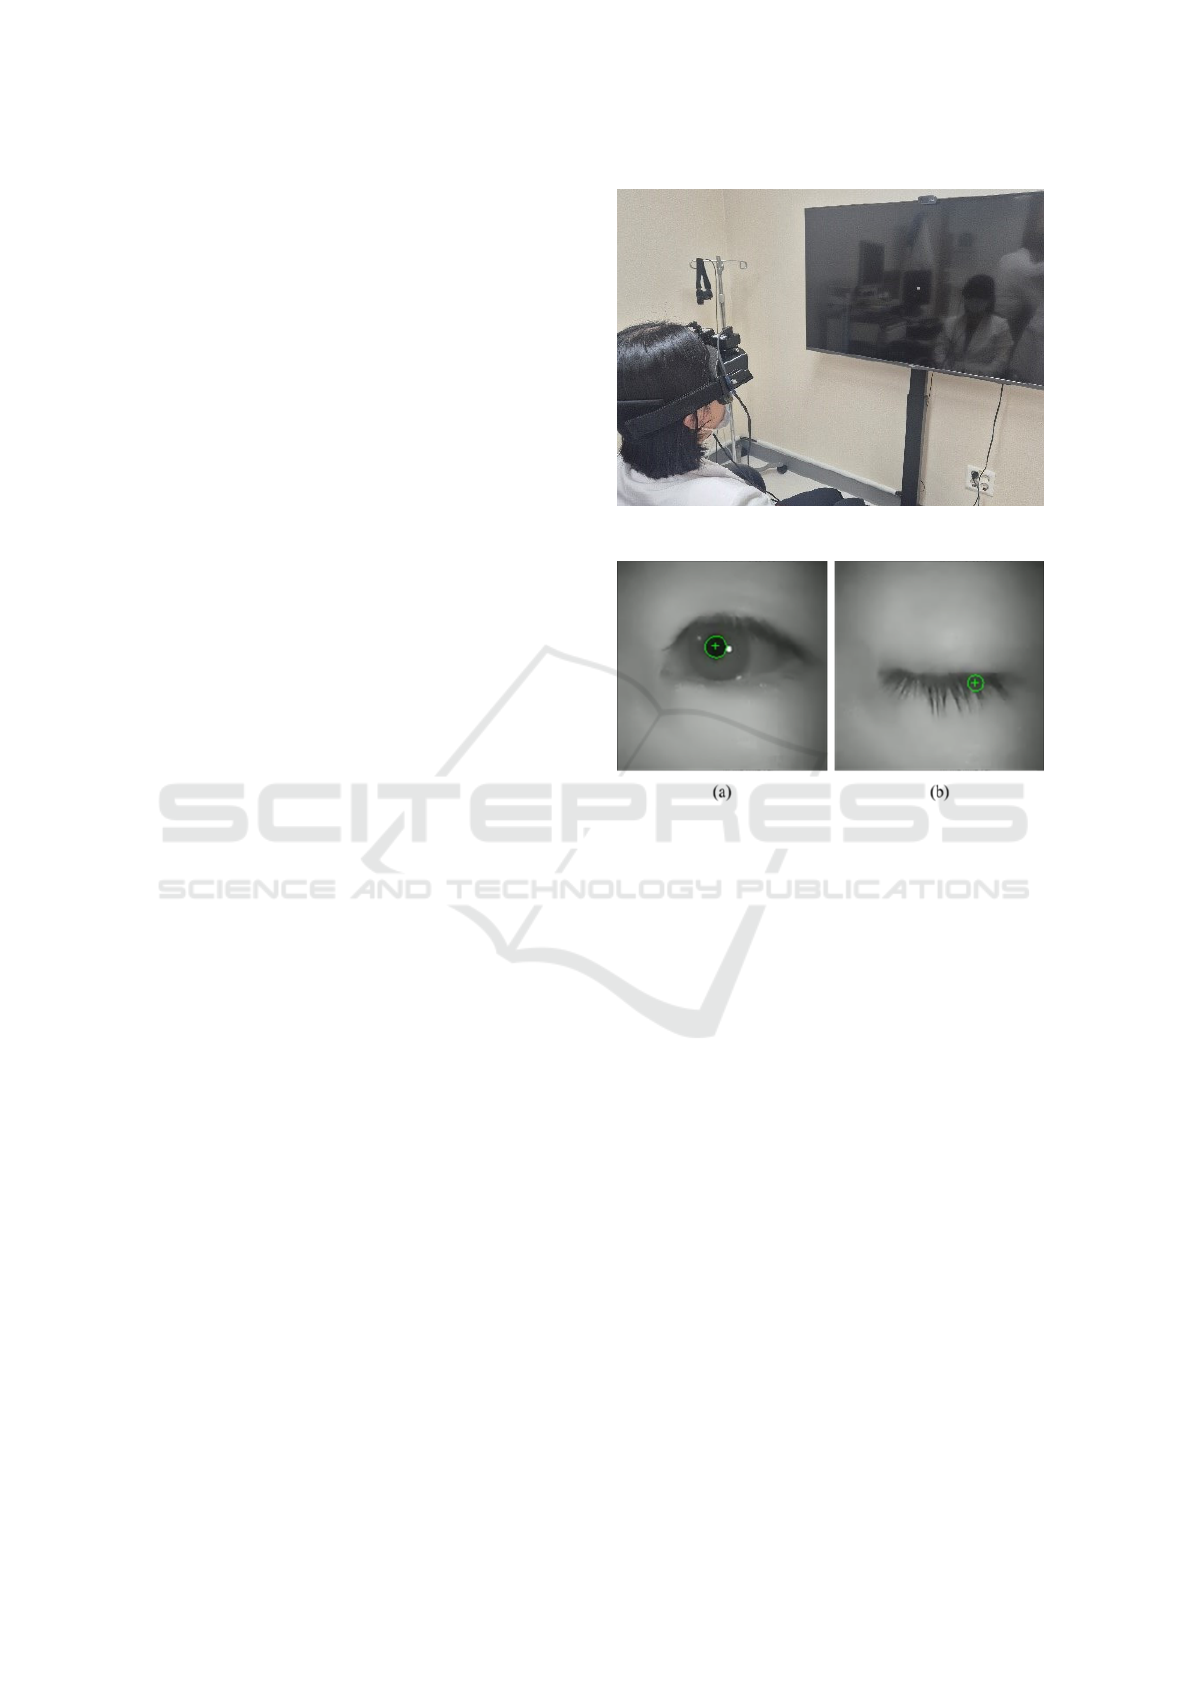
3.2 Data Acquisition
Eye-tracking data are collected through VOG
(SLVNG, SLMED, Seoul, South Korea) during three
visual tasks: fixation, saccade, and smooth pur-
suit. Participants wore cameras-equipped goggles to
record their eye movements, with visual stimuli pre-
sented on a 50-inch monitor positioned 1000mm from
the participants’ eyes. Figure 2 illustrates the experi-
mental setup for the VOG test.
A 5-point calibration is performed prior to each
test to ensure measurement accuracy. The VOG sys-
tem records eye movements at 30 Hz.
• Fixation Task: Participants maintain a gaze on a
stationary target to assess their fixation ability.
• Saccade Task: Participants shift their gaze be-
tween two fixed points to measure saccadic speed
and accuracy. The task includes pro-saccades,
where they look at a sudden target, and anti-
saccades, where they look at the opposite direc-
tion of the target either horizontally or vertically.
• Smooth Pursuit Task: Participants track a mov-
ing target to evaluate smoothness.
This study analyzes the horizontal pro-saccade
task, known to be useful for early diagnosis. (Li et al.,
2023) Eye-tracking data are extracted from VOG test
videos using a CNN-based pupil detection network
(Eivazi et al., 2019), which captures the x and y co-
ordinates and the width of the pupil ellipse at 30
Hz. Figure 3 illustrates the pupil detection results:
(a) shows detection during normal eye movements,
while (b) shows detection during a blink, where the
network misidentifies the pupil, returning abnormally
small pupil ellipse widths. During blinks, the pupil
ellipse width often falls below 1.5 times the average,
Figure 2: Video oculography.
Figure 3: Eye-tracking results using the pupil detection net-
work. (a) Detection results for normal eye movements. (b)
Detection results during a blink.
and these segments are therefore defined as blinks and
adjusted using linear interpolation.
4 METHODS
4.1 Preprocessing
Since raw time-series data may contain some noise
caused by A) participants’ head movements, B) the
resolution and positioning of the camera used to
record eye-tracking data, and C) demographic char-
acteristics such as participants’ age, we first refine the
data by performing outlier removal, coordinate nor-
malization, and data cleaning.
Outliers are identified with a z-score threshold of
2.5 and adjusted using linear interpolation to preserve
the continuity of the time-series data.
Since participant eye positions vary across VOG
recordings, comparing the data is challenging. To ad-
dress this, normalizing the eye center coordinates is
crucial. The central reference point is calculated by
averaging the maximum and minimum x and y coor-
HEALTHINF 2025 - 18th International Conference on Health Informatics
264
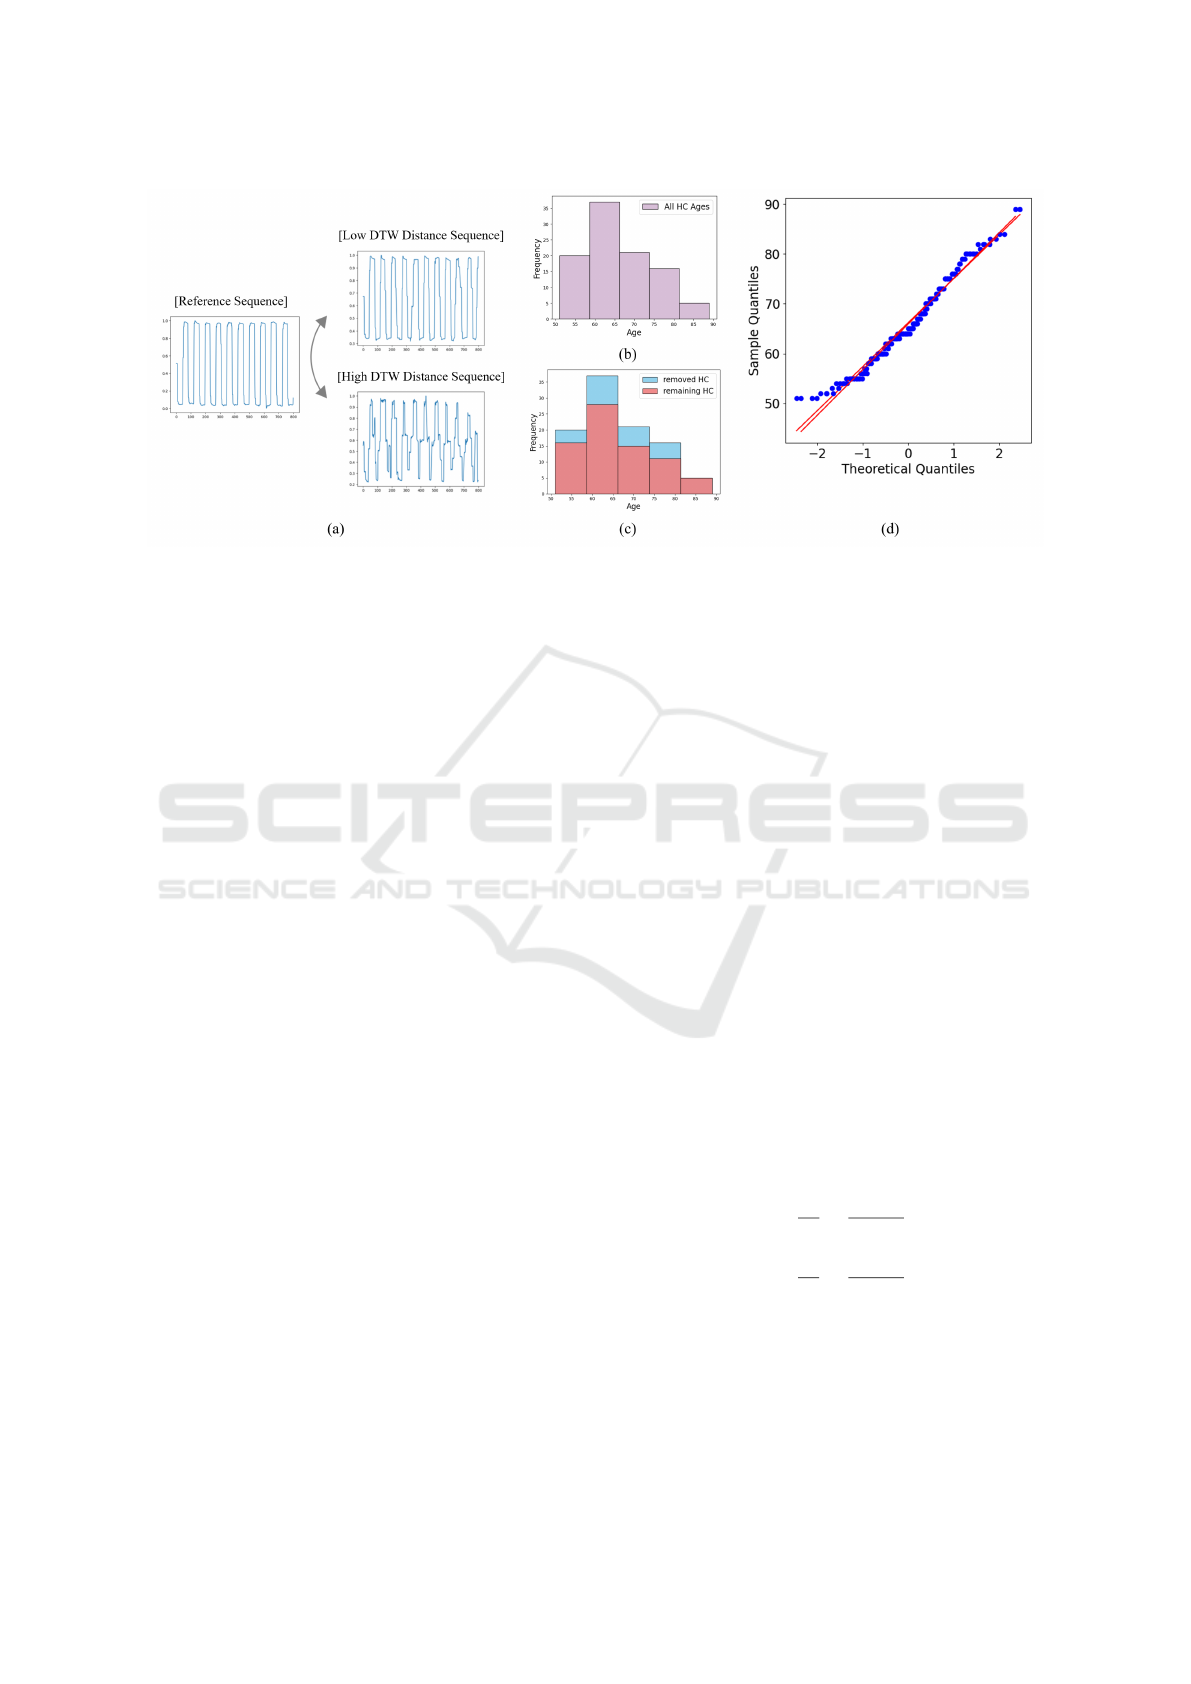
Figure 4: Overview of data cleaning using DTW. (a) Comparison of low and high DTW distance sequences with the reference.
(b) Histogram of HC age distribution before cleaning. (c) Age distribution of removed HC (blue) and remaining HC (red)
after cleaning. (d) Q-Q plot of HC age distribution before and after cleaning.
dinates. Subsequently, all coordinates were adjusted
relative to this point, representing deviations from the
center instead of absolute positions, ensuring consis-
tency across videos. After normalization, the adjusted
coordinates are scaled to a range between 0 and 1.
In HC data, factors such as age and lack of atten-
tion can make PD classifying HC patterns challenging
(Hindle, 2010). To identify and exclude such anoma-
lous data, dynamic time warping (DTW) is used.
DTW measures the similarity between time-series
data by minimizing the effects of temporal shifts,
which enables the detection of patterns even when se-
quences are misaligned (M
¨
uller, 2007), (Senin, 2008).
A low similarity indicates a high DTW distance,
while a high similarity corresponds to a low DTW
distance. DTW-based data cleaning uses the HC par-
ticipant with the best task performance as a reference,
excluding the top 25% of HC data with high DTW
distances as anomalies to ensure consistency. Fig-
ure 4 demonstrates the DTW cleaning procedure. In
Figure 4(a), sequences with low (142) and high (353)
DTW distances relative to the reference are shown.
The high-distance sequence resembles the PD data,
so these high-distance HC sequences are excluded.
DTW cleaning removes anomalous patterns without
affecting demographic characteristics such as age and
gender. Figure 4(b)–(d) confirm this, with age dis-
tribution histograms and a Q-Q plot showing similar
distributions before and after cleaning.
4.2 Feature Engineering
Clinical data sets contain physiological states, and
new characteristics from mathematical models or
medical knowledge enhance their value. (Sirocchi
et al., 2024) This study utilizes feature engineering to
generate new variables that capture information such
as speed and eye movement states and extend beyond
basic 2D eye-tracking data.
Patients with PD exhibit saccade abnormalities,
such as delayed onset, prolonged duration, reduced
speed, and decreased accuracy. In particular, reduced
saccade velocity and multiple-step saccades are key
early indicators, but are difficult to accurately capture
in VOG data. To address this, new features are gener-
ated that represent the velocity, acceleration, and eye
movement states, which enhance the network’s ability
to detect PD-related impairments by capturing clini-
cally significant abnormalities.
4.2.1 Velocity and Acceleration Features
To design features that effectively reflect the reduced
saccadic velocity of the peak in PD, velocity and ac-
celeration are calculated using the x and y coordi-
nates. The velocity variable is determined by measur-
ing the difference in the x- and y-coordinate values
over the time intervals between timestamps. This can
be expressed with the following 1, 2:
v
x
=
∆x
∆t
=
x
2
− x
1
t
2
−t
1
(1)
v
y
=
∆y
∆t
=
y
2
− y
1
t
2
−t
1
(2)
where v represents the velocity, ∆x is the change in
the x coordinate, and ∆t t is the time interval.
After creating the velocity variable, the acceler-
ation variable is derived from the rate of change in
velocity, calculated by dividing the change in the ve-
locity of eye movements by the time intervals. This
Early Diagnosis of Parkinson’s Disease via Pro-Saccadic Eye Movement Analysis: Multimodal Intermediate Fusion Framework
265
can be represented by the following 3:
a =
∆v
∆t
=
v
2
− v
1
t
2
−t
1
(3)
where a denotes acceleration and ∆v is the change in
velocity over a specific time interval.
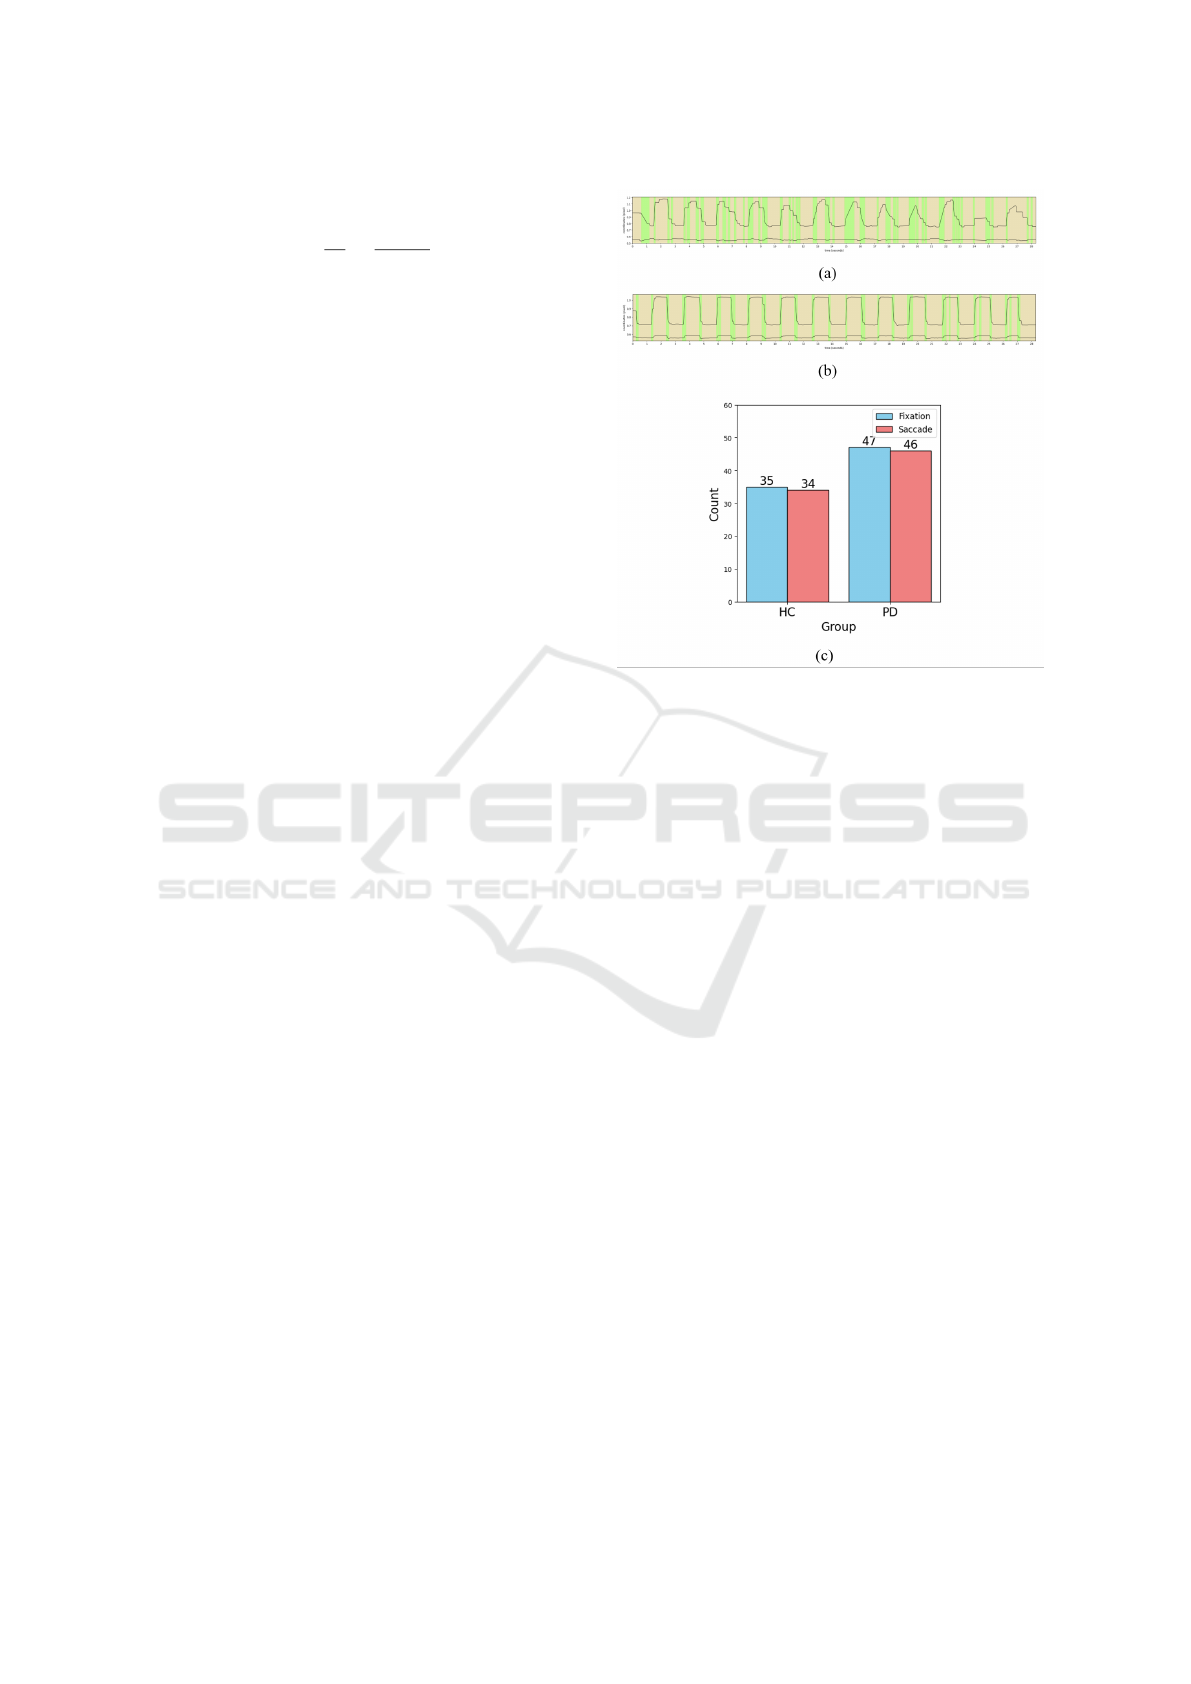
4.2.2 Eye Movement State Features
Designing features to capture multiple-step saccades
in PD provides crucial clinical insights that are of-
ten difficult to extract from raw data. Based on
I-VT (identifying velocity threshold) (Birawo and
Kasprowski, 2022), Remodnav classifies eye move-
ments as fixation, saccade, post-saccadic oscillation,
and smooth pursuit. Movements above a velocity
threshold are labeled as saccades, while those below
are fixations (Dar et al., 2021). Eye movements that
exceed a specific velocity threshold are labelled as
saccades, while those below the threshold are clas-
sified as fixations.
In multiple-step saccades, several short fixation
periods typically occur during the saccade. These dis-
ruptions lead to an increased frequency of saccades
and fixations in PD (Blanke and Seeck, 2003). To
analyze multiple-step saccades more effectively, we
modified the existing algorithm to enable binary de-
tection of only fixation and saccade. By utilizing Re-
modnav, we detect the irregular, multiple short fixa-
tions that occur between saccades.
Figure 5(a) shows the classification of eye move-
ments into fixations and saccades during the pro-
saccade task in PD, while Figure 5(b) presents the re-
sults for healthy controls (HC). Figure 5(c) compares
the two groups with a histogram, highlighting higher
counts of saccades and fixations in PD due to frequent
multiple-step saccades.
The proposed framework integrates medical char-
acteristics of eye movements, effectively capturing
clinically significant abnormalities and improving
classification performance in PD. This feature engi-
neering process resulted in eight-dimensional data:
timestamp, eye position, eye velocity, eye accerler-
ation, and eye movement states.
4.3 Time-Series Data into Images
To leverage the image classification capabilities of
CNN, approaches have been developed to transform
time-series data into images, enabling both visualiza-
tion and multi-perspective analysis. Wang and Oates
(Wang and Oates, 2015) encoded time-series data as
Gramian Angular Fields (GAF) and Markov Transi-
tion Fields (MTF), while Hatami et al. (Hatami et al.,
2017) used Recurrence Plots (RP), achieving higher
Figure 5: Results of eye movement state detection. (a) PD
results, (b) HC results, (c) Comparison of PD and HC.
accuracy than traditional methods. Each encoding
technique captures unique features: GAF preserves
temporal correlations, MTF reflects dynamic transfor-
mations, and RP captures texture and long-term cor-
relations (Quan et al., 2023).
In this study, we apply these encoding methods
to all variables and combine the resulting images to
represent multidimensional time-series data as a con-
catenated image. Figure 6 presents the encoded PD
and HC images, with encoding techniques detailed in
subsequent sections.
4.3.1 Gramian Angular Field (GAF)
GAF encodes time-series data into polar coordinates
to represent static relationships between data points.
First, the time-series data is normalized to fit within
the range [-1, 1] or [0, 1]. Each data is then encoded
as the cosine of an angle, with time represented as the
radius in the polar coordinate system. The inner prod-
uct between data points is calculated to generate a ma-
trix, which is visualized as an image. GAF preserves
the temporal dependencies of the time-series data and
highlights key features through angular information,
facilitating the analysis of static characteristics. Fig-
ure 6 (a) shows the encoded time-series images of the
PD and HC data using GAF.
HEALTHINF 2025 - 18th International Conference on Health Informatics
266
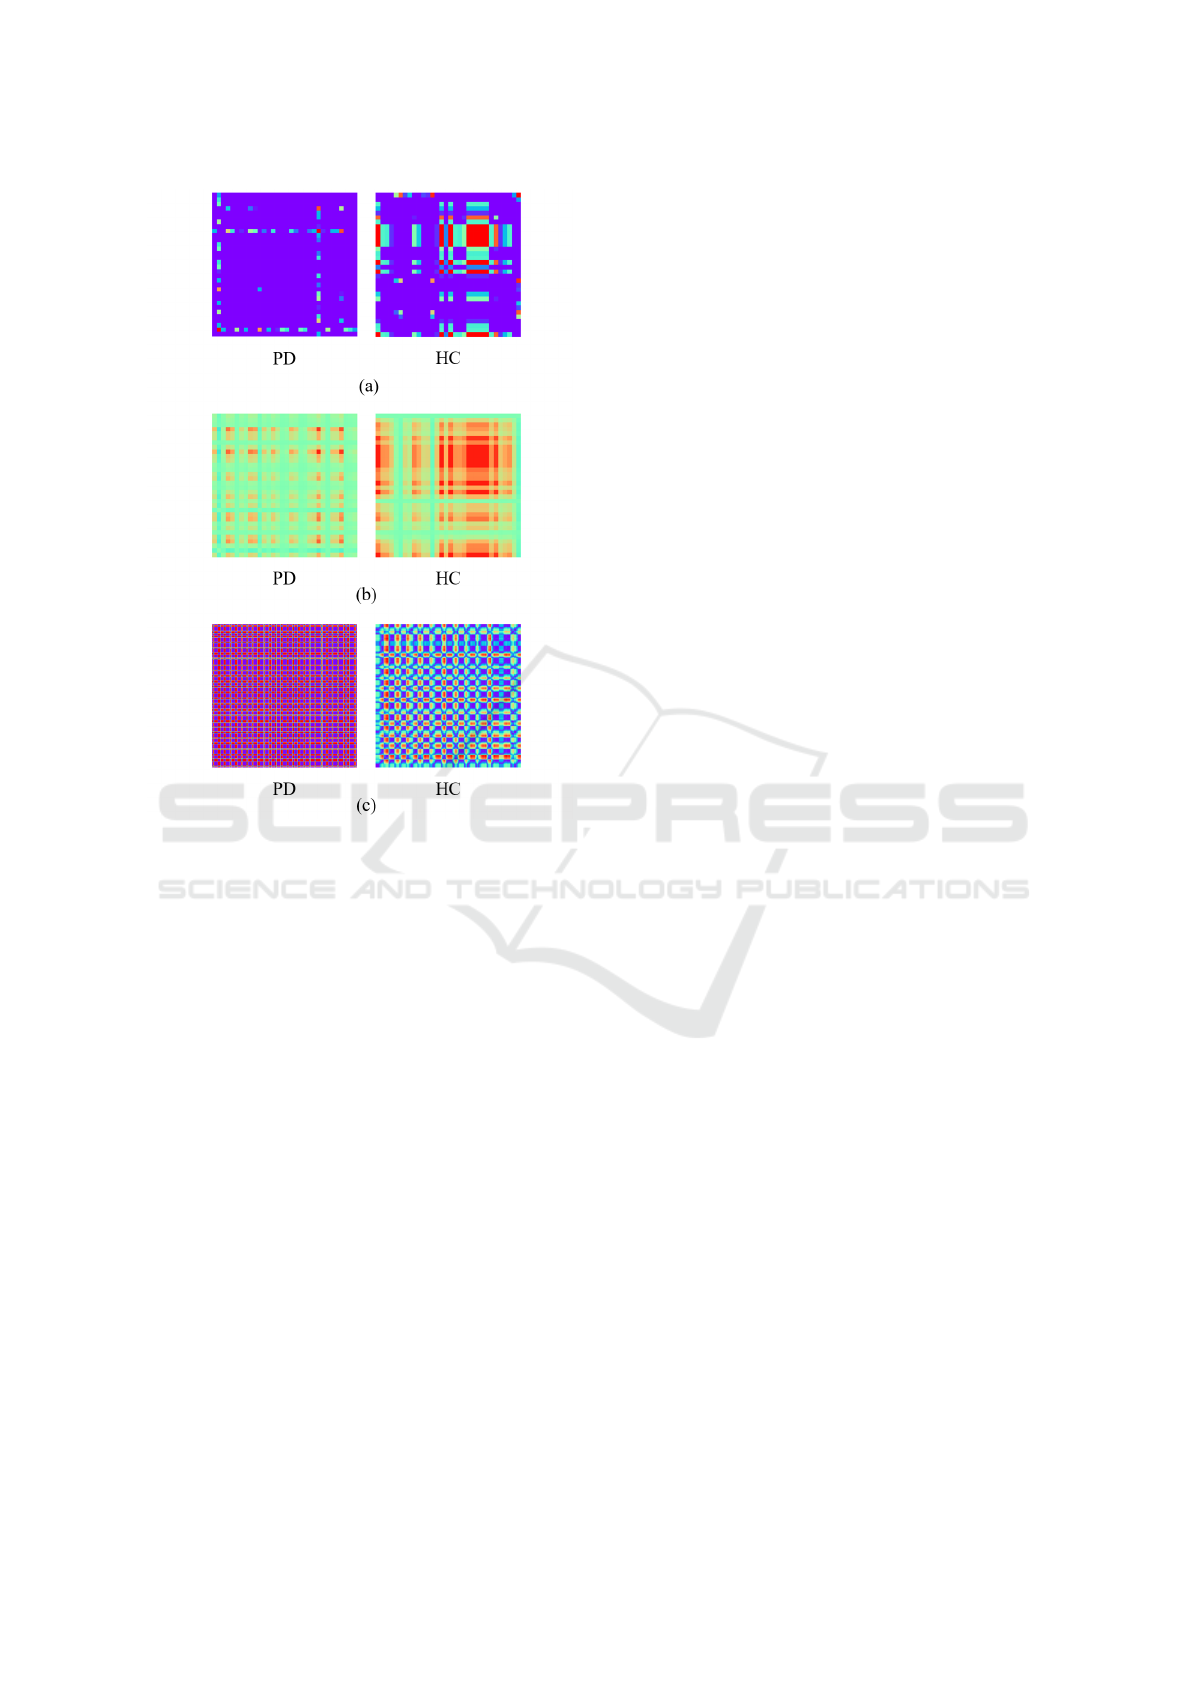
Figure 6: Encoded time-series images of PD and HC. (a)
GAF. (b) MTF. (c) RP.
4.3.2 Markov Transition Field (MTF)
MTF emphasizes dynamic changes in time series by
encoding temporal transition probabilities. The time-
series data is divided into multiple quantiles, and the
transition probabilities between these quantiles are
calculated. The MTF matrix arranges the transition
probabilities along the time axis, visually encoding
the transitions over time intervals. MTF is effective
in capturing dynamic properties such as temporal pat-
terns and transitions. Figure 6 (b) shows the encoded
time-series images of the PD and HC data using MTF.
4.3.3 Recurrence Plot (RP)
RP encodes repetitive patterns in time series by gen-
erating a matrix based on time-point similarity. Cal-
culates the Euclidean distance and assigns 1 if it is
below a threshold and 0 otherwise. RP emphasizes
periodicity and is useful for analyzing nonlinearity of
dynamic systems. It can also identify various states
such as trends, laminar states, and drifts in the data.
Figure 6 shows the encoded time-series images of PD
and HC data using RP.
4.3.4 Image Concatenation
When all 8 variables are transformed into encoded
time-series images using the three techniques—GAF,
MTF, and RP—they are concatenated along the chan-
nel dimension, resulting in a tensor-shaped (32, 32,
24). The first two dimensions represent the spatial
size of the images, while the last dimension corre-
sponds to the number of channels formed by the con-
catenation of images transformed using GAF, MTF,
and RP techniques. Figure 8 illustrates the structure
of the concatenated time-series images.
4.4 Proposed Multimodal Intermediate
Fusion Network
Converting one-dimensional time-series pupil data
into two-dimensional image data effectively reveals
both numerical and temporal information from the
time-series. This conversion provides insights into
correlations, similarities, and quantity of informa-
tion at various time points, thereby improving the
accuracy of classification using networks. However,
some detailed information from the original one-
dimensional data may be lost during the encoding
process (Quan et al., 2023).
Therefore, the proposed network consists of two
main components: CNN for processing encoded time-
series image data and Transformer for analyzing time-
series data. The features extracted from both com-
ponents are concatenated, allowing the network to
fuse information from both modalities and enhancing
its ability to capture complex patterns, thus improv-
ing classification performance. The overall network
structure is illustrated in Figure 7.
4.4.1 CNN for Encoded Time-Series Images
The first component of the proposed network is a
CNN for processing encoded time-series image data.
CNN captures the global information from the eye-
tracking data from encoded time-series images.
After encoding the time-series data into images
using image encoding techniques, the encoded time-
series images serve as input to CNN. The first con-
volutional layer uses 64 filters with a 3x3 kernel to
extract features from the images, applying the ReLU
activation function and L2 regularization to prevent
overfitting. A MaxPooling layer is then applied to
reduce spatial dimensions by half, focusing on im-
portant features while reducing computational costs.
The second convolutional layer also uses 32 filters to
extract additional features, followed by another Max-
Pooling layer to further reduce the dimensions. Sub-
sequently, the Flatten layer converts the output into a
Early Diagnosis of Parkinson’s Disease via Pro-Saccadic Eye Movement Analysis: Multimodal Intermediate Fusion Framework
267
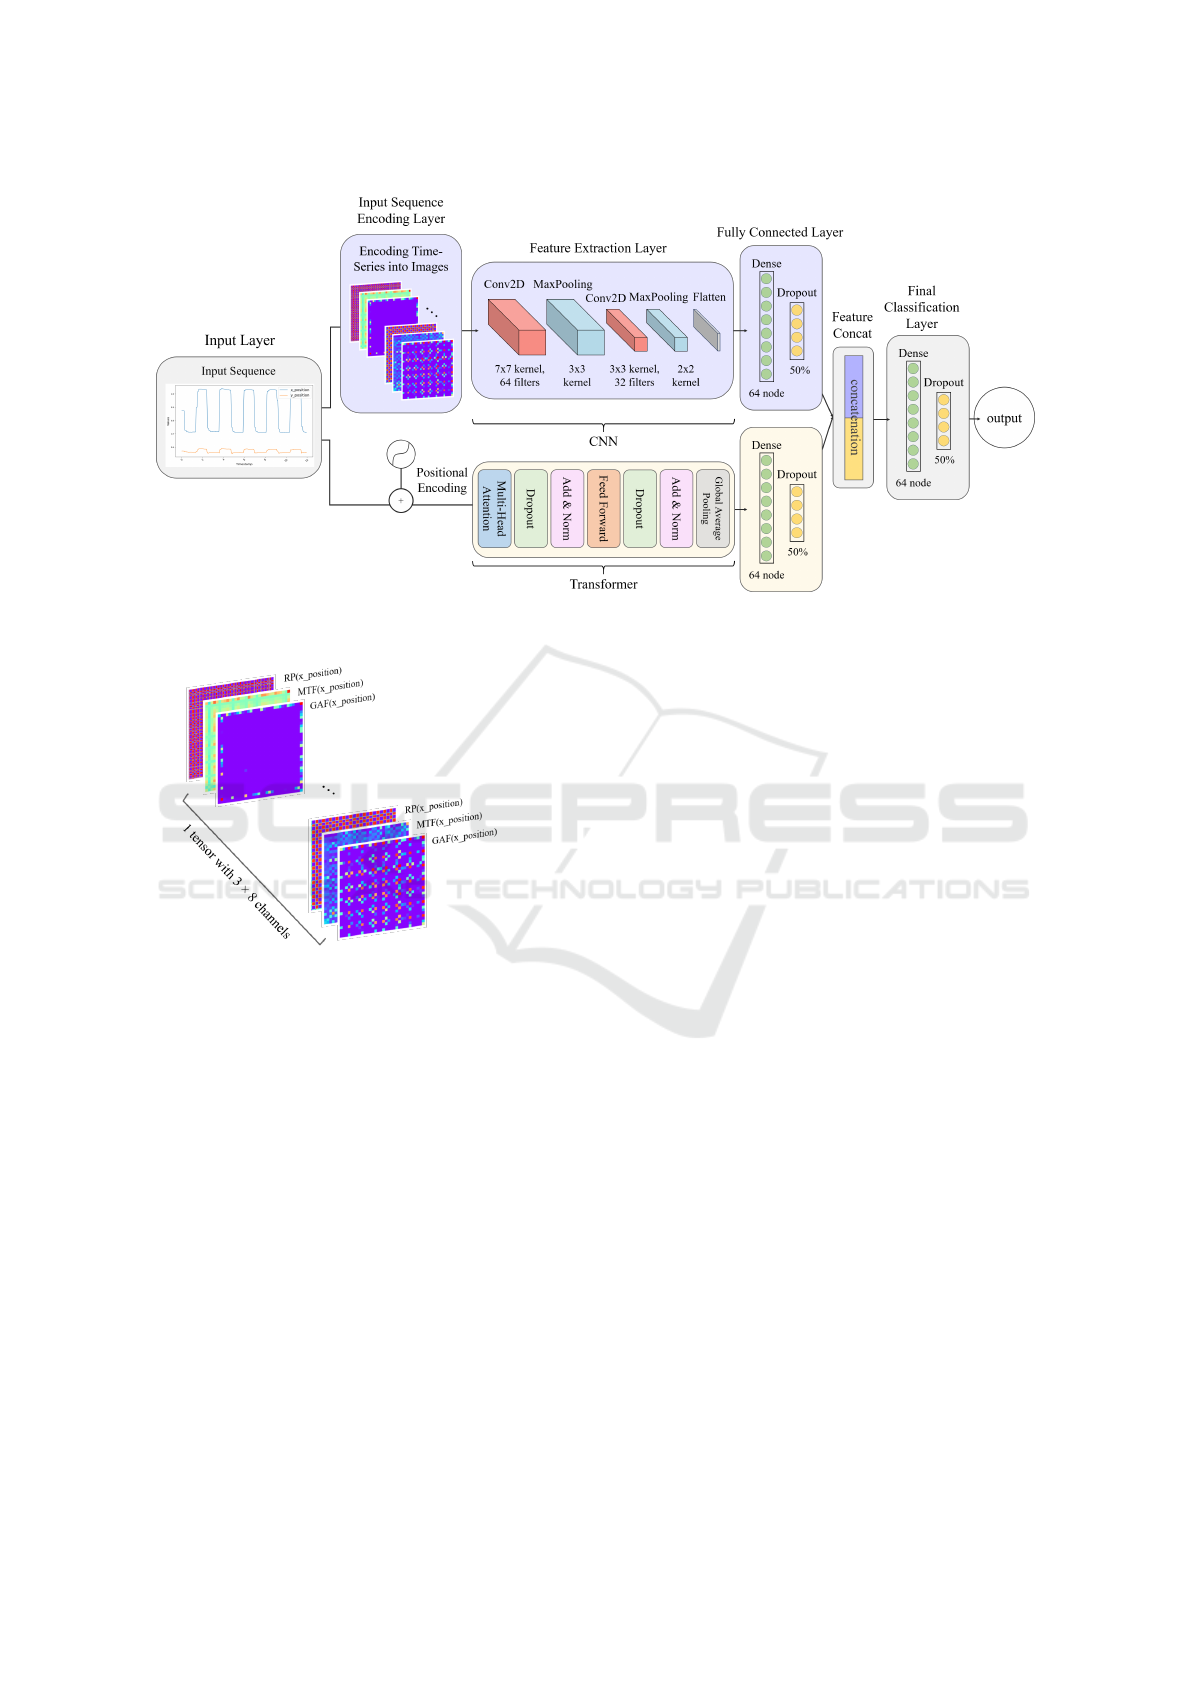
Figure 7: Multimodal intermediate fusion network of CNN and Transformer for detecting abnormal eye movements in PD.
Figure 8: All 8 variables are encoded into GAF, MTF, and
RP images of size (32x32), resulting in a total of 24 im-
ages. These 24 images are then concatenated, so each data
instance is a tensor of shape (32, 32, 24).
one-dimensional vector, while the dense and dropout
layers introduce non-linearity and prevent overfitting.
4.4.2 Transformer for Time-Series Data
The second component of the proposed network is a
Transformer for processing original time-series data,
focusing on effectively learning the temporal patterns
within the sequence data.
It starts with an input layer defining the input
shape based on the sequence length and features per
time point. Positional encoding preserves tempo-
ral information, and the Multi-Head Attention layer
computes attention scores to focus on relevant parts
of the sequence. Dropout prevents overfitting, fol-
lowed by layer normalization and residual connec-
tions to enhance stability. The feed-forward network
includes two dense layers introducing non-linearity,
with dropout after the first layer. Finally, a Global
Average Pooling layer summarizes sequence informa-
tion, and a dense layer captures complex features.
4.4.3 Concatenation of Features
The features extracted from CNN and Transformer
are combined through a concatenate layer. This inter-
mediate fusion structure combines information from
two distinct input modalities, helping to enhance the
network’s performance. The combined features are
then passed through the final classification layer to
generate the prediction outputs. Thus, the proposed
CNN-Transformer intermediate fusion structure ef-
fectively combines image and time-series data, har-
nessing the strengths of both modalities.
5 RESULTS
To verify the effectiveness of multimodal data, we
evaluated the proposed network with three data
modalities: time-series data, encoded time-series im-
age data, and their fusion. For encoded time-series
images and fused data, seven combinations of en-
coded image data were compared, as shown in Table
3, using accuracy, precision, recall, and F1-score.
The network using only time-series data showed
limited results, with 26% precision and 51% recall,
suggesting that temporal information alone is insuffi-
cient to capture complex eye movement patterns.
In the case of the network using encoded time-
HEALTHINF 2025 - 18th International Conference on Health Informatics
268
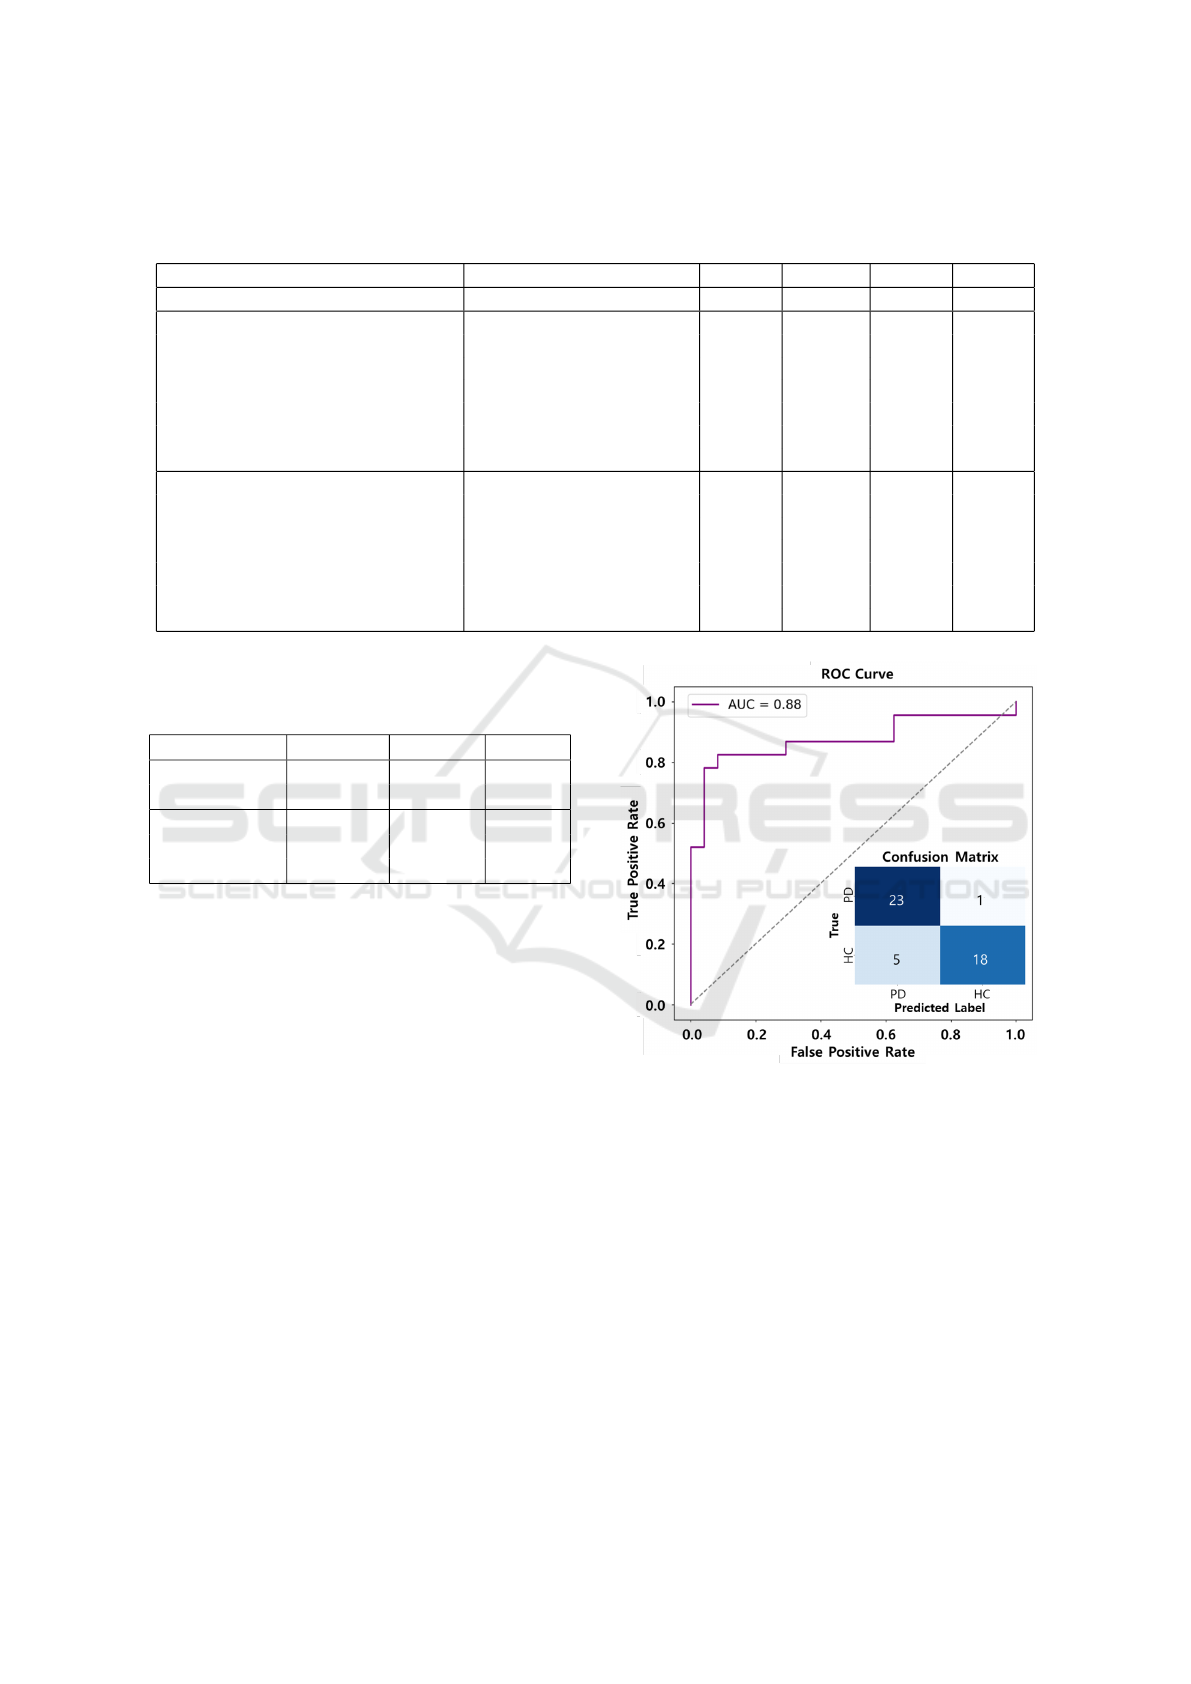
Table 2: Summary of classification results by data modality and image encoding techniques, showing performance met-
rics—Accuracy (Acc), Precision (Prec), Recall (Rec), and F1-score (F1). The table illustrates the impact of various combina-
tions on classification effectiveness, providing insights into the most effective approaches.
Data Modality Encoding Techniques Acc (%) Prec (%) Rec (%) F1 (%)
Time-series (Transformer) - 57 26 51 35
Encoded time-series image (CNN)
GAF 74 80 74 73
MTF 51 26 51 35
RP 72 72 72 72
GAF + MTF 74 75 74 74
MTF + RP 64 65 64 64
GAF + RP 72 72 72 72
GAF + MTF + RP 81 81 81 81
Fusion of time-series and
encoded time series image
(Multimodal Intermediate Fusion
Network)
GAF 77 (+3) 77 (-3) 77 (+3) 77 (+4)
MTF 57 (+6) 69 (+43) 57 (+6) 51 (+16)
RP 81 (+9) 78 (+6) 77 (+5) 76 (+4)
GAF + MTF 81 (+7) 81 (+6) 81 (+7) 81 (+7)
MTF + RP 77 (+13) 78 (+13) 77 (+13) 76 (+12)
GAF + RP 77 (+5) 77 (+5) 77 (+5) 77 (+5)
GAF + MTF + RP 87 (+6) 88 (+7) 87 (+6) 87 (+6)
Table 3: The classification report of the best-performing
network (Fusion of time-series and encoded time-series im-
ages: GAF, MTF, RP).
Class Prec (%) Rec (%) F1 (%)
0.0 (PD) 82 96 88
1.0 (HC) 95 78 86
Accuracy - - 87
Macro avg 88 87 87
Weighted avg 88 87 87
series images only, MTF showed the lowest perfor-
mance (26% precision, 51% recall) among conditions
using a single type of encoded time-series image.
In contrast, GAF achieved the highest performance
(80% precision, 74% recall), indicating better visual
pattern recognition. In the case of RP showed mod-
erate performance (72% precision, 72% recall). The
results using two types of encoded image data did not
show significant changes in performance. However,
when all three types of encoded image data were used,
the result showed the best and well-balanced perfor-
mances, and this surpasses all other combinations.
In the case of the intermediate fusion network us-
ing both time-series and encoded time-series images,
performance improved significantly across all seven
encoded data combinations compared to the network
using only encoded image data. In particular, when
the three types of encoded image data were used, the
network achieved an accuracy, precision, recall, and
F1-score of 87%, 88%, 87%, and 87%, respectively,
showing an improvement of approximately 6%. This
represents the best performance among all conditions
presented in Table 2. The detailed classification report
in Table 3 shows excellent performance in classifying
Figure 9: ROC Curve and confusion matrix of the best-
performing network (Fusion of time-series and encoded
time-series images: GAF, MTF, RP).
PD and HC, with a PD recall of 96%.
6 DISCUSSION
6.1 Performance Analysis
Based on the research findings, the proposed multi-
modal intermediate fusion network to diagnose PD
using eye movements offers the following insights.
• As shown in Table 2, the proposed frame-
work achieved a particularly high recall of 96%,
Early Diagnosis of Parkinson’s Disease via Pro-Saccadic Eye Movement Analysis: Multimodal Intermediate Fusion Framework
269

Table 4: Comparison between Previous studies and Proposed framework. The classification report for previous studies is
calculated using the confusion matrix provided in those studies.
(Brien et al., 2023) (de Villers-Sidani
et al., 2023)
(Jiang et al., 2024) Proposed framework
Participants 140 (PD:121, HC:106) 121 (PD:59, HC:62) 66 (PD:44, HC:22) 183 (PD:84, HC:99)
Eye Movements Pro-saccade,
Anti-saccade
Fixation, Pro-saccade,
Anti-saccade
Fixation,
Saccade, Synthetic
Pro-saccade
Experimental Setup 17-inch monitor,
600mm eye-screen
distance, 9-point cali-
bration grid
12.9-inch iPad Pro,
45cm eye-screen dis-
tance, calibration with
moving target
VR headset, seated in
detection range of a
3D locator, calibration
with scene image
50-inch monitor,
1000mm eye-screen
distance, 5-point cali-
bration grid
Data Analysis Method-
ologies
A voting classifier
combining support
vector machine, lo-
gistic regression, and
random forest.
Logistic regression
with ridge regular-
ization and random
undersampling.
K-Nearest Neighbors,
Support Vector Ma-
chine and Random
Forest
Multimodal
Intermediate
Fusion Network
Classification Report
Accuracy 81% 90% 83% 87%
PD Precision: 83%
Recall: 79%
F1-Score: 81%
Precision: 93%
Recall: 87%
F1-Score: 90%
Precision: 86%
Recall: 91%
F1-Score: 89%
Precision: 82%
Recall: 96%
F1-Score: 88%
HC Precision: 78%
Recall: 82%
F1-Score: 80%
Precision: 86%
Recall: 92%
F1-Score: 89%
Precision: N/A
Recall: N/A
F1-Score: 82%
Precision: 95%
Recall: 78%
F1-Score: 86%
demonstrating its ability to accurately identify pa-
tients with PD and minimize missed diagnoses.
This suggests that the proposed deep learning-
based approach for the diagnosis of PD can be
highly effective for the early detection of PD.
• In Table 3, the performance of the single network
using only time-series data was insufficient. How-
ever, the multimodal intermediate fusion network
showed an average performance improvement of
over 6%. These results indicate that the fused net-
work effectively addresses the limitations of tra-
ditional machine learning techniques, which often
fail to capture complex interactions between time
points in eye-tracking data.
• In particular, under the condition of using a single
MTF, the fused network outperformed the single
network by using only the encoded image data by
43%. Furthermore, the fused network exhibited
balanced performance in all metrics, including ac-
curacy, precision, and recall, reflecting its ability
to generalize effectively.
These insights show that the proposed framework
not only improves diagnostic accuracy, but also pro-
vides a robust and generalized solution to analyze ab-
normalities in eye movement. In addition, the ROC
curve and the confusion matrix for the best perform-
ing model are presented in Figure 9. These demon-
strate that the proposed framework achieves excellent
classification performance while maintaining a strong
balance between sensitivity and specificity, even with
a high recall for PD.
6.2 Limitations
This study demonstrated the effectiveness of using
abnormal eye movement information within a fused
deep learning framework for the early diagnosis of
PD. However, to enable the proposed method to be
used more effectively as a biomarker in practical ap-
plications, additional improvements are required ad-
dressing the following limitations.
• Ensuring consistent performance across diverse
environments and conditions requires more com-
prehensive data. The data used in this study were
collected under specific experimental conditions,
which may limit the generalizability to clinical
settings. In particular, the DTW-based data clean-
ing process can exclude HC with age-related ab-
normalities in eye movement. These could lead to
overfitting or reduced performance, highlighting
the need to integrate data from a broader range of
conditions and environments.
• Although the proposed framework demonstrated
HEALTHINF 2025 - 18th International Conference on Health Informatics
270

better recall to identify PD compared to previous
studies shown in Table 4, further enhancements
in overall performance and interpretability are es-
sential for clinical application. The ”black-box”
nature of deep learning complicates the under-
standing of its decision-making processes, mak-
ing further research necessary to improve the in-
terpretability of the model.
• Also, Table 4 highlights the types of eye move-
ment examined in previous studies versus the pro-
posed framework. While earlier research utilized
fixation, pro-saccade, and anti-saccade move-
ments, this study restricted its focus to horizontal
pro-saccades. Future clinical applications will re-
quire models trained on a broader spectrum of eye
movement types.
6.3 Future Work
To address the limitations mentioned above, this study
proposes a future work utilizing smart glasses, as il-
lustrated in Figure 10. The proposed smart glasses
are equipped with an eye camera to collect eye move-
ment data and a scene camera to gather information
about the surrounding environment. This enables the
following complementary research directions:
• Eye movement data collected using VOG devices
are limited to predefined eye movement tasks per-
formed in a controlled laboratory environment,
which may result in diagnostic errors due to in-
dividual differences such as tension and concen-
tration. However, by utilizing smart glasses, it be-
comes possible to track abnormal eye movements
without requiring outpatient visits. Furthermore,
data collection can occur in a relaxed environment
where users are naturally situated, allowing the
acquisition of purer eye movement information.
• While eye movement abnormalities are a hallmark
prodromal symptom of PD that reflects cognitive
mechanism impairments, other indicators of cog-
nitive dysfunction may also be observed. For ex-
ample, motor symptoms such as freezing of gait
and non-motor symptoms such as visual halluci-
nations are key diagnostic clues for PD. By lever-
aging smart glasses, it is possible not only to track
eye movement data but also to use the built-in
front-facing camera and IMU sensors to collect
data on these motor and non-motor symptoms.
By applying the framework of this study to
smart glasses, it becomes possible to develop digital
biomarkers capable of seamless data collection in ev-
eryday environments. This approach takes advantage
of the growing market for smart glasses to enhance
Figure 10: Configuration of the smart glasses-based visual
perception analysis system for early PD diagnosis.
the practical applicability of early PD diagnostic tech-
nologies. Additionally, multimodal data analysis en-
compassing eye movements, motor and non-motor
symptoms can improve the specificity of PD-focused
biomarkers. This will enable the effective distinction
between PD and other neurodegenerative disorders,
contributing to advancements in related technologies.
7 CONCLUSION
This study presents a novel approach to classify PD
and HC using eye-tracking data obtained via VOG.
The proposed multimodal framework is an intermedi-
ate fusion method that combines a CNN for process-
ing encoded time-series images and a Transformer for
analyzing raw time-series data. The experimental re-
sults demonstrate the ability of the framework to de-
tect subtle abnormalities in eye movements, achiev-
ing a recall rate of 96% for PD. These findings sug-
gest that eye-tracking data could serve as a biomarker
for early-stage PD diagnosis. Looking ahead, as eye-
tracking technology becomes more common in aug-
mented reality (AR) or virtual reality (VR) devices
like smart glasses, this framework could support early
self-diagnosis, disease progression monitoring, and
remote detection of PD, enabling practical applica-
tions in real-world healthcare scenarios.
ACKNOWLEDGEMENTS
This work was financially supported by the Ko-
rea Institute of Science and Technology Institutional
Program (Project No. 2E33841) and the National
Research Foundation of Korea (NRF) grant funded
by the Korea government (MSIT) (No. RS-2023-
00279304).
Early Diagnosis of Parkinson’s Disease via Pro-Saccadic Eye Movement Analysis: Multimodal Intermediate Fusion Framework
271

REFERENCES
Birawo, B. and Kasprowski, P. (2022). Review and eval-
uation of eye movement event detection algorithms.
Sensors.
Blanke, O. and Seeck, M. (2003). Direction of saccadic and
smooth eye movements induced by electrical stimu-
lation of the human frontal eye field: effect of orbital
position. Experimental Brain Research, 150:174–183.
Brien, D. C. et al. (2023). Classification and staging of
parkinson’s disease using video-based eye tracking.
Parkinsonism & Related Disorders, 110:105316.
Dar, A. H., Wagner, A. S., and Hanke, M. (2021). Remod-
nav: robust eye-movement classification for dynamic
stimulation. Behavior Research Methods.
de Villers-Sidani, E. et al. (2023). A novel tablet-based
software for the acquisition and analysis of gaze and
eye movement parameters: a preliminary validation
study in parkinson’s disease. Frontiers in Neurology,
14:1204733.
Eivazi, S., Santini, T., Keshavarzi, A., K
¨
ubler, T., and
Mazzei, A. (2019). Improving real-time cnn-based
pupil detection through domain-specific data augmen-
tation. In Proceedings of the 2019 Symposium on
Eye Tracking Research and Applications (ETRA ’19),
page 6, Denver, CO, USA. ACM.
Fawaz, H. I., Forestier, G., Weber, J., et al. (2019). Deep
learning for time series classification: a review. Data
Mining and Knowledge Discovery.
Frei, K. (2020). Abnormalities of smooth pursuit in parkin-
son’s disease: A systematic review. Clinical Parkin-
sonism & Related Disorders, 4:100085.
Haslwanter, T. and Clarke, A. H. (2010). Chapter 5—eye
movement measurement: Electro-oculography and
video-oculography. In Elsevier, editor, Vertigo and
Imbalance: Clinical Neurophysiology of the Vestibu-
lar System, volume 9, pages 61–79. Amsterdam, The
Netherlands.
Hatami, N., Gavet, Y., and Debayle, J. (2017). Classifi-
cation of time-series images using deep convolutional
neural networks. In Tenth International Conference
on Machine Vision (ICMV 2017), volume 10696, page
106960Y. International Society for Optics and Photon-
ics.
Hindle, J. V. (2010). Ageing, neurodegeneration and
parkinson’s disease. Age and Ageing, 39(2):156–161.
Jiang, M., Liu, Y., Cao, Y., Liu, Y., Wang, J., Li, P., Xia, S.,
et al. (2024). Auxiliary diagnostic method of parkin-
son’s disease based on eye movement analysis in a vir-
tual reality environment. Neuroscience Letters.
Koch, N. A., Voss, P., Cisneros-Franco, J. M., et al. (2024).
Eye movement function captured via an electronic
tablet informs on cognition and disease severity in
parkinson’s disease. Scientific Reports, 14:9082.
Lal, V. and Truong, D. (2019). Eye movement abnormalities
in movement disorders, volume 1, pages 54–63.
Li, H., Zhang, X., Yang, Y., and Xie, A. (2023). Abnormal
eye movements in parkinson’s disease: From experi-
mental study to clinical application. In Parkinsonism
& Related Disorders. Elsevier.
Ma, W., Li, M., Wu, J., Zhang, Z., Jia, F., Zhang, M.,
Bergman, H., Li, X., Ling, Z., and Xu, X. (2022).
Multiple step saccades in simply reactive saccades
could serve as a complementary biomarker for the
early diagnosis of parkinson’s disease. Frontiers in
Aging Neuroscience, 14:912967.
M
¨
uller, M. (2007). Dynamic time warping. Springer.
Pretegiani, E. and Optican, L. M. (2017). Eye movements
in parkinson’s disease and inherited parkinsonian syn-
dromes. Frontiers in Neurology, 8:592.
Przybyszewski, A. W.,
´
Sledzianowski, A., Chudzik, A.,
Szlufik, S., and Koziorowski, D. (2023). Ma-
chine learning and eye movements give insights into
neurodegenerative disease mechanisms. Sensors,
23:2145.
Quan, S., Sun, M., Zeng, X., Wang, X., and Zhu, Z. (2023).
Time series classification based on multi-dimensional
feature fusion. IEEE Access.
Rascol, O. et al. (1989). Abnormal ocular movements
in parkinson’s disease: Evidence for involvement of
dopaminergic systems. Brain, 112:1193–121.
Senin, P. (2008). Dynamic time warping algorithm review.
In Department of Information and Computer Science.
ResearchGate.
Sirocchi, C., Bogliolo, A., and Montagna, S. (2024).
Medical-informed machine learning: integrating prior
knowledge into medical decision systems. BMC Med-
ical Informatics and Decision Making.
Tinelli, M., Kanavos, P., and Grimaccia, F. (2016). The
value of early diagnosis and treatment in Parkinson’s
disease: A literature review of the potential clinical
and socioeconomic impact of targeting unmet needs
in Parkinson’s disease. London.
Tolosa, E., Garrido, A., Scholz, S. W., and Poewe, W.
(2021). Challenges in the diagnosis of parkinson’s dis-
ease. Lancet Neurology, 20:385–397.
Turcano, P., Chen, J. J., Bureau, B. L., and Savica, R.
(2019). Early ophthalmologic features of parkinson’s
disease: a review of preceding clinical and diagnostic
markers. Journal of Neurology, 266:2103–2111.
Wang, Z. and Oates, T. (2015). Encoding time series as
images for visual inspection and classification using
tiled convolutional neural networks. In Workshops at
the Twenty-Ninth AAAI Conference on Artificial Intel-
ligence. cdn.aaai.org.
White, O. B., Saint-Cyr, J. A., Tomlinson, R. D., and
Sharpe, J. A. (1983). Ocular motor deficits in parkin-
son’s disease. Brain, 106:571–587.
Yang, Z. Y., Zhang, Y., and Yu, L. N. (2024). Predicting
bank users’ time deposits based on lstm-stacked mod-
eling. Acadlore Transactions on Machine Learning.
Zhang, J., Zhang, B., Ren, Q., et al. (2021). Eye movement
especially vertical oculomotor impairment as an aid
to assess parkinson’s disease. Neurological Sciences,
42:2337–2345.
S¸ tef
˘
anescu, E., Chelaru, V. F., Chira, D., and Mures¸anu,
D. (2024). Eye tracking assessment of parkinson’s
disease: a clinical retrospective analysis. Journal of
Medicine and Life.
HEALTHINF 2025 - 18th International Conference on Health Informatics
272
