
Deep Learning-Based Classification of Stress in Sows Using Facial Images
Syed U. Yunas
1
, Ajmal Shahbaz
1
, Emma M. Baxter
2
, Marianne Farish
2
, Kenneth M. D. Rutherford
2
,
Mark F. Hansen
1
, Melvyn L. Smith
1
and Lyndon N. Smith
1
1
Centre for Machine Vision, University of the West of England (UWE), Bristol, U.K.
2
Scotland’s Rural College (SRUC), Edinburgh, U.K.
{syed.yunas, ajmal.shahbaz}@uwe.ac.uk, {emma.baxter, marianne.farish, kenny.rutherford}@sruc.ac.uk,
Keywords:
Sow Stress Classification, YOLO Model, Convolutional Neural Network (CNN), Deep Learning in
Agriculture, Animal Welfare Monitoring, Stress Detection from Facial Images.
Abstract:
Stress in pigs is a significant factor contributing to poor health, increased antimicrobial usage, and the sub-
sequent risk of antimicrobial resistance (AMR), which poses a major challenge for the global pig farming
industry. In this paper, we propose using deep learning (DL) methods to classify stress levels in sows based on
facial features captured from images. Early identification of stress can enable targeted interventions, poten-
tially reducing health risks and mitigating AMR concerns. Our approach utilizes convolutional neural network
(CNN) models, specifically YOLO8l-cls, to classify the stress levels of sows (pregnant pigs) into low-stressed
and high-stressed categories. Experimental results demonstrate that YOLO8l-cls outperforms other classifi-
cation methods, with an overall F1-score of 0.74, Cohen’s Kappa of 0.63, and MCC of 0.60. This highlights
the model’s effectiveness in accurately identifying stress levels and its potential as a practical tool for stress
management in pig farming, with benefits for animal welfare, the farming industry, and broader efforts to
minimize AMR risk.
1 INTRODUCTION
Modern livestock production demands a keen focus
on animal well-being, driven not only by ethical con-
siderations but also by its significant impact on fac-
tors such as animal health, productivity, and product
quality (Manteca and Alonso, 2000). Stress in pigs is
a major concern as chronic stress weakens their im-
mune system, making them more susceptible to in-
fections (Bartolom
´
e et al., 2004). This, in turn, fu-
els the overuse of antibiotics for treatment and pre-
vention, a significant contributor to the global threat
of Antimicrobial Resistance (AMR) (Arjun et al.,
2020). There is also potential for transgenerational
harm when mothers experience stress during preg-
nancy that can affect perinatal programming via epi-
genetic mechanisms, thus having significant impli-
cations for offspring development (Weinstock, 2008;
Ruijven and Oliehoek, 2017).
Early detection of stress in pigs is therefore
paramount for effective intervention. Traditional
methods, such as manual behavioural observation or
invasive physiological sampling, offer limited solu-
tions. They are time-consuming, expensive, and, in
the case of invasive physiological sampling, could
cause further distress to the animals (Wechsler, 2000),
(Broom, 2011). The development of a non-invasive
automated approach for objectively identifying ani-
mals susceptible to stress might ultimately allow se-
lection of pigs better equipped to cope with health and
environmental challenges.
Advancements in image and video analysis pow-
ered by deep learning, particularly the use of Convo-
lutional Neural Networks (CNNs) for extracting ro-
bust visual features, have revolutionized the study of
animal behaviour (Alpaydin et al., 2020). CNNs have
shown promising results in detecting stress among
different livestock species, including pigs, cows,
poultry, and fish, through the identification of facial
expressions or body language cues exhibited by these
animals (Wang et al., 2020b; Yang et al., 2020; Liu
et al., 2020; Arriaga et al., 2021).
Our study builds upon the prior work by re-
searchers (Hansen et al., 2021), which developed a
CNN-based model to detect stress in young female
pigs (gilts) within a controlled social defeat experi-
mental setup, achieving over 90% accuracy in classi-
fying gilts as stressed or not stressed. In contrast, the
390
Yunas, S. U., Shahbaz, A., Baxter, E. M., Farish, M., Rutherford, K. M. D., Hansen, M. F., Smith, M. L. and Smith, L. N.
Deep Learning-Based Classification of Stress in Sows Using Facial Images.
DOI: 10.5220/0013327900003911
Paper published under CC license (CC BY-NC-ND 4.0)
In Proceedings of the 18th International Joint Conference on Biomedical Engineering Systems and Technologies (BIOSTEC 2025) - Volume 1, pages 390-396
ISBN: 978-989-758-731-3; ISSN: 2184-4305
Proceedings Copyright © 2025 by SCITEPRESS – Science and Technology Publications, Lda.
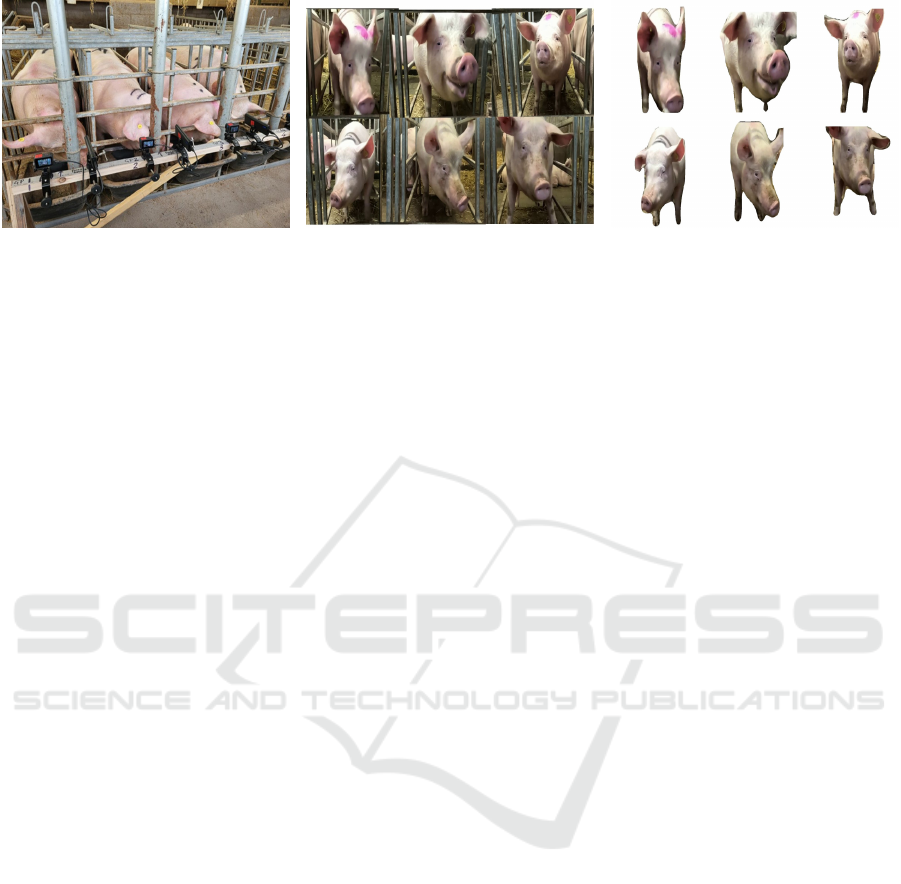
(a) Recording sows: Four of the six
pregnant sows.
(b) Image cropping to exclude occlu-
sions from metal pen bars.
(c) Sow segmentation performed using
Mask-RCNN.
Figure 1: Experimental setup and data pre-processing of sow images.
current study extends this application to real-world,
routine farming conditions, specifically within dry
sow houses where pregnant sows are monitored un-
der standard farming practices. Unlike the model
developed by Hansen et al., which performed a bi-
nary classification of stressed versus non-stressed an-
imals, our study offers a more nuanced approach by
categorizing stress levels into Low-Stressed (LS) and
High-Stressed (HS) groups. This distinction pro-
vides a deeper understanding of stress levels in sows,
enabling a more detailed assessment of their well-
being in typical farming environments. We employed
and evaluated two advanced deep learning models—a
fine-tuned (FT) version of the original model used
by Hansen et al. and the YOLO8l-cls model (Ultra-
lytics, 2024)—to enhance classification performance
and ensure robustness across diverse stress indicators
and scenarios encountered in routine farming. These
modifications aim to not only demonstrate the scala-
bility of deep learning-based stress detection but also
adapt the methodology to better align with the practi-
cal needs of commercial pig farming, thereby advanc-
ing the utility and applicability of automated stress
monitoring systems in real-world settings.
The structure of this paper is as follows: Section II
discusses the experimental setup, including the hard-
ware, dataset, and training process. Section III pro-
vides an overview of the original, FT, and YOLO8
models, including performance metrics used to evalu-
ate these models. Section IV presents the results and
discusses their implications. Finally, Section V con-
cludes the paper.
2 EXPERIMENTAL
2.1 Hardware
Video footage was captured on-farm at SRUC’s Pig
Research Centre, with all experiments reviewed and
approved by SRUC’s Ethical Review Board (AE14-
2022). The setup placed cameras within the dry sow
house, where sows are housed in individual straw
pens with feed stalls. To optimize video recording ef-
ficiency, each camera employed motion detection, au-
tomatically activating to capture high-resolution im-
ages (1920x1080 pixels) at 30 frames per second
when sows entered the feeding areas. Preventative
measures, such as mounting camera brackets outside
pen stalls, minimized the risk of animal interference
with equipment, ensuring both safety and ideal condi-
tions for the subjects.
Stress indicators in sows are often visible through
subtle changes in facial cues—such as the ears, eyes,
cheeks, and snout (Wang et al., 2020a). To reliably
capture these features, the cameras were positioned
at the end of each feed stall as shown in figure 1a,
ensuring the complete face, including eyes and nose,
were visible in each image. During pre-processing,
images were refined to focus primarily on the face,
although sometimes the sow’s body or legs were also
captured due to their proximity to the camera. This
approach was intended to enhance consistency in an-
alyzing facial stress markers while minimizing inter-
ference from other body parts.
2.2 Dataset
A dataset of 900 images was captured from six sows
on day 70 of their gestation. Modifications and fine-
tuning were applied to this dataset as described be-
low. Stress susceptibility, provided by SRUC as
ground truth data, was determined based on each
sow’s social rank and vulnerability to stress during
food competition, following the methodology out-
lined by (Dwyer et al., 2000). This was further
validated through behavioral observations (Janssens
et al., 1995) and cortisol measurements from saliva
samples (Jong et al., 1998), which classified the ani-
mals into low-stress (LS) and high-stress (HS) groups.
Deep Learning-Based Classification of Stress in Sows Using Facial Images
391
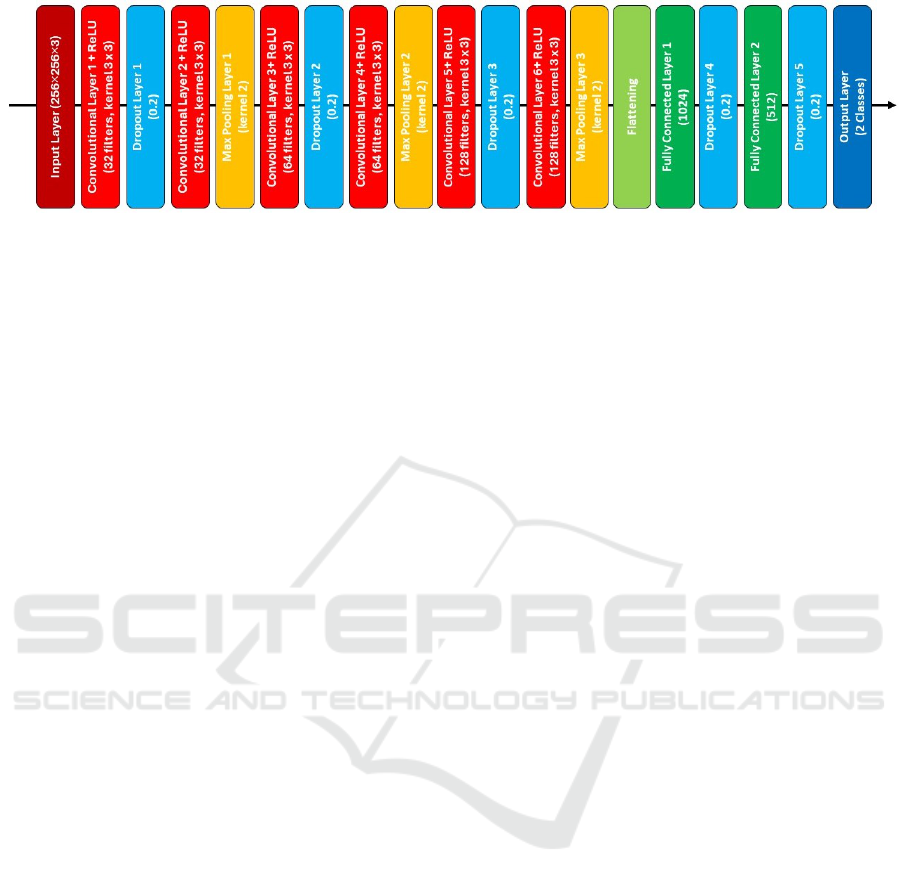
Figure 2: Architecture of the Fine-tuned (FT) model.
To ensure consistency in stress susceptibility cate-
gories, the ground truth data was verified through
multiple behavioral observations and controlled mea-
surements. This expert-labeled data served as the
foundation for training and validating our model, en-
suring that its classifications accurately reflected gen-
uine stress markers rather than individual differences
between animals.
Prior to model testing and training, all images
were cropped to exclude any occlusions from metal
pen bars, and a Mask-RCNN (He et al., 2017) was
employed for background segmentation, as shown in
figure 1b and 1c respectively. This approach ensured
that each image contained only the essential facial
features for analysis, improving the model’s focus on
relevant stress indicators.
2.3 Training Process
The dataset images were trained against ground truth
labels using a Windows 11 PC with a Core i9 proces-
sor running at 3 GHz, 32 GB of RAM, and an Nvidia
RTX 4090 GPU with 24 GB of memory. The DL
models were implemented using the PyTorch library,
version 2.1.1 (Paszke et al., 2019). The training pro-
cess involved 1,000 epochs with a batch size of 32, a
learning rate of 0.0001, and utilizing the Adam opti-
mizer.
3 MODEL OVERVIEW
In this section, we outline the architectures of the
models employed in this study:
3.1 Original and Fine-Tuned (FT)
Models
The original model (Hansen et al., 2021) consists of
six ReLU-activated convolutional layers, five dropout
layers, three max-pooling layers, and two fully con-
nected layers. A sigmoid function is applied to deter-
mine the probability of a sow being stressed, with a
threshold (typically above 0.8) used to classify stress
presence.
In our study, the original model was fine-tuned on
the new dataset to better represent stress features as
observed on the farm as either low-stressed (LS) or
high-stressed (HS). While the original model was de-
signed to classify stressed (positive class) vs. non-
stressed (negative class), this study focuses on quan-
tifying stress levels into LS and HS categories. To
accommodate this, the final layer of the network was
modified to produce two output values, as illustrated
in figure 2. This adjustment removes the need for
thresholding the output, enabling direct classification
of stress levels.
3.2 YOLO8 Model
YOLO (You Only Look Once) is a versatile deep
learning framework widely used for various computer
vision tasks such as detection, segmentation, classifi-
cation, and pose estimation. Its architecture processes
an image by dividing it into a grid, predicting bound-
ing boxes, object confidence scores, and class proba-
bilities simultaneously. By applying Non-Maximum
Suppression (NMS) to eliminate overlapping detec-
tions, YOLO efficiently delivers accurate predictions
in real-time.
In this study, we utilize YOLO8l-cls (Ultralytics,
2024), a classification-specific variant of YOLO8, to
predict stress levels in sows from facial images. This
model was chosen for its strong performance in image
classification, making it well-suited for use as a stress
classifier. It was also selected to compare its stress
classification capabilities against both the original and
fine-tuned (FT) models.
3.3 Performance Metrics
Precision, Recall, and F1-Score are essential metrics
in classification tasks, crucial for assessing DL mod-
els’ performance. Precision, representing the ratio of
true positive predictions to the total positive predic-
BIOIMAGING 2025 - 12th International Conference on Bioimaging
392

Table 1: Cross-validation Results for Sow Stress Classification with Original, Fine-tuned (FT), and YOLO8l-cls Models.
Class Original Model FT Model YOLO8l-cls Model
(Train: 0 fold, Test: 3-fold) (Train: 2-fold, Test: 1-fold) (Train: 2-fold, Test: 1-fold)
Precision Recall F1-Score MCC Kappa Precision Recall F1-Score MCC Kappa Precision Recall F1-Score MCC Kappa
All 0.36 0.44 0.40 -0.12 -0.05 0.71 0.70 0.71 0.50 0.52 0.74 0.74 0.74 0.60 0.63
Low-Stressed (LS) 0.26 0.07 0.11 -0.20 -0.10 0.66 0.83 0.74 0.52 0.54 0.73 0.78 0.75 0.63 0.65
High-Stressed (HS) 0.46 0.81 0.59 0.02 0.00 0.77 0.57 0.66 0.48 0.50 0.76 0.51 0.61 0.55 0.56
tions made by the model, is expressed mathematically
as:
Precision =
True Positives
True Positives + False Positives
(1)
It indicates the proportion of correctly predicted
positive instances out of all instances predicted as
positive. Higher precision values suggest fewer false
positive predictions, reflecting the model’s ability to
avoid misclassification. Recall, also known as sen-
sitivity or true positive rate, measures the proportion
of actual positive instances correctly identified by the
model, calculated as:
Recall =
True Positives
True Positives + False Negatives
(2)
Higher recall values indicate the model’s effec-
tiveness in capturing most positive instances while
minimizing false negative predictions. The F1-score,
which is the harmonic mean of precision and recall,
provides a single metric that balances both concerns,
calculated as:
F1-Score = 2 ·
Precision · Recall
Precision + Recall
(3)
A higher F1-score indicates a good balance be-
tween precision and recall, offering a more compre-
hensive measure of the model’s performance.
In addition to precision, recall, and F1-score, we
also calculate the Matthews Correlation Coefficient
(MCC) and Cohen’s Kappa to provide a more com-
prehensive evaluation of the models’ performance.
These metrics help account for class imbalance and
offer insights into the models’ classification reliabil-
ity.
The Matthews Correlation Coefficient (MCC)
is a robust metric for binary classification, especially
with imbalanced datasets. It is defined as:
MCC =
T P · T N − FP · FN
p
(T P + FP)(T P + FN)(T N + FP)(T N + FN)
(4)
where T P, T N, FP, and FN represent true pos-
itives, true negatives, false positives, and false nega-
tives, respectively. MCC values range from -1 (total
disagreement) to +1 (perfect prediction), with 0 indi-
cating no better performance than random chance.
The Cohen’s Kappa (κ) statistic measures the
agreement between predicted and actual classifica-
tions, adjusting for chance agreement:
κ =
p
o
− p
e
1 − p
e
(5)
where p
o
is the observed agreement, and p
e
is
the expected agreement by chance. Cohen’s Kappa
ranges from -1 (no agreement) to +1 (perfect agree-
ment).
These metrics are computed for each
model—Original, Fine-Tuned (FT), and YOLO8l-
cls—on both Low-Stressed (LS) and High-Stressed
(HS) classes. Results are detailed in Table 1 for
comparative evaluation.
4 RESULTS AND DISCUSSION
Table 1 provides an overview of the performance met-
rics obtained from the cross-validation experiments
for sow stress classification. It details these met-
rics for each model—Original, Fine-tuned (FT), and
YOLO8l-cls—across the stress classes: Low-Stressed
(LS) and High-Stressed (HS). The table includes ad-
ditional metrics such as Matthews Correlation Coef-
ficient (MCC) and Cohen’s Kappa, providing a more
comprehensive evaluation of model performance.
Our dataset consists of 900 images from six sows
(three LS and three HS). These images are divided
into three folds, with 150 carefully selected images
from each sow, ensuring that each fold contains data
from one LS and one HS sow. The original model,
pretrained on the dataset used in (Hansen et al., 2021),
was tested on all three folds to evaluate its generaliza-
tion capabilities across the entire dataset. In contrast,
the fine-tuned (FT) and YOLO8l models were fine-
tuned on two folds and tested on the remaining fold
to assess their performance after transfer learning on
a subset of the data. This approach allows for a more
targeted evaluation of the models’ ability to adapt and
improve performance on specific stress indicators in
the dry sow house environment.
Figure 3 presents the confusion matrices for the
three models. The original model, shown in Figure
3a, struggles to classify LS sows accurately, misclas-
sifying 420 out of 450 LS sows as HS. This poor per-
Deep Learning-Based Classification of Stress in Sows Using Facial Images
393
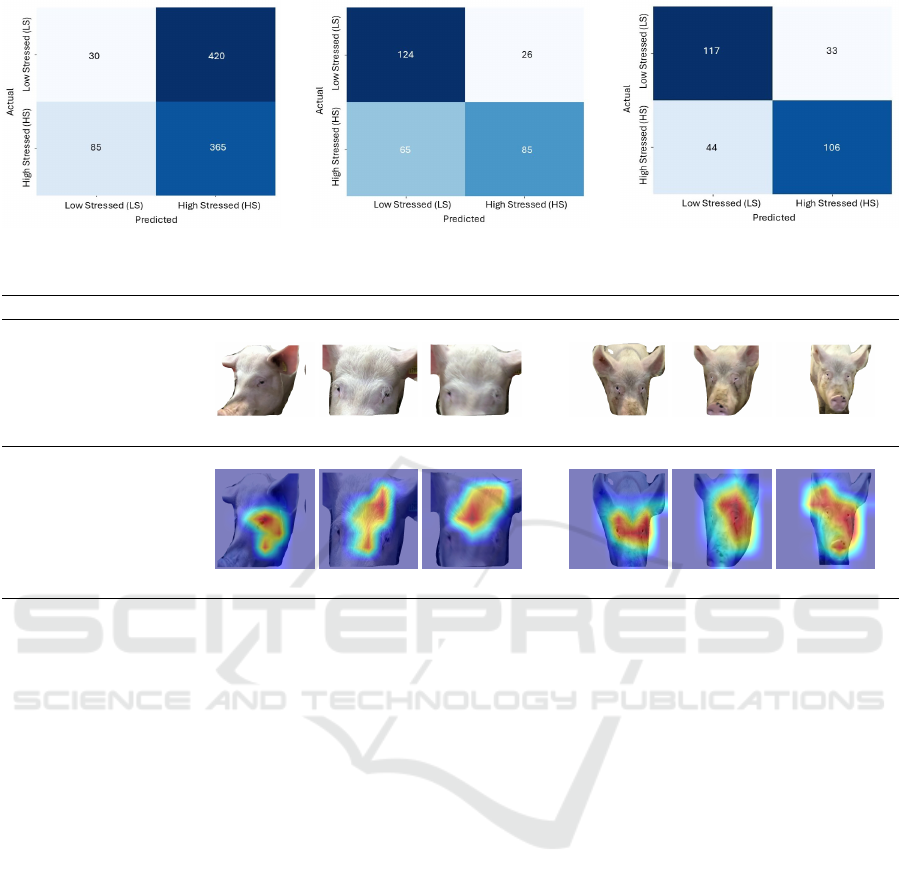
(a) Original model. (b) FT model. (c) YOLO8l-cls model.
Figure 3: Results for Sow Stress Classification with Original, Fine-tuned (FT), and YOLO8l-cls Models.
Low-stressed (LS) High-stressed (HS)
Segmented Images
Grad-CAM Images
Figure 4: Grad-CAM visualizations of Low-Stressed (LS) and High-Stressed (HS) category sows using YOLO8l-cls model
with segmented input images.
formance is reflected in Table 1, where LS class met-
rics are low (Precision: 0.26, Recall: 0.07, F1-Score:
0.11). The Cohen’s Kappa of -0.10 and MCC of -0.20
further indicate weak agreement between predictions
and ground truth, suggesting a significant bias toward
the HS class.
The FT model, shown in Figure 3b, improves sig-
nificantly, classifying 124 out of 150 LS sows cor-
rectly. This improvement is reflected in the increased
precision (0.66), recall (0.83), and F1-Score (0.74) for
the LS class. The MCC and Kappa values of 0.52 and
0.54, respectively, also indicate a more balanced clas-
sification performance.
The YOLO8l-cls model, shown in Figure 3c,
demonstrates the best overall performance, achieving
a balanced classification across stress classes. It cor-
rectly identifies 117 out of 150 LS sows and 106 out
of 150 HS sows. The performance metrics are the
highest among the models tested, with LS precision,
recall, and F1-score of 0.73, 0.78, and 0.75, respec-
tively, and HS values of 0.76, 0.51, and 0.61. MCC
and Kappa values of 0.60 and 0.63 further support the
model’s reliability in predicting both stress categories
more accurately.
The inclusion of MCC and Cohen’s Kappa pro-
vides deeper insights into the models’ abilities to bal-
ance precision and recall across classes. MCC val-
ues near zero or negative indicate poor agreement
with ground truth, as seen in the original model’s per-
formance. The FT and YOLO8l-cls models, how-
ever, show positive MCC and Kappa values, reflecting
better agreement and a reduced bias between stress
classes.
Overall, the YOLO8l-cls model outperforms both
the original and FT models, achieving the highest F1-
Score (0.74) and the strongest Kappa (0.63). The
Grad-CAM visualizations in Figure 4 further confirm
the model’s effectiveness in identifying stress-related
regions in sow faces, highlighting key regions around
the eyes and forehead. This comprehensive analysis
emphasizes the importance of incorporating metrics
like MCC and Cohen’s Kappa in model evaluations
for more accurate and balanced performance assess-
ments.
5 CONCLUSIONS
This study investigated the use of deep learning (DL)
models, particularly the YOLO8l-cls model, to clas-
BIOIMAGING 2025 - 12th International Conference on Bioimaging
394

sify stress levels in sows based on facial features in
a realistic farming environment, aiming to improve
animal welfare and reduce antimicrobial resistance
(AMR) risks in pig farming. The results showed
that the original pretrained model struggled to identify
low-stressed (LS) sows in a real-world scenario due to
its inability to capture subtle stress indicators, while
fine-tuning improved performance. The YOLO8l-cls
model exhibited the highest overall performance, with
an F1-score of 0.74, Cohen’s Kappa of 0.63, and
MCC of 0.60, indicating stronger agreement and bet-
ter generalization across both LS and high-stressed
(HS) categories. Its ability to balance precision and
recall and accurately identify subtle stress markers in
the facial regions underscores its potential.
These findings highlight YOLO8l-cls as a practi-
cal tool for real-time monitoring of sow stress, en-
abling early intervention and improving health man-
agement in farming environments. The model’s abil-
ity to detect stress markers, particularly in facial re-
gions, demonstrates its relevance for enhancing an-
imal welfare and addressing AMR concerns. How-
ever, the relatively small number of sows in this study
limits the model’s generalizability. Future work will
focus on expanding the dataset, incorporating more
diverse stress conditions, and testing the model on
cross-generational data, including both parents and
offspring, to explore the potential heritability of stress
markers. Further research will also assess the model’s
scalability in larger farming environments to validate
its reliability and applicability across different setups.
ACKNOWLEDGEMENTS
The authors would like to acknowledge the finan-
cial support provided by the Joint Programming Ini-
tiative on Antimi-crobial Resistance (JPIAMR) for
the FARM-CARE project, ‘FARM interventions to
Control Antimicrobial ResistancE - Full Stage’ (ID:
7429446), and the Medical Research Council (MRC)
for funding the UK part of the project (MRC re-
search grant number: MR/W031264/1). This project
is part of a collaboration between the University of
the West of England, Scotland’s Rural College, Uni-
versity of Copenhagen, Teagasc, University Hospital
Bonn, Statens Serum Institut (SSI), and Porkcolombia
Association.
REFERENCES
Alpaydin, K., Ucar, Y. S., and Devrim, M. E. (2020). Deep
learning-based approaches for animal behavior analy-
sis: A review. Computers and Electronics in Agricul-
ture, 170.
Arjun, G. S. R. D. D., Mary, S. A., and Daniel, M. K. S. A.
(2020). Antibiotic use in agriculture and its impact on
antimicrobial resistance. Environmental Science and
Pollution Research, 27(6):6021–6031.
Arriaga, S. D. R. M., Doe, J., and Smith, A. (2021). Ma-
chine learning techniques for fish behavior analysis.
Aquaculture Reports, 20.
Bartolom
´
e, E., Puigdueta, I., Gu
`
ardia, M., Estevez, M., and
Gomis, J. (2004). Effect of chronic transportation
stress on welfare and meat quality of weaned piglets.
Meat Science, 67(2):337–342.
Broom, D. (2011). Assessing welfare based on biological
principles. Journal of Agricultural and Environmental
Ethics, 24(1):215–227.
Dwyer, D. M. M., Ison, S. C., and Lawrence, S. A. (2000).
The use of a food competition test to assess social
rank in pigs. Applied Animal Behaviour Science,
66(4):297–308.
Hansen, M. F., Baxter, E. M., Rutherford, K. M. D., Futro,
A., Smith, M. L., and Smith, L. N. (2021). Towards
facial expression recognition for on-farm welfare as-
sessment in pigs. Agriculture, 11(9):847.
He, K., Gkioxari, G., Doll
´
ar, P., and Girshick, R. (2017).
Mask r-cnn. In Proceedings of the IEEE International
Conference on Computer Vision (ICCV), pages 2961–
2969. IEEE.
Janssens, C. J., Helmond, F. A., and Wiegant, V. M. (1995).
The effect of chronic stress on plasma cortisol concen-
trations in cyclic female pigs depends on the time of
day. Domest. Anim. Endocrinol., 12(2):167–177.
Jong, I. C. D., Ekkel, E. D., Burgwal, J. A. V. D., Lambooij,
E., Korte, S. M., Ruis, M. A., Koolhaas, J. M., and
Blokhuis, H. J. (1998). Effects of strawbedding on
physiological responses to stressors and behavior in
growing pigs. Physiol. Behav., 64(3):303–310.
Liu, X., Wu, H., Chen, S., and Li, H. (2020). Automatic
recognition of stress in broiler chickens based on deep
learning. Sensors, 20(15):4251.
Manteca, X. and Alonso, D. (2000). Stress and meat quality
of pigs. Livestock Production Science, 65(2-3):239–
248.
Paszke, A., Gross, S., Massa, F., Lerer, A., Bradbury, J.,
Chanan, G., Killeen, T., Lin, Z., Gimelshein, N.,
Antiga, L., Desmaison, A., K
¨
op, A., Yang, E. Z., De-
Vito, Z., Raison, M., Tejani, A., Chilamkurthy, S.,
Steiner, B., Fang, L., Bai, J., and Chintala, S. (2019).
Pytorch: An imperative style, high-performance deep
learning library. CoRR, abs/1912.01703. [Online].
Available: http://arxiv.org/abs/1912.01703.
Ruijven, T. and Oliehoek, K. (2017). Prenatal stress and
(neuro)epigenetic programming: Consequences for
behavior and social development. Neuroscience &
Biobehavioral Reviews, 80:604–616.
Ultralytics (2024). YOLOv8 Classification. [Online]. Avail-
able: https://docs.ultralytics.com/tasks/classify/.
Wang, H., Wu, S., and Zhang, Y. (2020a). Facial expres-
sion recognition for pig welfare assessment: A deep
learning approach. Animals, 10(12):2261.
Deep Learning-Based Classification of Stress in Sows Using Facial Images
395

Wang, H., Zhang, S., and Li, T. (2020b). Facial expression
recognition for pig welfare assessment: A deep learn-
ing approach. Animals, 10(12):2261.
Wechsler, B. (2000). The use of physiological measure-
ments in the assessment of animal welfare. Animal
Welfare, 9(2):203–210.
Weinstock, M. (2008). The long-term effects of prenatal
stress on offspring. Current Directions in Psycholog-
ical Science, 17(5):308–313.
Yang, J., Chen, X., and Zhao, F. (2020). Deep learning for
identifying cattle behavior in dairy farms. Computers
and Electronics in Agriculture, 173:105453.
BIOIMAGING 2025 - 12th International Conference on Bioimaging
396
