
Understanding How to Use Open-Source Libraries for Differentially
Private Statistics on Energy Metering Time Series
Ana C. P. Paix
˜
ao
1
, Breno R. da Silva
2
, Rafael L. Silva
2
, Filipe H. Cardoso
2
and Alexandre Braga
2
1
Institute of Computing, University of Campinas (UNICAMP), Campinas, S
˜
ao Paulo, Brazil
2
CPQD – Centro de Pesquisa e Desenvolvimento, Campinas, S
˜
ao Paulo, Brazil
a272447@dac.unicamp.br, {brenos, rlsilva, filipehc, ambraga}@cpqd.com.br
Keywords:
Differential Privacy, Time Series, Energy Metering, Statistical Distinguishability, Utility Metric, Smart Grid.
Abstract:
Demand forecasting and dynamic pricing for renewable energy open markets may require heavy analytics
capabilities on fine-grained consumption data. With differential privacy, data aggregators in the energy sector
can compute statistics on metering information without accidentally leaking consumption patterns of specific
consumers over time. However, differential privacy is complex and hard to implement correctly. In this paper,
we propose a method for evaluating differential privacy libraries by their ability to produce private and useful
statistics on time series for energy consumption. The method was validated by applying it to three open
source libraries used to compute differentially private averages, counts, and sums on energy metering data.
The method was able to clearly distinguish between private (indistinguishable) and disclosed (distinguishable)
statistics. Our method and findings can help data scientists and privacy officers within the energy sector better
understand how open-source differential privacy libraries behave with time series for energy metering data.
1 INTRODUCTION
Historically, security concerns in energy generation
and distribution have been associated to availability
(e.g., detection, prevention, and reaction to disruption
events). As energy sector evolves and incorporates In-
formation and Communication Technologies (ICTs)
into its operations, cyber-threats and privacy viola-
tions have become serious issues. However, privacy
violations cannot be solely attributed to cyber-attacks
and vulnerability exploitation. On the contrary, per-
sonal information disclosure can occur during normal
use of systems, APIs and applications, when privacy
preserving technologies are absent in system design.
For instance, smart grid’s advanced metering in-
frastructures need to collect from smart meters de-
tailed energy consumption data for ordinary business
tasks such as dynamic pricing, billing, and demand
forecasting. These business tasks can pose signifi-
cant risk on consumer data and jeopardize customer
privacy. Moreover, in the case of a data leak from a
metering database, it would be possible to recognize
consumers’ life habits. A simple example is when
consumers are at home (high consumption) or away
from home (low consumption).
Differential privacy (Dwork, 2006) is a privacy
preserving technology that can protect consumer’s
privacy rights while allowing access to useful analyt-
ics. However, this technology is complex and hard to
implement correctly by non experts. Thus, ordinary
data scientists usually do not implement their own
proprietary solutions, preferring well-known imple-
mentations, possibly selected from a bunch of emer-
gent open-source solutions.
This paper proposes a method for evaluating dif-
ferential privacy libraries by their ability to produce
private (e.g., indistinguishable) and useful statistics
on time series for energy consumption. Core to the
method is the use of statistical tests and accuracy
metrics to evaluate statistical indistinguishability and
utility. Three open-source libraries were evaluated ac-
cording to the method for their ability to compute dif-
ferentially private averages, counts, and sums on syn-
thetic energy metering data. By applying our evalu-
ation method on actual differential privacy libraries,
we aim to better understand how these libraries be-
have with energy metering data.
The method was able to clearly distinguish be-
tween private (indistinguishable) and disclosed (dis-
tinguishable) statistics. Our results suggest that pri-
vate counts were distinguishable in most cases, while
averages and sums had larger safe margins. We found
that privacy cannot always be preserved when high
utility is needed, because subtle patterns in energy
Paixão, A. C. P., R. da Silva, B., Silva, R. L., Cardoso, F. H. and Braga, A.
Understanding How to Use Open-Source Libraries for Differentially Private Statistics on Energy Metering Time Series.
DOI: 10.5220/0013338500003944
Paper published under CC license (CC BY-NC-ND 4.0)
In Proceedings of the 10th International Conference on Internet of Things, Big Data and Security (IoTBDS 2025), pages 289-296
ISBN: 978-989-758-750-4; ISSN: 2184-4976
Proceedings Copyright © 2025 by SCITEPRESS – Science and Technology Publications, Lda.
289

consumption of particular consumers emerge from
small differences in consumption metering. There-
fore, privacy preserving technologies have narrow
ranges for privacy parameters when operating on me-
tering data that should be useful to data analytics,
while still preserving privacy.
The text is organized as follows. Section 2 dis-
cusses related work. Section 3 explains the evalua-
tion method. Section 4 shows the results. Section 5
discusses our findings. Section 6 concludes the text.
2 RELATED WORK
Differential privacy was proposed in 2006 in a series
of three papers (Dwork, 2006; Dwork et al., 2006b;
Dwork et al., 2006a). First, (Dwork, 2006) shows
that semantic security cannot be achieved with abso-
lute privacy and proposes differential privacy to cap-
ture the risk of data leaks for someone present in a
database subject to queries. (Dwork et al., 2006b) ex-
plains that privacy is protected when the true response
from a database query is perturbed by adding random
noise generated according to a carefully chosen dis-
tribution, and this response (with added noise), is re-
turned to the user. This way, privacy can be preserved
by calibrating noise’s standard deviation according to
information’s desired sensitivity. Last, (Dwork et al.,
2006a) explains that privacy can also be achieved by
perturbing the true response of a query by adding a
small amount of exponentially distributed noise.
Since its proposition, differential privacy has been
used, implemented, and evaluated in various appli-
cation scenarios. At the energy sector, consumption
patterns may reveal themselves in fine-grained mea-
surements collected for long time periods, jeopardiz-
ing consumer’s privacy. So, over the years, propri-
etary schemes for differential privacy have been used
in smart grids (Zhao et al., 2014; Peralta-Peterson and
Kotevska, 2021; Marks et al., 2021; Janghyun et al.,
2022) and time series (Leukam Lako et al., 2021; Ro-
man et al., 2021; Roman, 2023; McElroy et al., 2023;
Shaham et al., 2024) to preserve privacy.
Recently, open-source libraries for differential pri-
vacy (Gaboardi et al., 2020; OpenMined, 2020; Holo-
han et al., 2019; Berghel et al., 2022) started to be
evaluated for performance (Zhang et al., 2023), util-
ity (Garrido et al., 2021) and usability (Ngong et al.,
2023), while recent studies (Jin et al., 2022; Casacu-
berta et al., 2022) showed that virtually all differ-
ential privacy libraries suffer from well-known vul-
nerabilities in floating point precision and side chan-
nels (Mironov, 2012).
Government agencies published guidelines for
safe and secure parametrization of differential pri-
vacy implementations (Near et al., 2023) and harden-
ing guidelines for forecasting demand on electricity
grids (ENISA, 2023). Other recent work investigated
the use of statistical tests in attack methods (Ghosh
et al., 2024), introduced energy disaggregation risk
when appliance usage can be inferred from aggre-
gated energy data (Adewole and Torra, 2024), and
started to explore open-source tools with time series
for energy consumption (Paix
˜
ao et al., 2025).
As far as authors know, existing literature lacks in-
vestigations supported by statistical tests on how dif-
ferential privacy tools behave with energy metering
time series. Our work contributes to fulfill this gap.
3 METHODOLOGY
This section proposes a differential privacy evalua-
tion method addressing differential privacy libraries
applied on time series for energy metering data. The
method is supported by statistical distinguishabil-
ity tests and utility metrics. Before explaining the
method, this section briefly introduces differential pri-
vacy and indistinguishability concepts, as well as de-
tails a workflow for synthetic data generation.
3.1 Differential Privacy and
Indistinguishability
Differential privacy is a mathematical technique de-
signed to express the protection guarantee of an in-
dividual’s privacy in large datasets. It ensures, with
a certain degree of confidence, that adding or remov-
ing a single individual’s data from a dataset has mini-
mal impact on the overall result of a statistical query.
The privacy parameter or privacy budget, denoted by
Greek letter epsilon (ε), gives the amount of privacy
to be applied on a differentially private function. The
ε-differential privacy is given by the formula:
Pr[ f (D) ∈ S] ≤ e
ε
· Pr[ f (D
′
) ∈ S] (1)
Where:
• f (D) is the result of a query on database D;
• S is a set of possible outcomes for the query;
• D
′
is a neighbor database that differs from D by
only the records of one individual (usually, only
one record);
• and ε is the privacy parameter, a positive real num-
ber that controls the level of privacy.
By this formula, the probabilities of obtaining a
specific result from the same query on two neighbor
IoTBDS 2025 - 10th International Conference on Internet of Things, Big Data and Security
290

Figure 1: Workflow for synthetic data generation.
databases, that differ only by records of one individ-
ual, cannot be significantly different. A small ε value
indicates a stronger privacy guarantee, while a high ε
value means a weaker privacy guarantee.
In this context, indistinguishability is a property of
differentially private functions ensuring that an adver-
sary cannot determine whether a specific individual’s
data was included or not in a dataset by observing the
output of a private function. Examples of differen-
tially private functions are private statistical queries
for averages, counts, and sums offered by differen-
tial privacy libraries. The simplest way to produce
two neighbors databases (D and D
′
) is by removing
the measurements of one consumer from D, produc-
ing D
′
. Usually, adding a new consumer is more ex-
pensive than deleting one, and is meaningless to blind
distinguishability tests. We argue that distinguishabil-
ity between two private functions can be evaluated by
statistical tests like the Independent Samples T-Test.
This capability is central to our evaluation method.
3.2 Synthetic Data Generation
Open data from the Open Power System Data (Wiese
et al., 2019) was collected to generate synthetic
time series of residential energy consumption. The
adopted dataset includes data on solar energy gener-
ation and energy consumption of residences in the
southern regions of Germany. The measures were
collected from meter equipments and are cumulative
over time, having gaps in data acquisition that can
vary from a few minutes to entire days. Measures are
available in 1, 15, and 60-minute resolutions. In this
work, we adopted a dataset with 6 consumer units, a
resolution of 15 minutes, and format of 153810 rows
by 71 columns. Figure 1 shows the workflow to gen-
erate synthetic tabular data from collected time series.
First, the time series have been cleaned from er-
rors and misalignment in dates and times have been
corrected. Then, daily estimates were made and
the amount of energy consumption and export were
added separately. Next, data was augmented to give
rise to other consumer units and total of 99 units
were generated from real consumption data by mul-
tiplying the actual values by random numbers slightly
below one to respect low-voltage energy consump-
tion and generation. The same was done for the
sum of energy export. In the penultimate step, syn-
thetic data was generated from previously augmented
data using the probabilistic algorithm SingleTablePre-
set in FAST ML mode from the Synthetic Data Vault
(SDV) library. This implementation got an overall
score of 92.79%. Finally, the cumulative sum per day
was calculated, resulting in the synthetic tabular en-
ergy dataset adopted.
We computed statistics on synthetic dataset of one
hundred consumer units and a time series of 96 mea-
surements (one day in intervals of 15 minutes). Fig-
ure 2 shows an example of this time series with ac-
tual averages (blue line) and actual averages minus
the consumption of one consumer unit (yellow line).
The gap between these two lines is the energy con-
sumption of a missing consumer unit.
Figure 2 also shows randomized versions of actual
averages (green line) and actual averages minus one
consumer (red line) calculated by OpenDP (Gaboardi
et al., 2020) for privacy parameter ε = 0.5. Pres-
ence or absence of one consumer unit is easily dis-
tinguishable from actual values (green and red lines),
but should be indistinguishable in randomized lines
for differentially private averages. The challenge fac-
ing differential privacy libraries in energy metering
is to balance privacy and utility by finding the right
amount of noise added to a time series that preserves
consumer’s privacy, while allowing useful analytics.
3.3 Differential Privacy Evaluation
Method
This section describes our differential privacy eval-
uation method in three main activities: (i) statistics
computation, (ii) statistical distinguishability testing,
and (iii) utility metric analysis.
3.3.1 Statistics Computation
We computed differentially private averages, counts,
and sums for the synthetic dataset previously de-
scribed. Setup for privacy parameters (e.g., ε range,
sensitivity, and privacy budget composition) followed
NIST’s guidelines (Near et al., 2023). Values of ε
were selected from a range of 0.1 to 20, in increments
of 0.1 from 0.1 to 1.0 and in increments of 1 from
1.0 to 20. For counts, sensitivity is 1. For both av-
erages and sums, sensitivity equals the smallest inte-
ger greater than maximum measurement in time series
minus the smallest possible measurement (assumed to
be zero). We worked with the assumption that pri-
vacy budged obeyed parallel composition property,
because averages, counts, and sums from different
timestamps have no common measurements.
A loop repeated 20 times computations of private
statistics for each ε. First, we computed private aver-
ages, counts, and sums for all consumer units in 1-day
time series. Then, we repeated computations for the
Understanding How to Use Open-Source Libraries for Differentially Private Statistics on Energy Metering Time Series
291

Figure 2: Time series for average energy consumption.
same amount of consumer units minus (the consump-
tion of) one consumer, resulting in two averages, two
counts, and two sums, as follows. One average for all
consumer units and other for all minus the consump-
tion of one consumer unit. One private count for all
consumer units and other for total count minus one.
One private sum for all consumer units and other for
all minus the consumption of one consumer.
With these statistics computed, a simple visual
distinguishability test could be performed by visu-
ally inspecting charts looking for biases between plots
of two private statistics (averages, sums, or counts).
When bias is extreme, it is also easily visualized in
plots. However, visual inspection is not enough to
distinguish between two private statistics when bias
is subtle. Therefore, the next step in our method is
to determine for which values of ε the pairs of time
series for private averages, sums, and counts are sta-
tistically indistinguishable.
3.3.2 Statistical Distinguishability Test
In randomized experiments, the Independent Samples
T-Test (t-test) (Stoltzfus, 2015) assesses whether the
means of two independent groups are statistically dif-
ferent from each other. We argue that statistical tests
like t-tests can also be applied to differentially pri-
vate functions because a pair of samples obtained
from these functions are statistically independent; that
is, their randomization functions are independent and
follow a normal-like (e.g., Laplace or Gaussian) curve
with equal variance for the same ε. Thus, in this work,
we use the t-test to determine whether two private
functions are statistically different. If the difference
is statistically significant, then the two private func-
tions are distinguishable from each other and do not
preserve consumer’s privacy. Statistical difference is
denoted by t-value and computed by the formula:
t =
¯
X
1
−
¯
X
2
r
s
2
1
n
1
+
s
2
2
n
2
(2)
Where:
¯
X
1
and
¯
X
2
are the means of samples 1 and
2; s
2
1
and s
2
2
are variances of samples 1 and 2; n
1
and
n
2
are sizes of samples 1 and 2.
In t-tests, p-value is the probability of obtaining
a difference (e.g., a (t-value)) as large or larger than
the one observed, assuming the two samples are in-
distinguishable. We used Pyhton library scipy for
computing p-values and t-values.
In this evaluation method, the null hypothesis (H
0
,
believed true) is stated as follows: there is no signif-
icant statistical difference between two private statis-
tics computed on datasets that differ in just one con-
sumer unit and, therefore, the privacy of individual
consumers is preserved. The alternative hypothesis
(H
A
) is that there is a significant statistical differ-
ence between private statistics, computed on datasets
differing in one consumer unit, and that difference
makes them distinguishable from each other.
A p-value > 0.05 means that the observed sta-
tistical difference is quite likely to have occurred by
chance, even if H
0
is true. On the other hand, we
reject H
0
when (p-value) is within or below the statis-
tical significance interval of 0.05 and 0.01, meaning
that the observed difference is unlikely to have oc-
curred by chance if H
0
were true. Thus, H
0
is false,
privacy was not preserved, and the two statistics are
distinguishable. Next step in our method helps to de-
termine if indistinguishable statistics are useful.
3.3.3 Utility Metric Analysis
Accuracy metric Mean Squared Error (MSE) is used
for measuring the average squared difference between
randomized values and actual values. MSE has been
used before to measure utility of differential private
functions (Garrido et al., 2021). As MSE can be used
IoTBDS 2025 - 10th International Conference on Internet of Things, Big Data and Security
292
to assess the accuracy of time series predictions, it
can also be used to measure how distant differentially
private statistics are from actual measures. MSE is
given by the formula: MSE =
1
n
∑
n
i=1
(y
i
− ˆy
i
)
2
, where
n is number of data points, y
i
is actual value for the i
th
data point, ˆy
i
is predicted value for i
th
data point, and
∑
n
i=1
is sum from 1 to n.
In general, by minimizing MSE, one can improve
accuracy and utility. Therefore, a lower MSE means
that randomized values are closer to actual values,
which is generally desirable to improve utility, but
compromises privacy. A higher MSE, on the contrary,
suggests that randomized values are distant from ac-
tual values, indicating less accuracy and less utility,
but higher privacy.
4 LIBRARY EVALUATION
Three differential private libraries were evaluated on
their ability to generate private and useful statistics:
OpenDP (Gaboardi et al., 2020), DiffPrivLib (Holo-
han et al., 2019), and PyDP (OpenMined, 2020).
First, we analyze visual distinguishability as a prepa-
ration for next steps. Then, statistical distinguisha-
bility is evaluated with t-tests and utility is evaluated
with accuracy metric MSE.
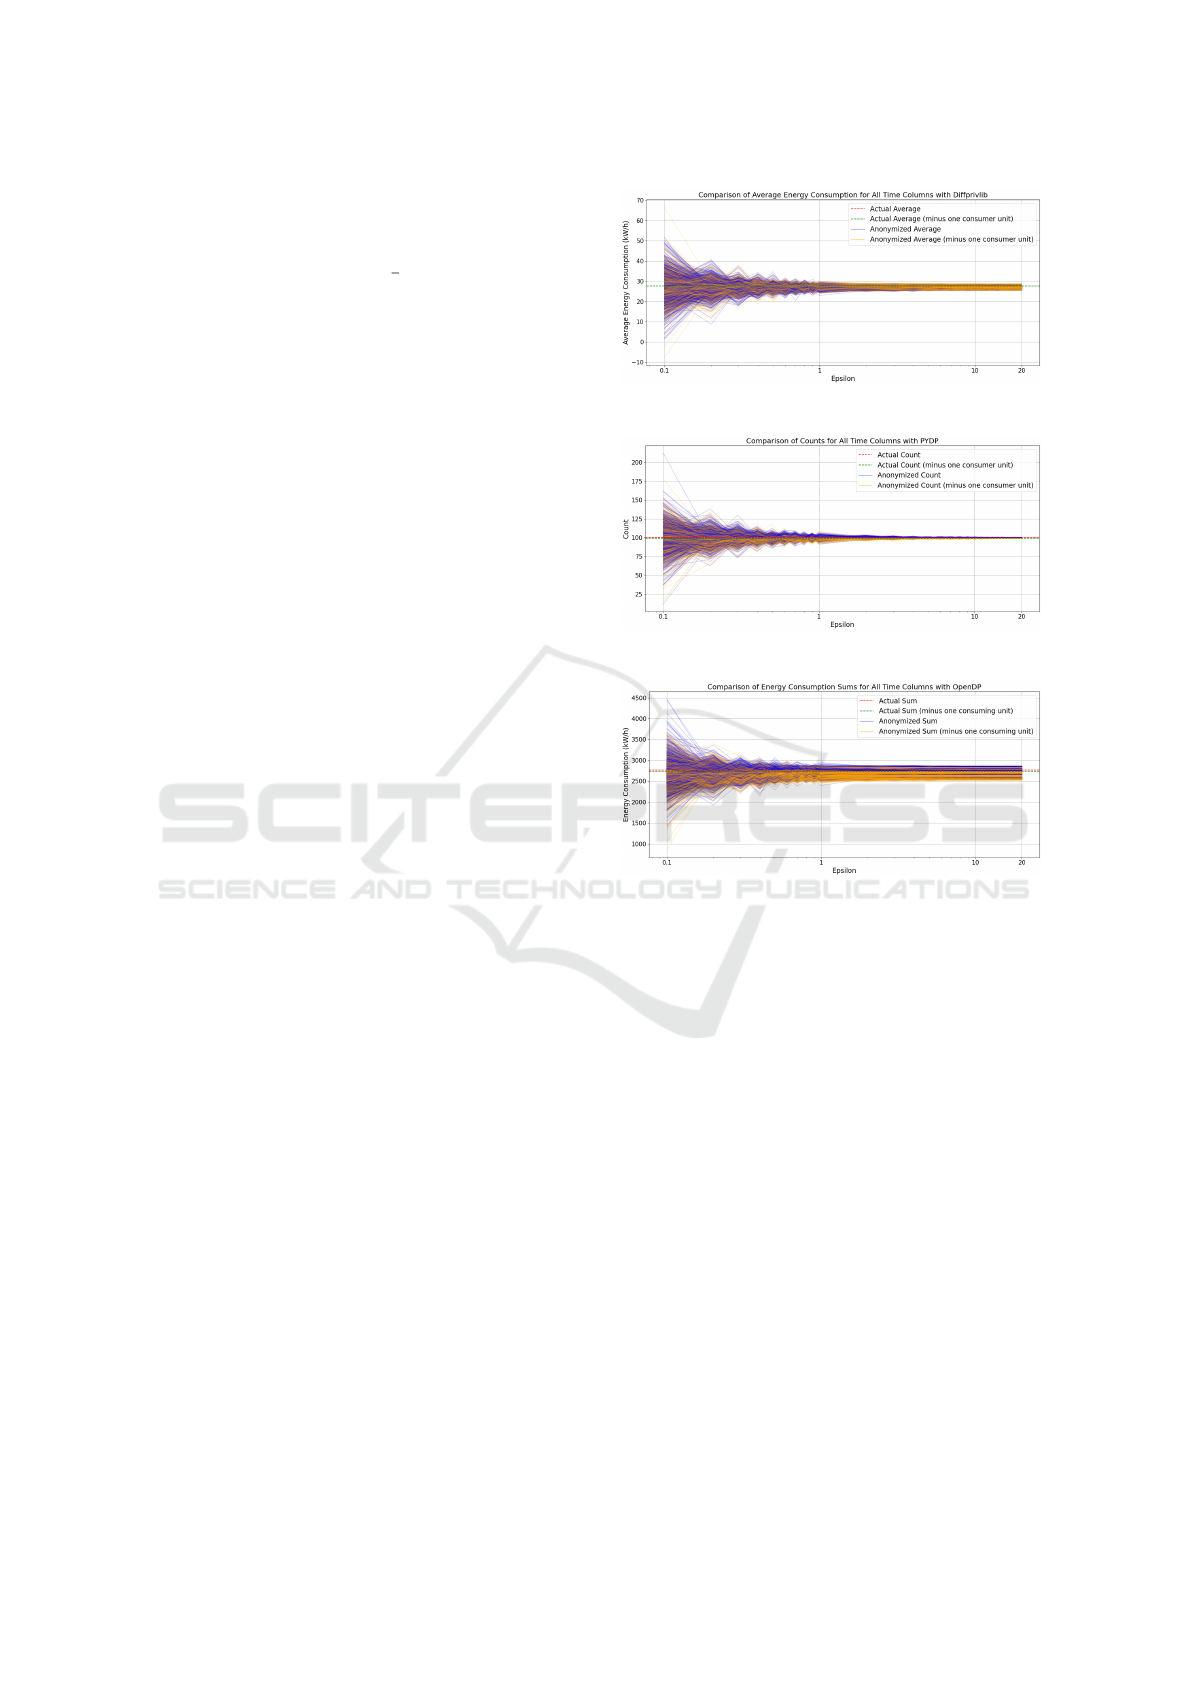
4.1 Visual Distinguishability
Figures 3, 4, and 5 show differentially private statis-
tics for varying ε. In all figures, a red dotted line
shows actual consumption statistics, while a green
dotted line shows actual statistic minus consumption
of one consumer. Blue line shows private statistic for
all consumers and yellow line is private statistics for
all consumers minus the consumption of one unit.
Figure 3 shows the variation of differentially pri-
vate averages with DiffPrivLib. Figure shows private
averages stay around actual averages. For small ε val-
ues (below 0.5), differentially private averages are not
visually distinguishable. For higher ε values, private
averages may not be visually distinguishable either.
PyDP and OpenDP showed similar patterns.
Figure 4 shows that differentially private counts
are around actual counts. For small ε values (be-
low 0.5), differentially private counts are barely dis-
tinguishable. However, for higher ε values, private
counts are easily distinguishable because they stay
close to actual values, resulting in a visual bias of blue
lines grouping above actual counts (red dotted line)
and yellow lines grouping below actual counts mi-
nus one (green dotted line). DiffPrivLib and OpenDP
showed similar patterns.
Figure 3: Visually indistinguishable private averages.
Figure 4: Visually distinguishable private counts.
Figure 5: Visually distinguishable private sums.
Figure 5 shows the variation of differentially pri-
vate sums with OpenDP. In this figure, it is possible to
distinguish the consumption of one consumer because
blue lines group above actual sums (red dotted line)
and yellow lines group below actual sums minus con-
sumption of one unit (green dotted line). DiffPrivLib
and PyDP showed similar distinguishable patterns.
4.2 Distinguishability Test
P-values from t-tests computed for a range of ε val-
ues were used for determining the value of ε above
which differences between two private statistics have
no statistical significance and, therefore, are distin-
guishable. Figures 6, 7, and 8 show p-values calcu-
lated on time series of differentially private statistics
for several ε values and evaluated libraries.
Figure 6 shows p-values for differentially private
averages are above statistical significance thresholds
(0.01 and 0.05), for ε ranging from 0.1 to 20, for all
three evaluated libraries, suggesting that private aver-
ages are indistinguishable in this interval.
Understanding How to Use Open-Source Libraries for Differentially Private Statistics on Energy Metering Time Series
293

Figure 6: P-values for differentially private averages.
Figure 7: P-values for differentially private counts.
Figure 8: P-values for differentially private sums.
Figure 7 shows p-values for differentially private
counts are small and below statistical significance
threshold of 0.05 for ε values ranging from 0.2 to
20 and all evaluated libraries, suggesting that private
counts are distinguishable in this interval. In fact, a
previous visual inspection was able to distinguish be-
tween private counts in this interval. Figure 8 shows
that p-values for private sums are all below statisti-
cal significance threshold of 0.05 for ε values rang-
ing from 0.5 to 20, suggesting private sums are dis-
tinguishable in this interval, as shown by a previous
visual inspection.
4.3 Utility Metrics
Utility metric MSE helped to determine whether pri-
vate statistics are useful, despite being distinguishable
or not. Figures 9, 10, and 11 show MSE metric cal-
culated on time series of differentially private statis-
tics, for several values of ε, for each evaluated library.
Figure 9: MSE metric for differentially private averages.
Figure 10: MSE metric for differentially private counts.
Figure 11: MSE metric for differentially private sums.
In these charts, Y axes have different scales because
MSE metric has the same measurement unit and mag-
nitude order of actual data.
For differentially private averages, Figure 9 shows
that OpenDP starts with lower MSE, meaning low
privacy and high utility, while both DiffPrivLib and
PyDP start with higher MSEs for ε = 0.1, but fall
very early (at ε = 0.2) to small MSEs. In case of pri-
vate counts, Figure 10 shows that all libraries start
with high MSEs for ε = 0.1 and fall shortly to an
MSE around 1.0 when ε approaches 1.0. For private
sums, Figure 11 shows that libraries start with high
MSEs for ε = 0.1 and fall shortly to a very small MSE
(around 1.0) when ε approaches 1.0.
5 DISCUSSION
Consumption habits tend to be similar among con-
sumer units at the same neighborhood. These similar
IoTBDS 2025 - 10th International Conference on Internet of Things, Big Data and Security
294

habits lead to similar routines that influence the shape
of consumption time series. On the other hand, sub-
tle patterns in energy consumption of particular con-
sumers emerge from small differences in consump-
tion metering that may not be hidden by differential
privacy when high utility is required.
The feasibility of our differential privacy evalua-
tion method depends upon energy companies acting
as metering aggregators for data queries. In fact, the
adoption of global differential privacy by metering
aggregators, instead of local differential privacy, is
central to the proposed approach. Global differential
privacy focuses on protecting the privacy of a dataset
as a whole. It involves the role of a data aggregator
which adds noise to the output of a query or function,
rather than to the output of individual smart meters.
Local differential privacy, on the contrary, focuses on
protecting individual measures from smart meters at
the moment of (or just after) data collection, adding
noise to individual data before it’s shared.
When generating synthetic data, SingleTablePre-
set and Copula GAN probabilistic algorithms yielded
similar results when using the same distribution.
However, the SingleTablePreset algorithm was cho-
sen due to its faster processing time and ease of use.
It is configured with a normal distribution by default
and does not offer customization options.
Differential privacy is like cryptography in the
sense that it is error prone and hard to use correctly.
Data scientists are better served by well-known li-
braries of good reputation. However, there is no one-
size-fits-all solution and evaluated libraries are emer-
gent, having their own issues with parameter setup
and consumption pattern disclosure. For instance,
floating point vulnerabilities may restrict the use of
high ε values, because there may not be enough dif-
ference in two close noise samples represented as
floating-point numbers used by these libraries.
Dataset size influences the behavior of differen-
tially private functions. We call indistinguishability
threshold that ε value defining the border between in-
distinguishable and distinguishable statistics. A larger
dataset would be able to push the indistinguishability
threshold to other ε values. Thus, indistinguishabil-
ity thresholds found in this study are relative to the
dataset in analysis and can not be taken as absolute
values valid in all cases. Also, we adopted Indepen-
dent Samples T-Test as distinguishability test. This
is not mandatory, because t-test is recommended for
small datasets, and other statistical tests can be used
instead for larger datasets. For instance, the Two Sam-
ple Z-Test can be more appropriate for larger datasets.
Differential privacy libraries respond differently
to different statistics. In case of distinguishability
evaluation and synthetic dataset, private averages re-
sults suggest that evaluated libraries can be safely
used within a wide range (ε values from 0.1 to 20). In
case of private counts, however, results showed that
the safe margin for ε is narrower (values smaller than
0.1) to preserve privacy. Differentially private sums
can be safely used within a range of ε values smaller
than the range for averages (from 0.1 to 0.5). Because
we work with statistical tests and random noise, there
is always a chance of a false negative (Type II) error.
Regarding MSE utility metric, for both private av-
erages and private sums, we saw that OpenDP im-
proves its utility faster than PyDP and DiffPrivLib.
All three libraries showed similar utility for ε greater
than 1.0. In case of private counts, evaluated libraries
are quite similar in utility. They all started with high
MSEs at ε = 0.1 and consistently decreased MSE val-
ues (improving utility) up to ε = 1.0, above which
they showed similar utility. Utility threshold is the
value of ε above which MSE curve becomes flat.
Finally, if our evaluation method were used to
rank differential privacy libraries by prioritizing dis-
tinguishability, a ranked list could be obtained with
the following criteria. First, the larger ε ranges
for which statistics are indistinguishable. Second,
the higher indistinguishability threshold. Third, the
smallest utility threshold. By these criteria, Diff-
PrivLib would occupy the first place in a ranked
list, not only because it has larger indistinguishable
ranges, but also because it has the higher indistin-
guishability thresholds. PyDP would stay in second
place for its indistinguishability threshold. OpenDP
would be in third for its smallest utility threshold.
6 CONCLUSION
This paper investigates the effect of differential pri-
vacy on time series of energy consumption. We pro-
pose a privacy evaluation method based upon statis-
tical distinguishability tests and utility analysis. We
validated our method by applying it on open-source
libraries and synthetic data. We found that private
counts were distinguishable, even when ε was small,
while averages and sums had larger safe margins.
This work contributes to better understand how
differential privacy tools behave when applied to time
series of energy metering data. Future work can
evaluate other libraries and statistics (e.g., variance,
histogram). Also, the impact of longer time series
(of weeks or months) on privacy budget composi-
tion needs further investigation. Finally, the proposed
evaluation method can support a comprehensive tool
benchmarking methodology on actual datasets.
Understanding How to Use Open-Source Libraries for Differentially Private Statistics on Energy Metering Time Series
295

ACKNOWLEDGEMENTS
Authors thank MCTI, ANEEL, CESP and Auren for
financial support (Project CTP - 1283 - Plataforma
Tecnol
´
ogica para Digitalizac¸
˜
ao da Portabilidade e
Agregac¸
˜
ao da Medic¸
˜
ao no Ambiente Varejista de En-
ergia) and research grant 03b1629f-e9d9-40bb-bc95-
89d7362e28c2.
REFERENCES
Adewole, K. S. and Torra, V. (2024). Energy disaggregation
risk resilience through microaggregation and discrete
fourier transform. Information Sciences, 662:120211.
Berghel, S., Bohannon, P., Desfontaines, D., Estes, C.,
Haney, S., Hartman, L., Hay, M., Machanavajjhala,
A., Magerlein, T., Miklau, G., Pai, A., Sexton, W., and
Shrestha, R. (2022). Tumult analytics: a robust, easy-
to-use, scalable, and expressive framework for differ-
ential privacy. arXiv preprint arXiv:2212.04133.
Casacuberta, S., Shoemate, M., Vadhan, S., and Wagaman,
C. (2022). Widespread underestimation of sensitivity
in differentially private libraries and how to fix it.
Dwork, C. (2006). Differential privacy. pages 1–12.
Dwork, C., Kenthapadi, K., McSherry, F., Mironov, I., and
Naor, M. (2006a). Our data, ourselves: Privacy via
distributed noise generation. pages 486–503.
Dwork, C., McSherry, F., Nissim, K., and Smith, A.
(2006b). Calibrating noise to sensitivity in private data
analysis. pages 265–284.
ENISA (2023). Cybersecurity and privacy in ai – fore-
casting demand on electricity grids. Technical report.
ENISA.
Gaboardi, M., Hay, M., and Vadhan, S. (2020). A program-
ming framework for opendp. Manuscript, May.
Garrido, G. M., Near, J., Muhammad, A., He, W., Matzutt,
R., and Matthes, F. (2021). Do i get the privacy i need?
benchmarking utility in differential privacy libraries.
arXiv preprint arXiv:2109.10789.
Ghosh, S., Alam, M., Dey, S., and Mukhopadhyay, D.
(2024). “hello? is there anybody in there?” leak-
age assessment of differential privacy mechanisms
in smart metering infrastructure. In P
¨
opper, C.
and Batina, L., editors, Applied Cryptography and
Network Security, pages 163–189. Springer Nature
Switzerland.
Holohan, N., Braghin, S., Aonghusa, P. M., and Levacher,
K. (2019). Diffprivlib: the ibm differential privacy
library. ArXiv e-prints, 1907.02444 [cs.CR].
Janghyun, K., Barry, H., Tianzhen, H., et al. (2022). A
review of preserving privacy in data collected from
buildings with differential privacy. Journal of Build-
ing Engineering, 56:104724.
Jin, J., McMurtry, E., Rubinstein, B. I. P., and Ohrimenko,
O. (2022). Are we there yet? timing and floating-point
attacks on differential privacy systems. In IEEE Symp.
on Security and Privacy (SP), pages 473–488.
Leukam Lako, F., Lajoie-Mazenc, P., and Laurent, M.
(2021). Privacy-preserving publication of time-series
data in smart grid. Security and Communication Net-
works, 2021(1):6643566.
Marks, J., Montano, B., Chong, J., Raavi, M., Islam, R.,
Cerny, T., and Shin, D. (2021). Differential privacy
applied to smart meters: A mapping study. pages 761–
770. Association for Computing Machinery.
McElroy, T., Roy, A., and Hore, G. (2023). Flip: a utility
preserving privacy mechanism for time series. Journal
of Machine Learning Research, 24(111):1–29.
Mironov, I. (2012). On significance of the least signifi-
cant bits for differential privacy. In Proceedings of
the 2012 ACM conference on Computer and commu-
nications security, pages 650–661.
Near, J. P., Darais, D., Lefkovitz, N., Howarth, G., et al.
(2023). Guidelines for evaluating differential privacy
guarantees (nist sp 800-226). Technical report, Na-
tional Institute of Standards and Technology.
Ngong, I. C., Stenger, B., Near, J. P., and Feng, Y.
(2023). Evaluating the usability of differential pri-
vacy tools with data practitioners. arXiv preprint
arXiv:2309.13506.
OpenMined (2020). Pydp: The python differential privacy
library. https://github.com/OpenMined/PyDP. Ac-
cessed: 2024-08-07.
Paix
˜
ao, A. C. P., Camargo, G. F. L., and Braga, A. M.
(2025). Testing open-source libraries for private
counts and averages on energy metering time series.
20th European Dependable Computing Conference.
Peralta-Peterson, M. and Kotevska, O. (2021). Effective-
ness of privacy techniques in smart metering systems.
pages 675–678.
Roman, A.-S. (2023). Evaluating the privacy and utility of
time-series data perturbation algorithms. Mathemat-
ics, 11(5):1260.
Roman, A.-S., Genge, B., Duka, A.-V., and Haller, P.
(2021). Privacy-preserving tampering detection in au-
tomotive systems. Electronics, 10(24):3161.
Shaham, S., Ghinita, G., Krishnamachari, B., and Shahabi,
C. (2024). Differentially private publication of elec-
tricity time series data in smart grids. arXiv preprint
arXiv:2408.16017.
Stoltzfus, J. C. (2015). Student’s t-test for independent sam-
ples. Int’l Journal of Academic Medicine, 1:27–28.
Wiese, F., Schlecht, I., Bunke, W.-D., Gerbaulet, C., Hirth,
L., Jahn, M., Kunz, F., Lorenz, C., M
¨
uhlenpfordt, J.,
Reimann, J., et al. (2019). Open power system data–
frictionless data for electricity system modelling. Ap-
plied Energy, 236:401–409.
Zhang, S., Hagermalm, A., Slavnic, S., Schiller, E. M., and
Almgren, M. (2023). Evaluation of open-source tools
for differential privacy. Sensors, 23(14).
Zhao, J., Jung, T., Wang, Y., and Li, X. (2014). Achiev-
ing differential privacy of data disclosure in the smart
grid. pages 504–512.
IoTBDS 2025 - 10th International Conference on Internet of Things, Big Data and Security
296
