
A Novel Approach to Modelling Multi-Channel and Multi-Phase
Signals on an Angular Coordinate Axis (Semani)
Selma Ozaydin
a
Independent Researcher, Ankara, Turkey
Keywords: Digital Signal Processing, Multi-Channel Signals, Angular Coordinate Axis, Signal Analysis, Pattern Design,
Semani.
Abstract: This study introduces a new digital signal processing method that holistically plots digital signal vectors
collected from multiple channels on an angular graphic axis and aims to obtain a holistic signal matrix in the
specified angular range using a vector interpolation technique. The proposed method, Semani, enables the
visualization, improvement, and analysis of signal parameters based on phase angles and independent
variables using an angular coordinate axis. In the Semani method, multi-channel signals are visualized on a
single graph by plotting them on a coordinate axis encompassing all angular directions. This approach divides
the angular coordinate axis into sections based on its resolution level of angles (segments) and the rate of
change of independent variables (layers) within the analysis window. A graphic pattern (polar, cartesian,
cylinder, sphere, etc.) determined on the angular axis is divided into slices according to segments and layers,
and the signal is plotted in these sections. The proposed signal plotting and analysis model enables holistic
modeling of multi-channel signals collected from different angular directions on a coordinate axis.
Additionally, the vector interpolation method used in this model calculates signal vectors for unknown angular
directions, enriching the signal. This innovative method allows signals collected from multiple channels, such
as EEG, ECG, radar, sonar, and seismic signals, to be effectively visualized on a single graph against their
corresponding independent variables (e.g., time, frequency, distance).
1 INTRODUCTION
A signal is generally defined as a function
representing the mathematical relationship between
at least one independent variable and a dependent
variable that varies over time, carrying information
about the state of a physical change. Signals can be
categorized into two groups: analog signals and
digital signals. Digital signals are composed of data
representing time-dependent variations, derived from
analog measurements converted into digital values,
obtained or generated from various data sources, or
produced via mathematical functions or computer
simulations. The characteristic features of digital
signals, such as amplitude, frequency, wavelength,
and phase, are derived through various mathematical
operations and are used to define a signal's
characteristics. Consequently, digital signals consist
of numerical sets representing signal samples stored
a
https://orcid.org/0000-0002-4613-9441
in vector sequences, matrix arrays, higher-
dimensional arrays, or other structured data formats.
Multi-phase signals are composed of multiple
sinusoidal components with defined phase angles,
typically sharing the same frequency. These signals
can originate from a single channel or be aggregated
from various channels. Examples include
communication networks, radar, sonar, antenna
systems, and biomedical signals such as EEG, EMG,
and ECG. A major challenge in multi-phase signal
processing systems is designing advanced algorithms
and frameworks that can efficiently handle the
increased complexity, inter-channel interference, and
synchronization issues while meeting the demands
for higher data rates, ultra-low latency, and enhanced
scalability in next-generation networks like 6G. (She
vd., 2021) (Long vd., 2021).
The Semani technique can represent a multi-
channel/multi-phase signal as a single unified signal
on a graph. A literature review highlights a lack of
1028
Ozaydin, S.
A Novel Approach to Modelling Multi-Channel and Multi-Phase Signals on an Angular Coordinate Axis (Semani).
DOI: 10.5220/0013340800003911
Paper published under CC license (CC BY-NC-ND 4.0)
In Proceedings of the 18th International Joint Conference on Biomedical Engineering Systems and Technologies (BIOSTEC 2025) - Volume 1, pages 1028-1037
ISBN: 978-989-758-731-3; ISSN: 2184-4305
Proceedings Copyright © 2025 by SCITEPRESS – Science and Technology Publications, Lda.

systems that model digital signal variations
concerning independent variables and phase angles or
visualize sinusoidal components—such as
fundamental frequencies, harmonics, and phase
angles—on a unified graph. Conventional spectral
analysis methods divide data into separate graphs,
complicating the observation of relationships
between frequencies and harmonics. This challenge
intensifies with an increasing number of sinusoidal
components.
Multiple components or phase differences can
exist in multi-channel, multi-phase signals, with each
element typically conveying distinct information.
These signals are encountered in various applications,
including imaging and audio processing, recordings
made with multiple microphones, and biomedical
signals such as brainwaves (EEG) (Kamble &
Sengupta, 2023; Mazlan vd., 2024), cardiac rhythms
(ECG) (Ruan vd., 2022) and myoelectric signals
(EMG) (Rodriguez-Tapia vd., 2020). They are also
relevant in fields like seismic signal analysis (Yin vd.,
2022), telecommunications, and radio frequencies,
where signals are received from multiple antennas or
channels. Despite their importance, the integration of
multi-channel signals remains an unresolved
challenge, and predictions about the signal source
often rely on diverse signal processing techniques.
Among the approaches discussed in the literature,
beamforming is a prominent method used to combine
signals from multiple channels, isolating and
amplifying those originating from a specific source or
direction (Ramírez-Espinosa vd., 2024). This is
achieved by either applying fixed weights to each
channel (linear beamforming) or dynamically
adjusting weights based on channel conditions
(adaptive beamforming). Another widely used
technique is principal component analysis (PCA),
which extracts key components with the highest
variance from multi-channel data, summarizing the
information into a single representative signal (R.
Martin, 2023). Independent component analysis
(ICA) is similarly employed, focusing on separating
independent sources from mixed signals to create a
unified signal form (Melinda vd., 2023). Time-
frequency analysis, including methods such as short-
time Fourier transform (STFT) and wavelet
transform, is used to analyze signals across various
time and frequency domains, facilitating the
combination of these components into a single signal
(Kumar vd., 2021). Additionally, the Hilbert
transform provides valuable insights into the phase
information of a signal by deriving its analytical form,
while neural networks and machine learning
techniques can learn important features from multi-
channel data and integrate them into a single
representation (Engels vd., 2021) (Neupane & Seok,
2020) (Kazemi Lichaee vd., 2024). In
communication systems, signal modulation and
demodulation techniques, such as phase modulation
(PM) or phase shift keying (PSK), play a critical role
in integrating signals transmitted via different
channels by analyzing their phase components.
Despite these advancements, no existing method in
the literature directly models multi-phase signals into
a unified form without intermediate signal analysis,
highlighting the ongoing complexity and challenges
in this field (Pham vd., 2021) (Wei vd., 2023).
Physical changes, represented as signals, are
inherently independent of coordinate systems.
However, mapping them to coordinate axes, as in
current systems, introduces dependencies that distort
their visualization, especially for complex changes.
Semani resolves this by decoupling signals from
coordinate dependencies, allowing flexible graphical
representations. For multi-channel signals, existing
methods analyze vector behaviors for different phase
angles separately, combining results to reconstruct
the original signal. No system predicts intermediate
signal behaviors or unifies these analyses into a single
graphical model, further limiting comprehensive
signal evaluation. Semani addresses these challenges
by providing a novel approach to signal modeling and
analysis. It enables the visualization of multi-
channel/multi-phase signals and their associated
parameters in a unified graphical representation,
significantly simplifying the observation of
relationships between signal components. Moreover,
it uses an interpolation-based technique for
estimating intermediate signal vectors between two
known signal vectors with a specific phase angle,
facilitating more comprehensive signal modeling and
analysis.
The biggest difference between the graphs drawn
on the existing angular coordinate axis definitions and
the proposed method is that in existing methods, one
of the angular axis parameters generally represents
angles and the other represents signal amplitudes. In
the Semani method, one of the axis parameters
represents the angles and the other represents the
independent variables of the signal vectors, and the
signal vectors in each angular direction are
represented over these independent variables.
In the Semani method, when frequency values are
selected as independent variables and signal power
values as amplitude, the energy, frequency, and
vibrations of multi-directional signals —
recommended by the great scientist Nikola Tesla—
can be visualized on a single graph. (Martin, 2022).
A Novel Approach to Modelling Multi-Channel and Multi-Phase Signals on an Angular Coordinate Axis (Semani)
1029

2 MAIN SCOPE OF THE STUDY
The primary aim of this study is to develop a
comprehensive system model capable of analyzing
and modeling any input signal in angular coordinates
across independent variables, such as time and
frequency. To achieve this, input signals are
categorized into two groups: Sinyal1, representing
monophasic signals with uniform behavior across all
angular directions (e.g., time domain audio signals),
and Sinyal2, encompassing multiphasic signals that
exhibit varying characteristics across different
angular directions (e.g., biomedical, seismic, or
antenna radiation signals).
Semani enables the analysis of both Sinyal1 and
Sinyal2 signals by segmenting them into short-time
analysis windows and mapping their behavior
graphically in angular coordinates.
For Sinyal2 signals, the method uses a vector
interpolation method to derive signal vectors for
unmeasured angular directions, creating a signal
matrix that allows comprehensive angular modeling.
The Semani method provides a graphical
representation of signal vectors in different angular
directions and enables the enrichment of the input
signal by deriving signal vectors in unmeasured
directions using the interpolation method. This
approach allows for detailed time-domain analysis or
frequency-domain analysis using standard spectrum
analysis methods (e.g., Fourier Transform) enabling
visualization of key spectral features, such as
fundamental frequencies and harmonics, within an
octave-based frequency band structure.
Semani further introduces the ability to map
signal parameters (e.g., frequency, amplitude, phase
angle) using color palettes, enabling an intuitive
visual representation of numerical values.
Additionally, it supports 2D and 3D modeling in
cylindrical and spherical coordinates, enhancing the
analysis of signal behavior in multidimensional
spaces.
A key application of this system lies in separating
signal and noise components by correlating signal
characteristics with angular coordinates, which is
particularly beneficial for noise analysis in multi-
directional signals like seismic or biomedical data.
This system aims to simplify and enhance the
visualization and interpretation of signal properties
across angular and independent variable domains,
contributing significantly to advancements in signal
analysis and modeling techniques.
2.1 Advantages of the Semani Method
Semani offers significant advancements in signal
modeling and analysis by addressing the limitations
of existing techniques and introducing novel benefits.
It enables comprehensive modeling of digital signals
on graphical axes with layers and segments, capturing
detailed variations in multi-dimensional data.
Decoupling the angular axis from dependent
variables, provides unparalleled flexibility in
designing custom graphical patterns, simplifying the
visualization of complex multi-phase signals in two
or three dimensions. Real-time signal behavior, such
as EEG, EKG, and seismic data, can be monitored
effectively, with dominant resonant frequencies and
harmonics emphasized for deeper analysis.
Semani facilitates the prediction of unmeasured
signal data using adjacent measured values, ensuring
complete signal representation. Outputs can be
converted into formats suitable for machine learning
applications, supporting advanced analytics. It
revolutionizes antenna power radiation diagrams by
enabling realistic modeling of power values across all
directions and distances while allowing independent
analysis of noise and harmonics.
For the first time, multi-phase signals, including
cardiac, brain, seismic, and audio spectrums, can be
directly modeled together in a single graphical
representation. Semani simplifies the modeling of
high-dimensional, complex signals on various
coordinate bases, fostering the development of
innovative visualization tools and analysis
techniques, and making it a groundbreaking approach
for diverse applications.
Semani offers extensive applications across
various industries, enabling advanced modeling of
analog and digital signals. Its capabilities extend to
fields such as medicine, engineering, healthcare,
measurement and evaluation, telecommunications,
and electronics. By facilitating real-time visualization
and multi-dimensional analysis of complex signals—
such as EEG, EKG, EMG, seismic data, radar, sonar,
and audio/music spectra—Semani allows for the
precise and detailed study of these signals.
Key applications include real-time monitoring
and graphical representation of biomedical signals
during patient assessments, enhanced earthquake
simulations for predictive technologies, detailed radar
and sonar analyses for tracking multiple targets, and
comprehensive antenna radiation pattern evaluations.
Semani also addresses challenges in tensor modeling
by offering effective solutions for multi-dimensional
signal modeling, thereby improving efficiency and
accuracy. Its potential spans not only industrial and
BIOSIGNALS 2025 - 18th International Conference on Bio-inspired Systems and Signal Processing
1030
biomedical applications but also groundbreaking
contributions to fields like quantum physics, where it
could provide new insights into particle behavior and
quantum uncertainty principles.
3 METHODOLOGY
Semani enables the modeling and analysis of digital
signals within angular coordinate axes, defined based
on independent variables and phase angles, on a
graphical representation. This approach is
implemented on devices with signal processing
capabilities, allowing both the real-time and post-
recording analysis of signals.
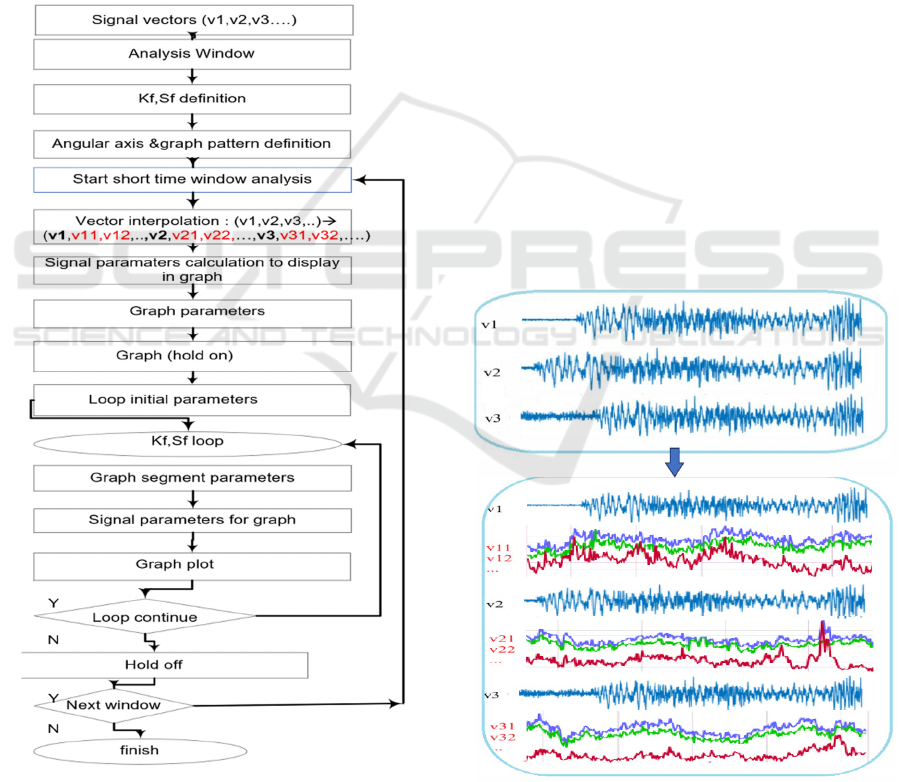
Figure 1: Flowchart of Semani method.
Through windowing techniques, signals are
processed within specific analysis windows,
providing dynamic visualization and evaluation. The
flowchart of the Semani method can be found in
Fig.1. Here, signal vectors (v1, v2, v3,…) were taken
according to their respective phase angles for
modeling. The windowing technique was defined for
short-time analysis. For a graphical display on the
coordinate axis, the change rate of the independent
variable (Kf) and angular resolution (Sf) parameters
were determined. Signal analysis was then started for
successive windows. Within the defined analysis
window, a linear vector interpolation was performed
according to Eq. (1) to calculate the missing signal
vectors (v1, v11, v12, …v2, v21, v22, …v3, v31,
v32,…) for comprehensive visualization purposes
(Fig.2). (Here, the user can prefer another vector
interpolation method, if desired). Signal feature
parameters are derived for graphical visualization.
The format for signal representation—such as
numerical values, colors, symbols, or other visual
elements—is configured based on the graph's design.
The ‘hold-on’ feature was enabled to enable
visualization of all signal data within the analysis
window during the loop process. Then Iterative
processes were initiated for the visualization of signal
data across layers (Kf) and segments (Sf) based on the
calculated boundaries of each segment. Signal data
was displayed on the graph. After visualizing the
windowed data, the ‘hold-on’ feature was disabled
and the cycle continued for successive windows.
Figure 2: Effect of vector interpolation on signal vectors.
Semani provides a robust framework for the real-
time modeling, analysis, and visualization of multi-
A Novel Approach to Modelling Multi-Channel and Multi-Phase Signals on an Angular Coordinate Axis (Semani)
1031
phase signals such as EEG, EKG, seismic data, and
signal spectra. Its layered and angular approach
enables the efficient representation of complex data,
facilitating deeper insights and advanced applications
across industries such as biomedical engineering,
structural analysis, and digital signal processing.
3.1 The Linear Vector Interpolation
Method
Semani enables the modeling of Sinyal2-type multi-
phase signals within angular coordinates by deriving
signal vector samples for intermediate angular
directions not provided as input. Utilizing the
arithmetic averaging method outlined in Equation (1),
signal vectors for these angular segments are
iteratively calculated based on given input signal
vectors. The formula used to calculate the signal
vectors between two input vectors x1 and x2 with an
angle θ is:
𝐵
𝑗
,𝑖
𝑛𝑖
.𝑥
𝑗
𝑖. 𝑥
𝑗
𝑛
,
𝑗
1,..,𝐿,𝑖 1,..,𝑛1
(1)
Here, Bx(j,i) represents the intermediate signal
vectors between x1 and x2, where n is the number of
segments, and L is the length of the signal vectors. By
segmenting the angular coordinate space into equal
intervals and generating a comprehensive signal
matrix, Semani effectively represents Sinyal2's
behavior across the entire angular spectrum. This
approach assumes minimal variation in signal
characteristics across adjacent angular directions.
Additionally, in the Semani method, the signal can be
plotted at the desired resolution by dividing the
angular axis into layers (Kf) based on the rate of
increase of the independent variable. This process
facilitates the modeling of time-domain and
frequency-domain multi-dimensional signal
properties, such as amplitude, power, and phase, with
applications in real-time signal analysis and spectrum
visualization using Fourier Transform, wavelets, or
similar spectral analysis methods. The result is a
robust framework for analyzing Sinyal2 signals
across time and frequency planes.
4 TEST & EVALUATION
The tests were conducted using Sinyal1 and Sinyal2
types of signals, analyzed in both time and frequency
domains. The tests showed that Semani allows for
modeling various signal types, such as audio, EKG,
EEG, and seismic signals, in different angular axes
types. The results from these tests demonstrate
Semani's versatility in signal processing across
various domains, with application examples
including audio, music, and seismic signals.
The provided text details the application of a
signal modeling system using the Semani method for
testing and analyzing both ECG (Electrocardiogram)
and EEG (Electroencephalogram) signals in time and
frequency domains. Here's a summary and
continuation based on the provided information.
4.1 Tests for Sinyal1 (Frequency
Domain)
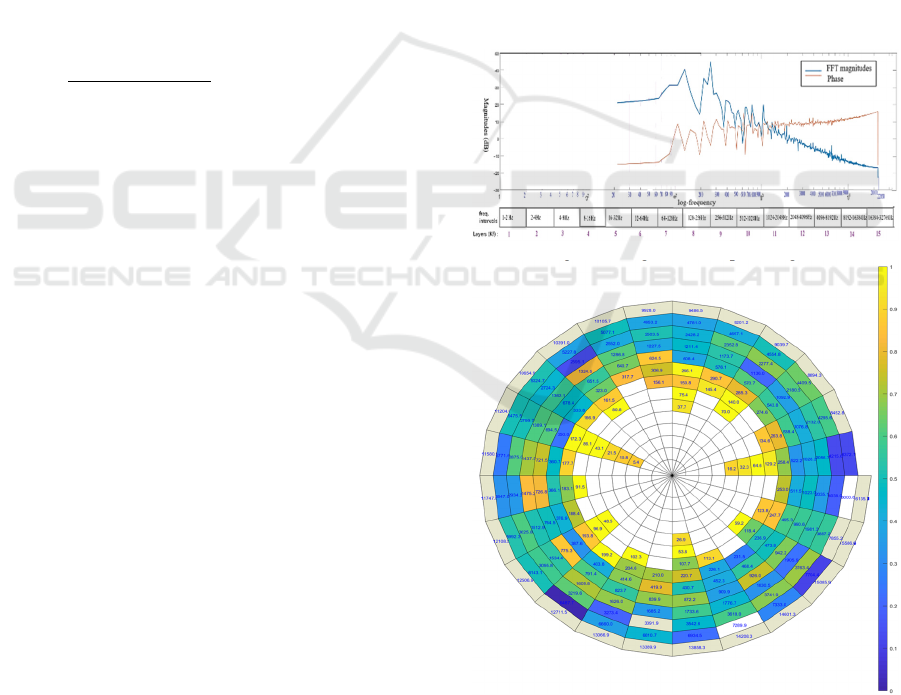
Tests on audio signals at 44kHz sampling rate
(Fig.3a) showed the system's capability to model
signals in polar coordinates (Fig.3b), offering detailed
frequency spectrum analysis. The results highlighted
how longer analysis windows improve frequency
resolution.
Figure 3a: log-FFT of a speech signal.
Figure 3b: Normalized log-FFT of the speech signal of
Fig3a with Semani method (numbers represent frequencies).
BIOSIGNALS 2025 - 18th International Conference on Bio-inspired Systems and Signal Processing
1032
4.2 Tests for Sinyal2 (Time &
Frequency)
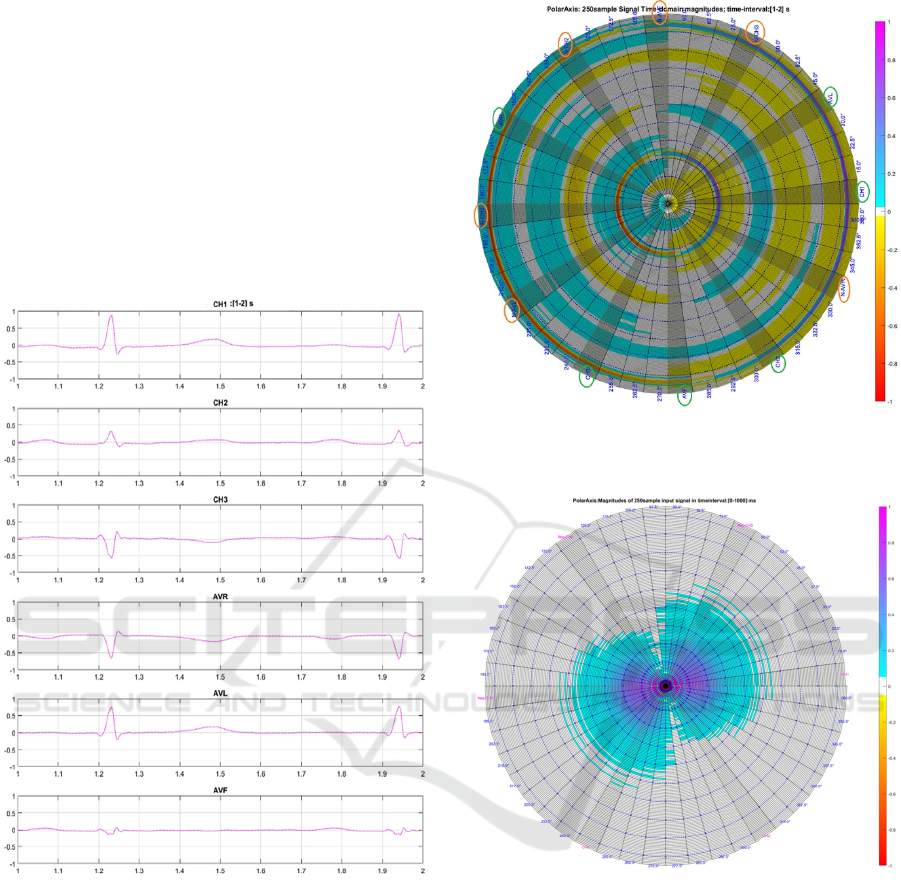
4.2.1 Signal Modeling for ECG Analysis
Semani was used to analyze ECG signals, specifically
from a publicly available 6-channel dataset
containing 10-second long samples recorded at 500
Hz sampling frequency. The dataset includes various
channels (CH1-CH3, AVL, AVR, AVF, V1-V6).
These channels provide both bipolar (CH1-CH3) and
unipolar (AVL, AVR, AVF, V1-V6) derivations.
Figure 4a: A time-domain ECG signal from 6 leads.
During the signal modeling, CH1, CH2, and CH3
were used as input data, with additional derivations
calculated through linear interpolation from these
channels. Fig4a and 4b present a 1s analysis window
outputs of an ECG signal in the time domain. Spectral
analysis was performed using the FFT technique, and
the distribution of the frequency spectrum across
angular phases was displayed as can be seen in Fig 5.
Figure 4b: The time-domain ECG signal of Fig.4a with
Semani method.
Figure 5: An ECG signal in the frequency domain with the
Semani method.
4.2.2 Signal Modeling for EEG Analysis
For EEG signal analysis, Semani used data from
Physionet's database, specifically from a project
involving non-invasive monitoring for epileptic
seizure prediction. The dataset consists of 14 patients,
with each recording lasting 3600 seconds, collected
using the International 10-20 system at a 512Hz
sampling rate.
During the signal modeling, EEG signals from the
electrodes were analyzed in both Cartesian and polar
coordinate systems. The outer region's 10 electrodes
were analyzed (Fp1, Fp2, F8, T4, T6, 02, O1, T5, T3,
A Novel Approach to Modelling Multi-Channel and Multi-Phase Signals on an Angular Coordinate Axis (Semani)
1033
F7), with the results displayed on polar axes,
representing the signal amplitude distributions in
angular directions. The analysis was performed using
a 1-second window, with a sampling rate of 128 Hz,
resulting in 128 layers per second (Fig 6a & 6b).
Fig.7 presents a 3D spherical model of an EEG signal
by using the same data from 10 electrodes in UD
direction. A frame-by-frame analysis of the Semani
method can be seen in Fig.9 and in a frame-by-frame
analysis of the Semani method in an EEG signal can
be seen in Fig.10.
The frequency domain analysis involves
visualizing the spectrum distribution of the EEG
signals across angular phases, with the FFT technique
applied to extract frequency components.
In summary, Semani facilitates advanced signal
modeling, both in time and frequency domains, for
complex biological signals like ECG, EMG, and
EEG. Semani enables detailed analysis of the signals'
amplitude distribution and frequency content, using
polar and 3D coordinate systems for visualization, as
well as spectral analysis through techniques like FFT.
This approach allows for a more comprehensive
understanding of the signals and their characteristics.
Figure 6a: A time-domain EEG signal from 10 electrodes
in a standard 10-20 system.
4.2.3 Signal Modeling for Earthquake
Signals
The Semani method was applied to test and analyze
Sinyal2-type earthquake signals, first discussing their
structure. Earthquake signals are first divided into
Figure 6b: The EEG signal of Fig 6a with Semani method.
Figure 7: An EEG signal in 3D with Semani method.
body waves (P-waves and S-waves) and surface
waves (Rayleigh (R) waves and Love (L) waves).
The data used for analysis, from the AFAD
database, corresponds to a 4.1 magnitude earthquake
on March 29, 2023, in Kahramanmaraş, recorded at a
sampling rate of 100 Hz in three directions: south-
north (SN), east-west (EW), and up-down (UD).
For the time-domain analysis, the signals in EW
(CH1), SN (CH2), and UD (CH3) directions were
used, and linear interpolation generated additional
vectors in angular directions.
The body and surface waves were analyzed
separately due to differences in amplitude and
behavior. The signal data was normalized and
processed using the Semani method, producing a
BIOSIGNALS 2025 - 18th International Conference on Bio-inspired Systems and Signal Processing
1034

matrix according to Eq.1 and representing the signal
amplitudes with color-coded angular directions.
For surface wave analysis, Fig.8a and 8b show
how the signal amplitudes in angular directions are
represented as circular layers, for the 1s analysis
window.
Fig. 8b presents a 3D cylindrical model of surface
waves in the EW, SN, and UD directions, showing
signal amplitudes in circular layers.
Figure 8a: Surface-waves of an earthquake signal in EW,
SN, and UD directions.
Figure 8b: Surface-waves of the earthquake signal of Fig8a
with Semani method (EW, SN & UD directions).
Figure 9: A frame-by-frame analysis of current methods & Semani method.
A Novel Approach to Modelling Multi-Channel and Multi-Phase Signals on an Angular Coordinate Axis (Semani)
1035
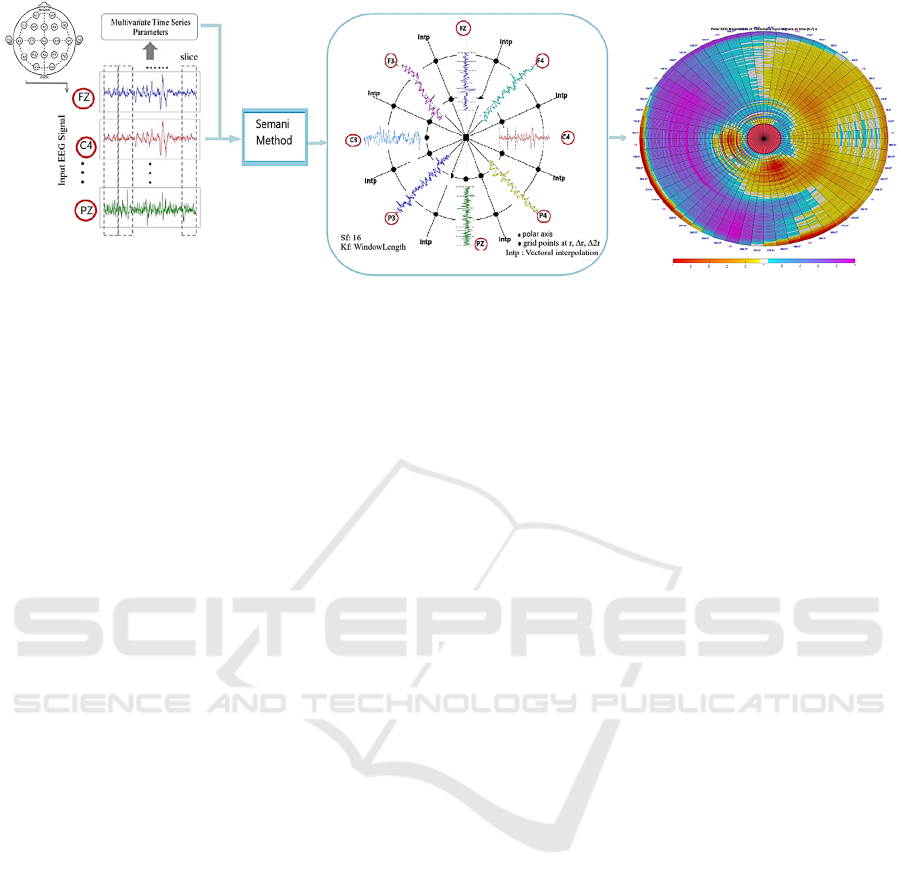
Figure 10: Frame-by-frame analysis example of Semani method in an EEG signal.
5 DISCUSSION
Semani introduces a novel framework for signal
modeling and analysis, particularly for complex
biomedical signals such as ECG, EMG, and EEG.
One of the significant advantages of Semani is its
ability to directly represent multi-phase & multi-
channel signals in both 2D and 3D spaces, which
offers a more comprehensive view of signal dynamics
compared to traditional methods. The utilization of
polar and Cartesian coordinate systems for signal
visualization allows for a clearer interpretation of
signal amplitudes across different time intervals and
angular orientations, providing richer insights into the
characteristics of biological signals.
A key innovation of Semani lies in its handling of
multi-dimensional signal data. For ECG signals, the
analysis incorporates both bipolar and unipolar
derivations, providing a more complete
representation of the electrical activity of the heart.
The ability to map these signals onto a 3D coordinate
system allows for a better understanding of spatial
relationships between the various leads and their
contribution to the overall ECG pattern. Similarly, for
EEG signals, Semani's use of the 10-20 international
electrode placement system for signal acquisition and
analysis in both the time and frequency domains
offers a highly accurate and detailed view of brain
activity.
Semani's application in the frequency domain,
particularly through FFT analysis, is also notable. By
dividing signals into layers corresponding to different
frequency bands, it is possible to observe how
specific frequency components evolve over time.
This level of frequency granularity could prove
particularly useful in detecting abnormalities or
subtle changes in both ECG and EEG signals, which
might otherwise go unnoticed with conventional
analysis methods.
Furthermore, Semani's versatility in analyzing
signals from different types of electrodes (such as
CH1-CH3 for ECG and the 10-20 system for EEG)
adds to its potential applicability in diverse clinical
and research settings. While Semani is quite effective
for standard biomedical signal analysis, there is room
for improvements in computational efficiency,
especially when using real-time analysis scenarios.
As the system is expanded to process more complex
signals or higher dimensional data, optimizing
processing speed and scalability will be crucial.
In conclusion, the Semani method provides a
promising framework for signal modeling and
analysis in both time and frequency domains, offering
valuable insights into radar, sonar & biomedical
signals. Future improvements and refinements,
particularly regarding assumptions about electrode
placement and computational efficiency, could
further enhance its utility and applicability in clinical
diagnostics and research.
6 CONCLUSIONS
The Semani method provides a robust and innovative
approach for the modeling and analysis of complex
biological signals, such as ECG and EEG, in both the
time and frequency domains. By utilizing advanced
techniques like linear interpolation, 3D signal
representation, and polar coordinate analysis, Semani
enables detailed visualization of signal amplitude
distributions and frequency spectra. The integration
of FFT for frequency domain analysis further
enhances the system's ability to extract meaningful
insights from the signals. The application of Semani
to both ECG and EEG datasets demonstrates its
BIOSIGNALS 2025 - 18th International Conference on Bio-inspired Systems and Signal Processing
1036

versatility and effectiveness in capturing intricate
signal characteristics, offering a valuable tool for both
clinical and research purposes. The results, as
presented through various graphical representations,
highlight Semani’s potential to improve the precision
and understanding of biomedical signal analysis,
paving the way for enhanced diagnostic tools and
further advancements in the field.
REFERENCES
Engels, F., Hedenrech, P., Wntermantel, M., Stacker, L.,
Al Kad, M., & Zoubr, A. M. (2021). Automotve
Radar Sgnal Processng: Research Drectons and
Practcal Challenges. IEEE Journal of Selected Topcs
n Sgnal Processng, 15(4), 865-878. https://do.org/
10.1109/JSTSP.2021.3063666
Kamble, K., & Sengupta, J. (2023). A comprehensve
survey on emoton recognton based on
electroencephalograph (EEG) sgnals. Multmeda
Tools and Applcatons, 82(18), 27269-27304.
https://do.org/10.1007/s11042-023-14489-9
Kazem Lchaee, F., Salar, A., Jall, J., Bekmohammad
Dalvand, S., Roshanfekr Rad, M., & Mojarad, M.
(2024). Advancements n Artfcal Intellgence for
ECG Sgnal Analyss and Arrhythma Detecton: A
Revew. Internatonal Journal of Cardovascular
Practce,8(2).
https://do.org/10.5812/ntjcardovascpract-143437
Kumar, R., Verma, A. R., Gupta, B., & Kumar, S. (2021).
Dual-Tree Sparse Decomposton of DWT Flters for
ECG Sgnal Compresson and HRV Analyss.
Augmented Human Research, 6(1), 3. https://do.org/
10.1007/s41133-020-00041-z
Long, J., Wang, X., Zhou, W., Zhang, J., Da, D., & Zhu, G.
(2021). A Comprehensve Revew of Sgnal Processng
and Machne Learnng Technologes for UHF PD
Detecton and Dagnoss (I): Preprocessng and
Localzaton Approaches. IEEE Access, 9, 69876-69904.
https://do.org/10.1109/ACCESS.2021.3077483
Mazlan, M. R., Sukor, A. S. A., Adom, A. H., &
Jamaluddn, R. (2024). Revew of analyss of EEG
sgnals for stress detecton. 040007. https://do.org/
10.1063/5.0181590
Melnda, M., Maulsa, O., Nabla, N. H., Yundar, Y., &
Enrko, I. K. A. (2023). Classfcaton of EEG Sgnal
usng Independent Component Analyss and Dscrete
Wavelet Transform based on Lnear Dscrmnant
Analyss. JOIV : Internatonal Journal on Informatcs
Vsualzaton, 7(3), 830-838. https://do.org/10.30630/
jov.7.3.1219
Neupane, D., & Seok, J. (2020). A Revew on Deep
Learnng-Based Approaches for Automatc Sonar
Target Recognton. Electroncs, 9(11), 1972.
https://do.org/10.3390/electroncs9111972
Pham, Q.-V., Nguyen, N. T., Huynh-The, T., Bao Le, L.,
Lee, K., & Hwang, W.-J. (2021). Intellgent Rado
Sgnal Processng: A Survey. IEEE Access, 9, 83818-
83850.
https://do.org/10.1109/ACCESS.2021.3087136
R. Martn. (2023). Robustfed prncpal component
analyss for feature selecton n EEG sgnal
classfcaton. Internatonal Journal of Systematc
Innovaton, 7(5). https://do.org/10.6977/IJoSI.2023
03_7(5).0004
Ramírez-Espnosa, P., Morales-Jmenez, D., & Wong, K.-
K. (2024). A New Spatal Block-Correlaton Model for
Flud Antenna Systems. IEEE Transactons on Wreless
Communcatons, 23(11), 15829-15843. https://do.org/
10.1109/TWC.2024.3434509
Rodrguez-Tapa, B., Soto, I., Martnez, D. M., & Arballo,
N. C. (2020). Myoelectrc Interfaces and Related
Applcatons: Current State of EMG Sgnal Processng–
A Systematc Revew. IEEE Access, 8, 7792-7805.
https://do.org/10.1109/ACCESS.2019.2963881
Ruan, H., Da, X., Chen, S., & Qu, X. (2022). Arrhythma
Classfcaton and Dagnoss Based on ECG Sgnal: A
Mult-Doman Collaboratve Analyss and Decson
Approach. Electroncs, 11(19), 3251. https://do.org/
10.3390/electroncs11193251
She, C., Cheng, P., L, A., & L, Y. (2021). Grand
Challenges n Sgnal Processng for Communcatons.
Fronters n Sgnal Processng, 1, 664331.
https://do.org/10.3389/frsp.2021.664331
We, Z., Qu, H., Jang, W., Han, K., Wu, H., & Feng, Z.
(2023). Iteratve Sgnal Processng for Integrated
Sensng and Communcaton Systems. IEEE
Transactons on Green Communcatons and
Networkng, 7(1), 401-412. https://do.org/10.1109/
TGCN.2023.3234825
Yn, X., Lu, F., Ca, R., Yang, X., Zhang, X., Nng, M., &
Shen, S. (2022). Research on Sesmc Sgnal Analyss
Based on Machne Learnng. Appled Scences, 12(16),
8389. https://do.org/10.3390/app12168389
J. Long, X. Wang, W. Zhou, J. Zhang, D. Da and G. Zhu,
"A Comprehensve Revew of Sgnal Processng and
Machne Learnng Technologes for UHF PD Detecton
and Dagnoss (I): Preprocessng and Localzaton
Approaches," n IEEE Access, vol. 9, pp. 69876-69904,
2021, do: 10.1109/ACCESS.2021.3077483.
Martn, J., “Nkola Tesla: How Energy, Frequences, and
Vbratons Shape Realty”, Amazon Dgtal Servces
LLC - KDP Prnt US, ISBN:9798408952731, 2022
Availability of Data and Materials: The datasets used
and analyzed in the current study are publicly available as
open-source data.
Conflict of Interests: The author declares that the
method presented in this study is subject to a patent
application under the author's name, which may have
potential commercial implications.
A Novel Approach to Modelling Multi-Channel and Multi-Phase Signals on an Angular Coordinate Axis (Semani)
1037
