
Integration of On-Demand Ride-Pooling into a Microscopic Traffic
Flow Simulation Environment
Oytun Arslan
a
and Silja Hoffmann
b
Chair of Intelligent, Multimodal Transport Systems, University of the Bundeswehr Munich, Werner-Heisenberg-Weg 39,
Munich, Germany
Keywords: On-Demand Mobility, Ride-Pooling, Microscopic Traffic Flow Simulation, Matching Algorithms.
Abstract: The aim of this study is to model an on-demand ride-pooling system in a microscopic traffic flow simulation
environment. On-demand systems are hardly modeled in microsimulations, hence a research gap was
identified here. First of all, a methodology was developed to match the requests with the vehicles, considering
the operator as well as the passenger interests. Then the simulation setup for the campus of the University of
the Bundeswehr Munich was carried out, taking into account the specialties for on-demand traffic and the
traffic data feed for the remaining traffic. The data flow from already installed traffic cameras into the
microsimulation was illustrated and the steps to model on-demand traffic were elaborated. Results have shown
that the objective function can be modified according to the ride-pooling system requirements via various
weighting parametrizations, that higher demand profiles lead to more shareability and efficiency, and that
ride-pooling strategy outperforms ride-hailing in on-demand systems.
1 INTRODUCTION
Due to the increase in the urban population, recent
years have brought many innovative ideas regarding
mobility concepts. One of the new paradigms is the
sharing concept, where users share the vehicles
instead of owning them.
In conventional public transportation, the
timetables and departure times are fixed. In addition,
the route of the public transport vehicle is also fixed,
so transfers between vehicles to reach from origin to
destination are not rare. This rigidness leads to a user
dissatisfaction, which is why new flexible shared on-
demand concepts were developed, such as ride-
hailing and ride-pooling. Uber, Lyft, Bolt and MOIA
(Germany) are currently well-known companies that
invest in these new ideas. Both in ride-hailing and
ride-pooling, users can send requests for a trip by
typically stating the origin and destination, and when
to ride. In ride-hailing, trips are not shared, i.e., an
exclusive trip for the user, very similar to a taxi
system. In ride-pooling, on the other hand, trips may
be shared (pooled) if there is a certain similarity
between them, such as similar route and similar
a
https://orcid.org/0000-0002-5221-4698
b
https://orcid.org/0000-0002-0499-0342
departure times. Finding out pooling potentials by
individual drivers is not practical, therefore a central
dispatching system collects the requests and decides
which requests to be pooled together in which
vehicle.
It is obvious that the dispatching algorithm is the
core essence of such a ride-pooling platform. The two
sides of such a system are a) the operator with its
vehicles, the aim is to realize its service with as less
mileage as possible; b) the users which appear in the
system as trip requests, the aim is to have less waiting
times at the departure and less detour times caused by
pooling.
This paper focuses on the ride-pooling
dispatching algorithm and develops a methodology
for optimally assigning requests to vehicles in a
dynamic manner. The platform to model the ride-
pooling system was chosen as the microscopic traffic
flow simulation (microsimulation) Vissim (PTV,
2024). Microsimulations are widely used in traffic
engineering for assessing and planning road
infrastructures, evaluation of traffic management
measures as well as testing new technologies and
systems (Daamen et al., 2015). However, on-demand
506
Arslan, O. and Hoffmann, S.
Integration of On-Demand Ride-Pooling into a Microscopic Traffic Flow Simulation Environment.
DOI: 10.5220/0013341400003941
In Proceedings of the 11th International Conference on Vehicle Technology and Intelligent Transport Systems (VEHITS 2025), pages 506-513
ISBN: 978-989-758-745-0; ISSN: 2184-495X
Copyright © 2025 by Paper published under CC license (CC BY-NC-ND 4.0)

systems are hardly modeled in microsimulations as
will be mentioned in the next chapter, and this has
pointed out a research gap in this area. Closing this
gap will mean that it will be possible to add on-
demand modes in microsimulation models (where
motorized, bicycle and pedestrian traffic are already
present) in the future (Arslan and Hoffmann, 2024a).
2 LITERATURE REVIEW
Ride-pooling belongs to dial-a-ride-problems
(DARP), which is a sub-topic of vehicle routing
problems (VRP). In the literature, the problems are
divided into two main parts: either static or dynamic
(Pillac et al., 2013; Psaraftis et al., 2016; Ho et al.,
2018; Ghandeharioun and Kouvelas, 2023). In static
problems, all the input data are known before the
calculation of routes. If an operator gets a list of trip
requests with origin, destination and desired
departure time in advance, this can be classified as a
static problem. Cordeau (2006) solved such a static
DARP problem with 48 requests using a branch and
cut algorithm. Armellini (2021) used SUMO
microscopic simulation tool to assign 55 requests to
vehicles in Brunswick, Germany in a static manner.
Dynamic problems occur if the input data is not fully
known, e.g., if new requests arrive to the system
during the transportation of current requests.
Assignment of new requests causes the change of
current routes of vehicles, so there is a dynamic
aspect in terms of decision making. Pillac et al. (2013)
gave an overview about current algorithms in
dynamic VRP. Building upon this work, Psaraftis et
al. (2016) extended the review also for dynamic
DARP. In the literature, there are also some papers
which reviewed both static and dynamic DARP
problems (Cordeau and Laporte, 2007; Ho et al.,
2018).
To test the ride-pooling algorithms, different
modelling environments have been used until now.
For example, Friedrich et al. (2018) and Thomsen
(2023) used Visum macroscopic simulation for this
purpose. Yet, most of the work here was conducted
with agent-based simulations, for instance with the
open-source agent-based simulation tool MATSim
(Fagnant and Kockelman, 2018; Narayan, 2020) or a
self-developed agent-based simulation tool FleetPy
(Engelhardt et al., 2022).
Regarding microscopic traffic simulation, Dandl
(2017) used Aimsun to implement an autonomous
taxi system in Munich, however only with ride-
hailing. Armellini (2021) as well as Tang and
Armellini (2021) used SUMO microsimulation, but
only in the static DARP context, the latter
implemented without ride-pooling.
As a conclusion to this literature review, it has
been clear to the authors that a research gap could be
identified concerning a dynamic DARP
implementation for ride-pooling in microscopic
traffic simulation.
3 MATCHING METHODOLOGY
In a ride-pooling system, users send their trip requests
via a smartphone to a central dispatcher. The requests
typically include the trip origin, trip destination and
the desired departure time. If the user wants to realize
his/her trip as soon as possible, this is regarded as an
immediate request, which is most of the time the case.
The central dispatcher monitors the fleet and matches
the incoming requests with the appropriate vehicles
based on certain criteria. In this chapter, such a
matching algorithm with essential parameters will be
elaborated.
The methodology here is built upon the previous
study of Arslan and Hoffmann (2024b), which we
refer to for the main features and the further details.
3.1 Creating Valid Permutations
Every time a new request arrives in the system, it will
be checked which vehicle can take it over. Since
vehicles are already moving in the simulation to pick-
up/drop-off previous requests, their current status
must be also taken into account when calculating the
possible options for the new request. If for instance a
new request (X) arrives in the system, and at that
moment the status of a regarded vehicle is as follows:
2 requests (A and B) are already picked-up and
travelling in that vehicle, 1 request (C) is recently
assigned to this vehicle but not yet picked-up, all
possibilities of a permutation of 6 points (these are
A
D
, B
D
, C
P
, C
D
, X
P
, X
D
where the indices are P: pick-
up, D: drop-off) have to be considered. For each
permutation, a route legitimacy check needs to be
carried out, i.e., checking whether the drop-off point
of a request happens not before its pick-up point.
Assuming that i is the number of in-vehicle
passengers in a vehicle and t is the number of requests
to be picked up by a vehicle, a general formula for the
number of valid permutations to transport the in-
vehicle passengers, to-be-picked-up passengers as
well as the new request can be stated as:
𝑇𝑜𝑡𝑎𝑙 𝑛𝑜. 𝑜𝑓 𝑝𝑒𝑟𝑚𝑢𝑡𝑎𝑡𝑖𝑜𝑛𝑠 =
𝑖+2𝑡+2
!
2
(1)
Integration of On-Demand Ride-Pooling into a Microscopic Traffic Flow Simulation Environment
507

According to this formula, the above example
(i=2 and t=1) leads to 180 permutations in total. Then
another check regarding the vehicle capacity must be
conducted in order to avoid an excess of capacity in
any permutation, since vehicles might exploit their
capacity values by incorporating the new request in
their travel plans. Here, if the number of requests
inside the vehicle is more than its capacity at any
point of time, the concerned permutation will be
omitted.
Following examples illustrate the generation of
valid permutations for the vehicle mentioned above,
assuming a vehicle capacity of 3:
• A
D
X
D
C
P
C
D
X
P
B
D
permutation is not valid since drop-off of X
(X
D
) happens before its pick-up (X
P
).
• C
P
X
P
B
D
X
D
C
D
A
D
permutation is not valid since the number of
requests inside the vehicle goes up to 4 after
the pick-up of X (X
P
), hence exceeds the
vehicle capacity of 3.
• B
D
X
P
C
P
C
D
X
D
A
D
permutation is valid since route legitimacy is
guaranteed and vehicle capacity is never
exceeded.
3.2 Filtering out Permutations
Among valid permutations, another filtering
mechanism is used in terms of waiting times and
detour ratios of passengers. Here maximum waiting
time is the maximum acceptable time for a passenger
to be picked-up after sending a request. Detour ratio
is the ratio of the actual travel time (increased due to
pooling) to the direct travel time. Permutations
resulting in high waiting times or detour ratios are
cancelled out since they are not acceptable for
passengers at all, even if the permutation globally
turns out to have a good overall score. These values
are parameters in the case studies.
3.3 Calculation of Overall Score
The procedure mentioned above is applied to all
vehicles in the system in order to create a pool of valid
vehicle-permutation combinations. The aim is then to
find the best solution from this pool. For this, both the
passenger’s point of view and the operator’s point of
view are analyzed. While operators try to diminish the
total vehicle travel times, passengers have mainly two
discouragements in ride-pooling: i) waiting time for
the vehicle, ii) detour time due to pooling, equal to the
in-vehicle time minus the direct trip time. While the
in-vehicle passenger suffers only from the latter, the
new request and the to-be-picked-up passenger suffer
from both, depending on the situation. A new
assignment causes a change in the route and stop
sequence of the vehicle. This affects the remaining
tour time of the vehicle as well as the waiting and
detour times of the passengers currently planned in
the tour of a vehicle.
An overall score of an option can therefore be
formulated as follows:
(2)
where tt
v
is the planned tour time of the vehicle v,
wt
r
is the waiting time and dt
r
is the detour time of the
request r, all for either the current status or the new
status of the system. W
1
and W
2
are the weightings for
operator side (vehicle time) or passenger side
(waiting time and detour time). veh and req are the
sets of vehicles and requests respectively, that are
present in the simulation at the decision time. The
first part of the formula represents the extra travel
time of vehicles after a new request is assigned,
whereas the second part represents the extra time
burden of requests. By adoption of weightings, more
emphasis can be put on either side, which brings a
certain design flexibility.
In the next step, the overall score is calculated for
all possible permutations. The permutation with the
least value of the overall score is used for the
assignment, the new request will be matched to the
vehicle associated with that permutation.
4 SIMULATION SETUP
The matching algorithm was applied in a Vissim
microscopic simulation of the University of the
Bundeswehr Munich campus. The simulation
incorporates on one side the on-demand ride-pooling
shuttles, on the other side the remaining campus
traffic with other transport modes. The campus has an
area of 140 hectares and consists of many facilities
fulfilling different purposes such as various research
buildings, administrative buildings, a university
library, dormitories, a post office, sports facilities,
sanitary facilities, a kindergarten, and a canteen. 16
shuttle stops were decided based on the campus
entry/exit points, surveys conducted among
university members and the most important campus
locations (Figure 1). Moreover, a depot was
implemented for the shuttles where they all start the
simulation at the beginning. During the simulation, in
VEHITS 2025 - 11th International Conference on Vehicle Technology and Intelligent Transport Systems
508
case shuttles did not have any new task, they waited
at the last stop in the idle mode. Only when a stop was
occupied by a shuttle while another one wanted to
approach there i.e., due to drop-off of a request, the
former shuttle was sent to the depot to make room for
the latter. Since the demand profile showed an even
distribution within the campus and the area of campus
is not too large, no rebalancing or relocation strategies
were applied in this study.
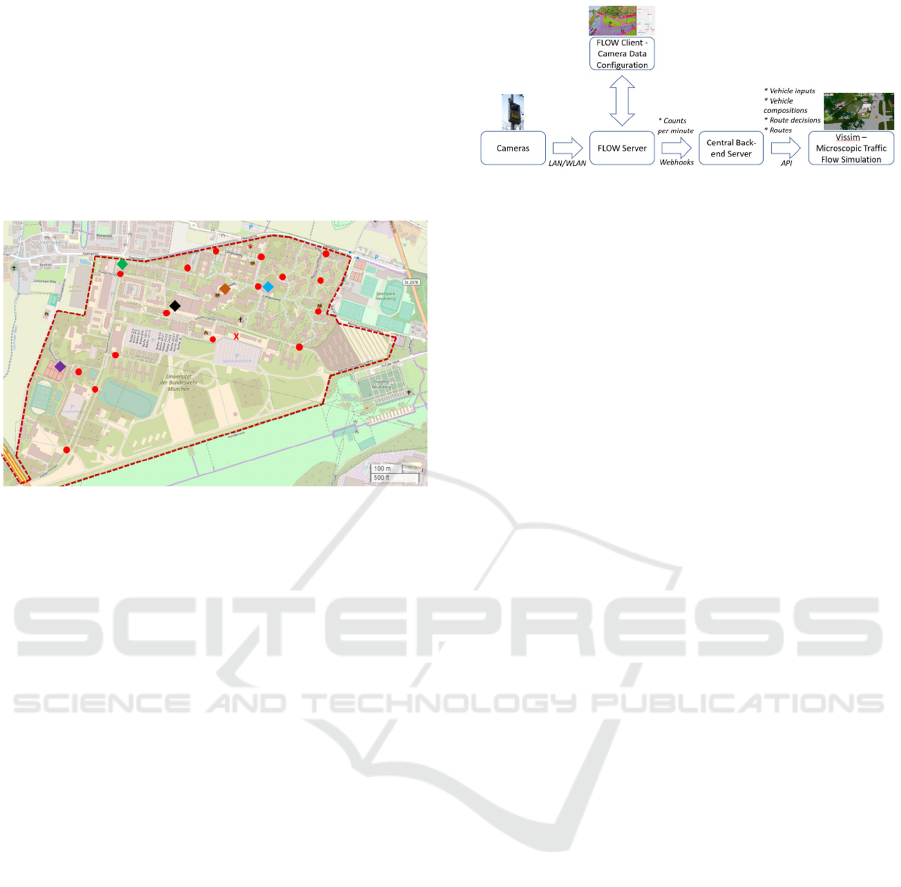
Figure 1: Campus of the University of the Bundeswehr
Munich with 16 shuttle stops shown in red circles and X as
depot. Diamonds show the important spots in the campus.
Green: Main entrance, Purple: Sport facilities, Black:
Laboratories, Brown: Library, Blue: Canteen (Source:
OpenStreetMap).
4.1 Simulation Setup for the
Remaining Campus Traffic
For the simulation data feed, the available camera
data in the campus as well as manual traffic counts
were used. Within the scope of the MORE project
(MORE, 2024), traffic data collection cameras were
installed in the university campus. These cameras can
detect different vehicle types and can provide
historical count data around-the-clock. Camera data
are sent via LAN/WLAN to a first server, where
operators can set virtual gates on the camera images
for various vehicle types via a client. 13 different
vehicle types were used for the simulation, including
car, truck, bicycle and pedestrian. Gates produce
counts for every previous minute and these are sent to
a central back-end server via webhooks, where all
traffic data of the campus within the MORE project is
stored. Afterwards, the simulation queries the camera
data for a specific date and time via an API. Here, the
COM interface of Vissim is used to realize such
queries. An overview of the data flow is illustrated in
the following figure.
Figure 2: Data flow diagram for the remaining campus
traffic.
The objects in Vissim that are updated via camera
data are listed as follows:
• Vehicle inputs: Starting point of vehicles.
Involves counts and vehicle compositions,
both per time interval.
• Vehicle compositions: Modal split of
traffic. Involves vehicle types and relative
values. Used in vehicle inputs.
• Route decisions: Decision points for
vehicles at intersections. Involves vehicle
types and routes.
• Routes: Turning directions at intersections.
Involves direction and relative values per
time interval.
Since there was not sufficient coverage of traffic
cameras in the whole campus, it was inevitable to
conduct manual traffic counts as well. Here, traffic
streams were counted for every 15 minutes for certain
vehicle types (car, heavy, motorcycle, bicycle,
scooter, pedestrian). Based on the 7 traffic count
spots, missing vehicle inputs and compositions were
generated. Moreover, based on 11 traffic count spots,
missing route decisions and routes were generated.
Since manual traffic counts were not practical for
long time periods, extrapolations and assumptions
were used where no count data existed.
Calibration of the simulation was performed in
two steps. In the first step, the travel times were
calibrated by doing test trips in the real world and
sending probe vehicles in the simulation (Daamen et
al., 2015). These values were compared for two main
routes in the campus, for both directions. According
to the results, the stoppage time at the barriers (used
for controlled access into the campus and within the
campus in certain areas) were adopted in the
simulation. As a second step, vehicle speeds were
calibrated using the camera data. At 8 camera spots,
car speeds were filed in .csv format for 7-9 a.m.
morning peak time. For each spot, a cumulative speed
distribution was created in the simulation. These
distributions were then incorporated with desired
speed decisions object in the simulation, upstream of
Integration of On-Demand Ride-Pooling into a Microscopic Traffic Flow Simulation Environment
509

that spot. Within the calibration process, the
distributions were fine-tuned to achieve a good
fitness. At the end of the calibration process, it could
be confirmed by statistical t-tests that both datasets
could fit to each other for all the 8 spots.
4.2 Simulation Setup for the on-
Demand Shuttle Traffic
Standard microsimulation functionalities are not
sufficient to gather the peculiarities of on-demand
systems, since vehicles mainly get a static route at
intersections or the origin-destination routes assigned
to a vehicle at the beginning of the simulation does
not change during the simulation run. In on-demand
shuttle case, however, these properties are necessary
since vehicles have to get dynamic routes and be able
to change their route “on the fly” in case of the new
system triggers, such as an incoming request. Vissim
does not offer a standard solution for on-demand
vehicles, nevertheless, it offers an external
programming via the COM interface. With this
interface, codes such as in python can be applied to
the model, enabling control of the system externally.
Some modifications and adoptions in the simulation
were necessary to get the on-demand features, to
name a few:
• The option “dynamic assignment” was
activated
• Whole network was furnished with nodes
and edges, relating to the graph theory
• Shortest routes between the nodes were
calculated by Dijkstra’s shortest path
algorithm (Gkiotsalitis, 2022)
• Shuttle stops were modelled as one-vehicle
parking lots where a usage for dynamic
assignment was activated
• Priority rules were used at shuttle stops to
make a shuttle wait at the right spot if the
stop is occupied by another shuttle
• Nodes were categorized as allowed/
disallowed for shuttles in order to be able to
control the nodes and edges where a shuttle
could travel (since some road sections in the
campus were not meant for the shuttle
usage)
• Vehicle attributes were extended with new
ones, such as vehicle status, average
occupancy, empty drive kilometer, idle time,
planned vehicle path
• Request attributes were created such as
request status, direct trip distance, request
time, real pick-up time, real drop-off time
• A function sending an idle shuttle to its
depot if it blocks another shuttle was applied
in python code
• A function to export certain KPIs to a .csv
file for further analysis was applied in
python code
Another essential point in the on-demand
simulation is generating a request pool. In order to
mimic the on-demand travel demand of passengers
within the university campus, the microsimulation
had to be fed with trip requests. Since the campus has
its own peculiarities, e.g. certain origin-destination
pairs are more prevalent depending on the time of the
day, usage of a realistic dataset was deemed
necessary. Therefore, the trip base of the
micromobility sharing system of the campus was
utilized. This platform, known as MORE Sharing, is
operated on a free-floating system and enables users,
who are solely the university members, to book e-
scooters, e-bikes, e-cargo bikes, city bikes and e-
mopeds for their trips (MORE, 2024).
The sharing data was analysed from the system
launch (06.03.2023) until 05.11.2023, for an 8-month
period. For the shuttle system demand, the day with
the highest demand is taken as base, which is
21.03.2023. Since the travel demand on that day
before 7 a.m. was very scarce, only trips after 7 a.m.
until midnight were considered. This led to a
simulation run of 17 hours in total for 385 trip
requests.
4.3 Workflow of Simulation
The microsimulation gathers all the inputs mentioned
in the previous parts, and starts running for 17 hours.
During the course of the simulation, incoming
requests trigger the simulation to do new calculations
and the “optimum” vehicles are matched with those
requests one-by-one (or requests are rejected),
vehicles are sent to different locations according to
their assignments and finally, the simulation delivers
outputs for the analysis.
5 RESULTS
Regarding the camera data, it was important to select
a day within the lecture time periods. The campus
traffic at the weekends is also quite low, that is why a
weekend day was avoided. For these reasons, a
typical weekday was chosen (16.10.2024 Monday).
Other required parameters in the simulation runs are
as follows: Simulation period is 17 hours (7 a.m. until
VEHITS 2025 - 11th International Conference on Vehicle Technology and Intelligent Transport Systems
510
midnight), boarding/alighting time for the shuttles is
30 seconds, shuttle maximum speed is 15 km/h
(autonomous shuttle assumed), request pool is 385
requests based on MORE Sharing, and simulation
resolution is 3 time-steps per simulation second. The
chosen operational parameters will be given in detail
in the scenario descriptions below.
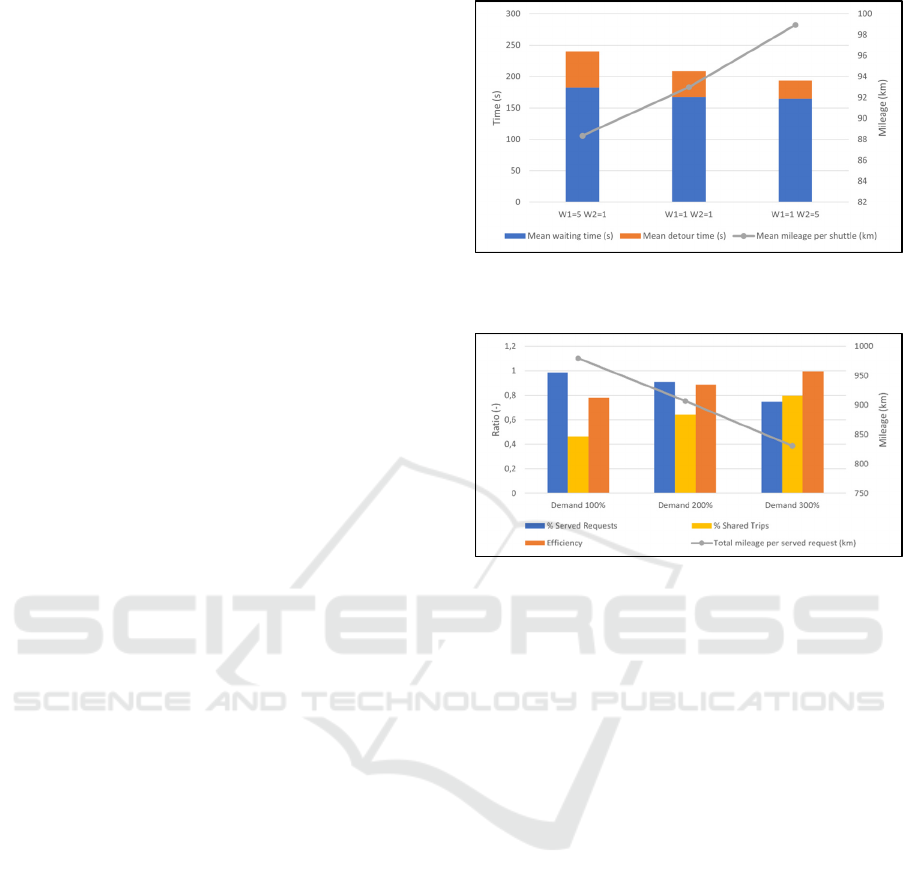
5.1 Impact of Weightings in the
Overall Score
In this analysis, the idea was to depict the impact of
W
1
and W
2
values (the weightings) in Equation 2 on
the certain metrics of the system.
For this analysis, a fleet size of 4 vehicles with a
capacity of 4, a maximum waiting time of 10 minutes
and a maximum detour ratio of 2 were assumed.
Three scenarios were prepared, one with the same
weightings for operator and passenger side, second
one with operator side dominant (5 to 1) and the last
one with passenger side dominant (1 to 5).
It can be seen from the Figure 3 that mean mileage
of the shuttles diminish when operator side is more
emphasized (W
1
>W
2
vs W
1
=W
2
). In this case, mean
waiting and detour time increase, which shows the
disadvantage for passenger side. The total delay,
which is the waiting time plus the detour time also
increases. On the other hand, if the passenger side is
more emphasized (W
1
<W
2
vs W
1
=W
2
), the effect is
the other way around: the mileage increases whereas
the passenger burdens (waiting and detour time)
decrease. Here, the waiting time experiences a very
slight decrease (2%) yet the detour time decrease is
around 30%. As an additional remark to the readers,
it was observed that the percentage of the served
requests remained almost the same for all three
scenarios.
With this analysis, it is demonstrated that the
objective function (the overall score) can be modified
according to the needs of the ride-pooling system via
various weighting parametrizations.
5.2 Impact of Travel Demand
In this analysis, the travel demand for on-demand
shuttles in the campus was increased gradually in
order to observe its impacts on the system metrics. As
in the previous analysis, a fleet size of 4 vehicles with
a capacity of 4, a maximum waiting time of 10
minutes and a maximum detour ratio of 2 were
assumed. The first scenario involves the default
demand extracted from the MORE Sharing. In the
second scenario, amount of this demand was doubled
and in the third tripled. The new demand was
Figure 3: Impact of weightings (W
1
and W
2
) in the overall
score.
Figure 4: Impact of travel demand on certain system
metrics.
produced randomly in terms of start location, end
location and start time.
Figure 4 underlines that higher demand cannot be
satisfied fully anymore: With 100% demand, the
percentage of served requests are almost 1 (nearly no
request had to be rejected), whereas this metric
reduces down to 0,9 and 0,75 if the travel demand is
increased. A way to mitigate this effect could be to
increase the fleet size.
Shared trips are defined as the number of requests
who share a ride, divided by the total number of
served requests. The percentage of the shared trips
increase with increasing demand since a larger
request pool has a positive effect on the shareability,
therefore more requests can be pooled together.
Efficiency is defined as the direct trip distances of
served requests (benefit) divided by the total mileage
(cost) (Liebchen et al., 2020). Normally, it is expected
that more shareability, i.e., more pooling has a
positive impact on the efficiency. This can be
confirmed with the results: From lowest demand to
the highest, there is a gradual increase of efficiency.
Even with triple demand, the efficiency is very close
to 1, which means the costs are as much as the
benefits. Certainly, with higher demand and other
Integration of On-Demand Ride-Pooling into a Microscopic Traffic Flow Simulation Environment
511
fleet size constellations, an efficiency higher than 1
can be reached.
Lastly, a glance at the total mileage per served
request implies that less mileage per served request is
required in higher demand scenarios: 15% less in
triple demand scenario compared to the normal
demand.
With this analysis, it can be inferred that a more
efficient system can generally be reached with higher
demand profiles, since the pooling effect becomes
then more visible.
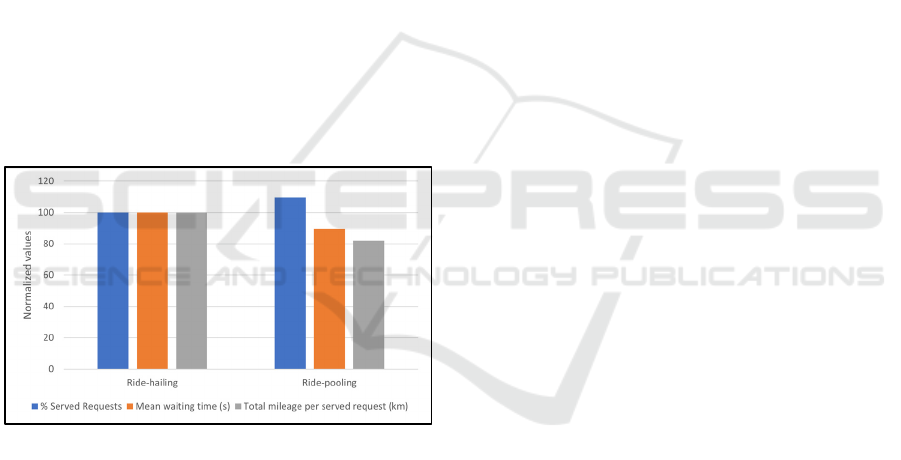
5.3 Comparison of Ride-Hailing and
Ride-Pooling
In this analysis, the ride-pooling strategy was
compared to the ride-hailing. In ride-hailing, trips are
not shared so each trip is conducted exclusively.
Here, 4 vehicles with capacity 1 (ride-hailing) and 4
(ride-pooling) were used. Moreover, a maximum
waiting time of 5 minutes and a maximum detour
ratio of 2 were assumed. To perceive the impact
better, the three metrics used were normalized for the
ride-hailing case to 100 units. The comparison can be
viewed in the following figure:
Figure 5: Comparison of ride-hailing and ride-pooling.
Here, the pooling strategy contributes almost 10%
in terms of served requests. Also, in terms of mean
waiting time of passengers, there is a decrease of 10%
when pooling is performed. Finally, the total mileage
per served request is decreased by nearly 20% with
pooling. It can therefore be concluded that a pooling
strategy with a well-established matching algorithm
has immense positive impacts on the on-demand
system.
6 CONCLUSIONS AND FUTURE
WORK
This study aims to model a ride-pooling system in a
microscopic traffic flow simulation environment. A
comprehensive literature review showed that there is
a research gap here for microsimulations. For this,
firstly a methodology was developed to match the
requests with the vehicles. Both operator and
passenger side were considered in the decision
function, moreover weightings were used to make
more emphasis on either side. Then the simulation
setup for the campus of the University of the
Bundeswehr Munich was carried out, taking into
account the specialties for on-demand traffic as well
as the traffic data feed for the remaining traffic. Here
camera data and manual traffic count data were
utilized, the latter in case camera data were not
available at certain slots. Furthermore, on-demand
requests were extracted from the micromobility
sharing system of the campus.
Different scenarios were simulated to explore the
impacts of weightings in the overall score, impact of
amount of demand, and impact of ride-pooling
strategy compared to ride-hailing on the certain
system metrics. Results have shown that i) the
objective function can be modified according to the
needs of the ride-pooling system via various
weighting parametrizations, ii) higher demand
profiles lead to more shareability and efficiency, and
iii) ride-pooling strategy outperforms ride-hailing in
on-demand systems.
In a future research work, a different assignment
algorithm will be applied, namely batch assignment,
where the requests are assigned to vehicles in certain
batches (time periods), rather than immediately. This
can lead to more efficient matches since the search
space is then greater, as suggested by the literature.
In the current algorithm, the shortest paths are
calculated based on the distance between nodes.
However, an ideal approach would be considering the
traffic situation as well. As an advantage of the
microsimulation tool, the current traffic situation can
be extracted, analyzed and the weightings of the
edges can be modified accordingly, leading for
instance to a more expensive edge in case of
congestion. In this way, the Dijkstra algorithm can be
forced to find less congested connections instead of
the shortest ones, which can again be a topic for
further research.
The case study was conducted in a university
campus within the scope of a campus research
project. Due to the scarce travel demand and small
service area, a small fleet was used. Another further
VEHITS 2025 - 11th International Conference on Vehicle Technology and Intelligent Transport Systems
512

research point would be the scalability of this study
to larger urban areas. First, setting up the
microsimulation model for a larger area will certainly
be more intricate. Here, depending on the objective of
the model, the level of detail needs to be determined
carefully. Furthermore, a larger area implies having
more travel demand and a larger fleet size, hence
more frequent matchings. The impact of this on the
simulation performance must be then cautiously
investigated.
ACKNOWLEDGEMENTS
This research is funded by dtec.bw – Digitalization and
Technology Research Center of the Bundeswehr. The
dtec.bw is funded by the European Union –
NextGenerationEU.
REFERENCES
Armellini, M.-G. (2021). A Tool for Simulating Demand
Responsive Transport System in SUMO. In 7th IEEE
International Conference on Models and Technologies
for Intelligent Transportation Systems (MT-ITS), pp.
425-429.
Arslan, O. and Hoffmann, S. (2024a). Implementation of a
spontaneous matching algorithm for on-demand shuttle
systems in microsimulation. Transportation Research
Procedia 78 pp. 418–427.
Arslan, O. and Hoffmann, S. (2024b). Impacts of On-
Demand Shuttle System Parameters on its Metrics: A
Microsimulation Study. In 26th Euro Working Group
on Transportation Meeting (EWGT 2024), Lund,
Sweden.
Cordeau, J.-F. (2006). A Branch-and-cut algorithm for the
dial-a-ride problem. Operations Research, 54, 573–586.
Cordeau, J.-F. and Laporte, G. (2007). The Dial-a-ride
Problem (DARP): Models and Algorithms. Annals OR,
vol. 153, pp. 29–46.
Daamen, K., Buisson, C., Hoogendoorn, S. (2022). Traffic
Simulation and Data – Validation Methods and
Applications. International Standard Book Number-13:
978-1-4822-2871-7 (eBook - PDF). CRC Press
Publications, USA.
Dandl, F., Bracher, B. and Bogenberger, K. (2017).
Microsimulation of an Autonomous Taxi-System in
Munich. In 5th IEEE International Conference on
Models and Technologies for Intelligent Transportation
Systems (MT-ITS), pp. 833–838.
Engelhardt, R., Dandl, F. and Bogenberger, K. (2022).
FleetPy: A Modular Open-Source Simulation Tool For
Mobility On-Demand Services. Available at
https://arxiv.org/pdf/2207.14246.pdf.
Fagnant, D. J. and Kockelman, K. M. (2018). Dynamic
Ride-Sharing and Fleet Sizing for a System of Shared
Autonomous Vehicles in Austin, Texas. Transpor-
tation, Vol. 45, 2018, pp. 143–158
Friedrich, M., Hartl, M. and Magg., C. (2018). A Modeling
Approach for Matching Ridesharing Trips Within
Macroscopic Travel Demand Models. Transportation,
Vol. 45, No. 6, 2018, pp. 1639–1653.
Ghandeharioun, Z. and Kouvelas, A. (2023). A survey of
dial-a-ride problems: Literature review and recent
developments. Transportation Research Part C. Vol
151.
Gkiotsalitis, K., (2022). Public Transport Optimization.
ISBN 978-3-031-12443-3. Springer Publications,
Switzerland.
Ho, S.C., Szeto, W., Kuo, Y.-H., Leung, J.M., Petering, M.
and Tou, T.W. (2018). A survey of dial-a-ride
problems: Literature review and recent developments.
Transportation Research Part B. Vol 111, pp 395-421.
Liebchen, C., Lehnert, M., Mehlert, C. and Schiefelbusch,
M. (2020). Ridepooling-Effizienz messbar machen. In
Nahverkehr 09/2020, pp 18-21.
MORE Mobility Research. (2024). MORE Mobility
Research Project für die Universität der Bundeswehr.
Narayan, S. (2020). Design and Analysis of On-Demand
Mobility Systems. Dissertation in Delft University of
Technology.
Pillac, V., Gendreau, M., Gueret, C. and Medaglia, A.L.
(2013). A Review of Dynamic Vehicle Routing
Problems. European Journal of Operational Research
225(1): 1-11.
Psaraftis, H., Wen, M. and Kontovas, C. (2016). Dynamic
Vehicle Routing Problems: Three Decades and
Counting. NETWORKS, Vol. 67(1), 3–31.
PTV AG. (2024). VISSIM Version 2024. Karlsruhe,
Germany: Available at https://www.ptvgroup.com/de/
loesungen/produkte/ptv-vissim/.
Tang, Q. and Armellini, M.-G. (2021). An Ant Colony
Algorithm with Penalties for the Dial-a-ride Problem
with Time Windows and Capacity Restriction. In 7th
IEEE International Conference on Models and
Technologies for Intelligent Transportation Systems
(MT-ITS), pp. 425-429.
Thomsen, N. (2023). Implementing a Ride-sharing
Algorithm in the German National Transport Model
(DEMO). Transportation Research Record: Journal of
the Transportation Research Board, Vol. 2677(5), 1–10.
Integration of On-Demand Ride-Pooling into a Microscopic Traffic Flow Simulation Environment
513
