
An OGI Based Unattended Natural Gas Leak Detection System by
Utilizing the Power of Machine Learning and Computer Vision
Hritu Raj
a
and Gargi Srivastava
b
Rajiv Gandhi Institute of Petroleum Technology, in Jais, Amethi, Uttar Pradesh, India
Keywords:
Natural Gas, Optical Gas Imaging, Gas Leak, Convolutional Neural Network, Computer Vision, Climate
Change.
Abstract:
In a climate-constrained future, reducing natural gas emissions is essential to prevent undermining the envi-
ronmental benefits of using natural gas over coal. Although optical gas imaging (OGI) is widely used for
detecting natural gas leaks, it is often time-consuming and relies on human intervention for leak identifica-
tion. This study presents an operator-less solution for automated leak detection using convolutional neural
networks (CNNs). Our approach utilizes a dataset of natural gas leaks to train a CNN model for automated
plume recognition. We begin by gathering 32 video clips labeled with gas leaks from the FLIR dataset, which
covers a variety of leak sizes (50-1800 g/h) and video capture distances (4.2-18.3 m) .Two background re-
moval techniques were applied to isolate the gas plumes. A modified CNN model, trained with a combination
of natural gas and smoke images from Kaggle, was then used to detect the plumes in the video frames. Our
trained model was evaluated against other algorithms based on optical flow, showing impressive performance.
Our CNN model achieved an accuracy of 99% in detecting medium/large leaks and 94% for small leaks. This
approach offers a promising method for high-accuracy natural gas leak identification in real-world OGI as-
sessments.
1 INTRODUCTION
Natural gas is a significant energy source, contribut-
ing 36.1% to America’s energy output in 2023 (EIA,
2024). Its extraction has increased due to mod-
ern, low-cost drilling methods (Shakya et al., 2022),
and the growing demand for gas-operated energy and
heating facilities (Khallaghi et al., 2020) further inte-
grates it with electricity generation systems. The rise
in natural gas usage and production is partly driven
by increased demand for heating in homes and busi-
nesses (Li et al., 2021), contributing to a reduction
in coal dependence for electricity generation, which
has decreased from 14.63% in 2019 to 12.7% in 2023
(FAQs, 2024). However, the environmental impact
of natural gas is controversial (Brehm, 2019). While
it has a lower environmental impact than coal when
burned, it has a higher global warming potential if
released without combustion, being 36 times more
harmful than coal (GWP, 2023). Gas leaks from the
oil and gas sector have been under-reported (Alvarez
et al., 2018), and irregular large sources may account
a
https://orcid.org/0000-0002-4907-8314
b
https://orcid.org/0000-0001-6770-561X
for a significant portion of emissions (Vaughn et al.,
2018). Notably, the top 5% of leaks are responsible
for 50-60% of total emissions (Brandt et al., 2016).
Regular gas leak detection is required for power
plants in the U.S. and Canada. Leak detection and
localization (LDAR) often use EPA Method 21 or in-
frared optical gas imaging (OGI) (Method21, 2023).
Despite OGI’s effectiveness, challenges remain, in-
cluding high labor costs, impracticality for continu-
ous monitoring, and inconsistent results due to opera-
tor skill (Ravikumar et al., 2018), (Yuan et al., 2017).
To address these issues, this research uses con-
volutional neural network (CNN)-based algorithms to
analyze infrared imagery for automatic methane leak
detection. This approach eliminates the need for hu-
man intervention and could enable automated detec-
tion. Few automatic systems are available, and com-
prehensive studies of their limitations and potential
applications are lacking.
Our process for automated leak detection includes
five phases: constructing a dataset with annotated
clips of gas leaks of varying sizes and conditions;
training a CNN to detect leaks in video frames; test-
ing background removal techniques; evaluating the
Raj, H. and Srivastava, G.
An OGI Based Unattended Natural Gas Leak Detection System by Utilizing the Power of Machine Learning and Computer Vision.
DOI: 10.5220/0013345600003905
In Proceedings of the 14th International Conference on Pattern Recognition Applications and Methods (ICPRAM 2025), pages 823-830
ISBN: 978-989-758-730-6; ISSN: 2184-4313
Copyright © 2025 by Paper published under CC license (CC BY-NC-ND 4.0)
823

accuracy of automated detection under different con-
ditions; comparing the CNN model with traditional
optical flow techniques; and computing detection ac-
curacy from various distances for different leak sizes.
2 RELATED WORK
2.1 Optical Gas Imaging
As mentioned above, OGI technique encounters sev-
eral challenges. (1) The effectiveness of OGI is sig-
nificantly impacted by the imaging range (Ravikumar
et al., 2017). Imaging at a distance greater than ten
meters significantly decreases OGI’s efficiency. (2)
Environmental factors like wind direction, tempera-
ture, and speed differences also play a role. Only a
few commercial devices can be used for automated
leakage detection with camera footage. With the help
of ExxonMobil Research Qatar and Providence Pho-
tonics, an attachment for the FLIR Gas camera was
developed for unsupervised remote monitoring of nat-
ural gas plumes(Abdel-Moati et al., 2013). Another
firm, Rebellion Photonics, provides real-time detec-
tion using a hyper-spectral vision sensor that can dif-
ferentiate between various gaseous molecules. (4)
Detection results from conventional infrared cameras
are purely qualitative. Hyperspectral infrared cameras
can measure leak flow by monitoring uninterrupted
spectral information for every pixel’s intensity. The
difference between RGB and thermal images is shown
in Figure 1.
2.2 Smoke Detection
Scientists in computer vision and image processing
have produced numerous articles on smoke detection.
Similarities between natural gas plumes and smoke
can be seen in their ethereal quality, ability to spread,
and erratic movement. While thermal sensors are
used to image hydrocarbon plumes, visual spectrum
sensors capture smoke in all its colors. Color models,
change identification, pattern analyses, and machine
learning approaches (Hsu et al., 2018) are popular
methods for detecting smoke emissions. We will eval-
uate and compare these models. Color modeling is
based on the saturation or distribution of intensity val-
ues in an image. Reduced color saturation helps de-
tect smoke pixels. (2) Motion recognition techniques
identify movements or changes. The entropy of op-
tical flows has been examined, and dazzling pixels
used to outline edges. (3) Texture detection utilizes
wavelet transform and other parameters to extract fea-
ture vectors, which are then used for classification
(Ye et al., 2015). (4) Machine vision approaches for
smoke detection are also explored, including CNNs
(Frizzi et al., 2016).
2.3 Machine Learning
The environmental and energy-related applications of
deep learning are numerous, in the field of wind en-
ergy, solar energy, energy cost predictions, etc. How-
ever, research on deep learning for natural gas leak
detection is limited.
This article uses deep learning techniques to an-
alyze images of natural gas leaks captured by Gas
cameras. For tasks like object identification, voice
recognition, video classification, etc., deep learning
automatically extracts features from the dataset, un-
like standard machine learning algorithms that rely
on human-created attributes. In deep learning, sev-
eral layers are used, where the first few layers learn
basic features like points, edges, and curves, while
higher-level layers learn more complex characteris-
tics. Convolutional Neural Networks (CNNs) are
effective in image recognition and object classifica-
tion, with models like Resnet, VGG-16, and Alexnet
(Szegedy et al., 2015). Despite differences, these
models share a common structure with an Input layer,
multiple hidden layers, and an output layer. Pool-
Convolution layers are typically used in the hidden
layers, where convolution operations are followed by
subsampling in the pooling layer, reducing data di-
mensions. The final output layer, often fully con-
nected, computes the regression result or classifica-
tion score for each class.
3 DATASET
To train a deep learning network, CNNs need a huge
amount of data. To deploy CNN to the problem
of identifying natural gas leakage, we have started
assembling a big dataset, which contains annotated
footage of natural gas leaks from a variety of leak-
ing sources, including a broad range of plume sizes.
Various environmental circumstances, camera angles,
and imaging distances were used to film these videos,
giving a comprehensive representation of the whole
spectrum of possible leak situations. The categoriza-
tion based on 6 leak sizes and 5 imaging distance are
shown in Figure. 2 and Figure. 3.
Optical Gas Imaging camera is the basic require-
ment of this research, and the cost of these cam-
eras are too high. Thus, we have taken the support
of the FLIR website for building our dataset. We
have gathered 32 clips of natural gas leak from FLIR-
ICPRAM 2025 - 14th International Conference on Pattern Recognition Applications and Methods
824
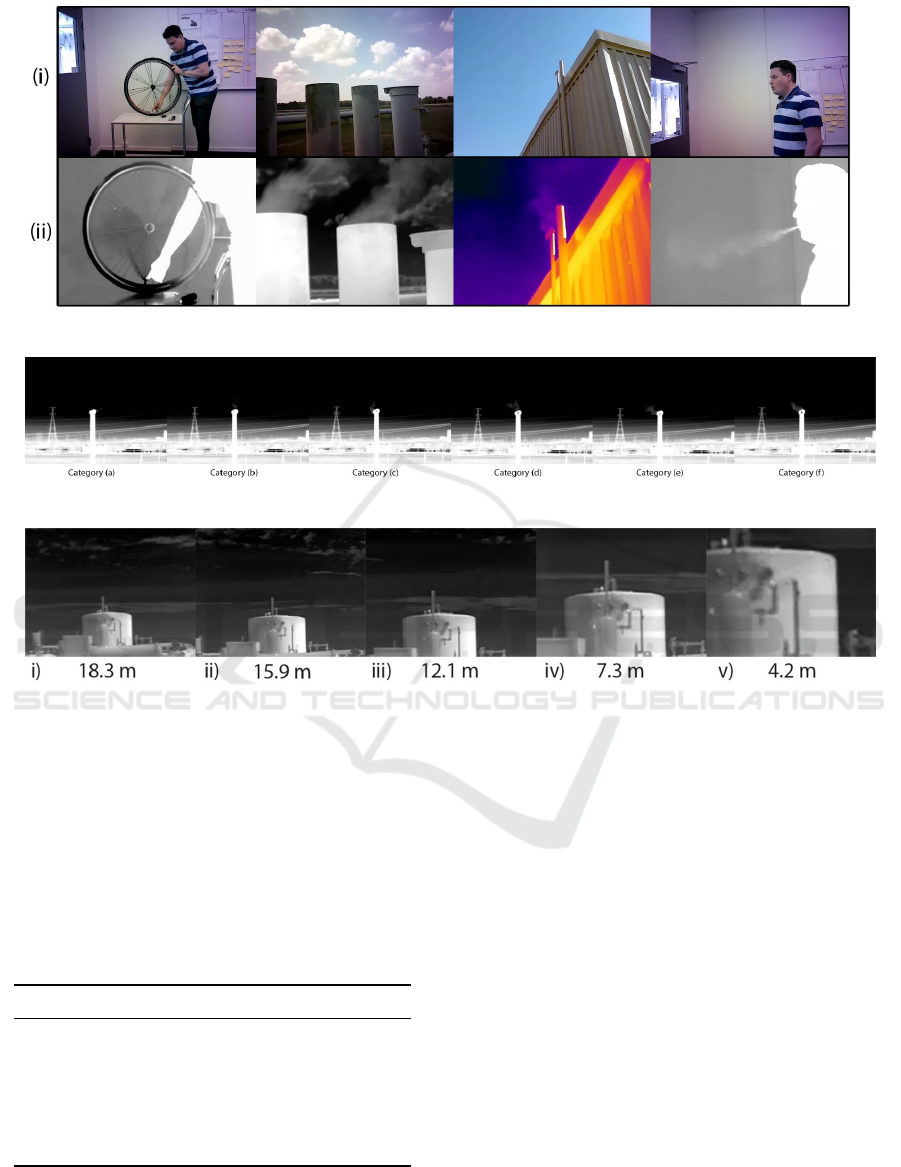
Figure 1: (i) Image taken from RGB camera and (ii) Image taken from FLIR gas imaging camera.
Figure 2: Leak size categorization (a to f).
Figure 3: Footage taken at five imaging distances.
Conservator website. Then random 32000 frames are
extracted for training the models. In this dataset we
have also incorporated smoke dataset (Fire, 2024) to
train for very large leak rates from longer distances.
Hence, our dataset contains 837 images from smoke
dataset and 32k frames gathered from FLIR conser-
vator website (FLIR, 2024). The dataset is divided
in 6 categories according to their leak sizes shown in
Table 1.
Table 1: Categorization of dataset based on leak sizes.
Leak Type Leak Rate gr/h Leak Size
Category a 0-100 barely visible
Category b 101-500 very low
Category c 501-800 low
Category d 801-1200 moderate
Category e 1201-1600 high
Category f 1601 or greater very high
Vegetation, steam, and vapor are all real-world
phenomena that are not considered in our dataset.
In addition, even at the lowest imaging distance, the
greatest leak should not fill the whole field of view
captured by the image sensor. In the future, research
may be conducted considering these standards.
4 METHODOLOGY
An explanation of how our automated detection sys-
tem works is provided below. Our CNN model is in-
troduced, together with an image normalization tech-
nique and two new strategies for removing back-
grounds. Our explanation of the CNN model is like-
wise quite detailed. And last, we propose a non-CNN
baseline model that we may use to evaluate our out-
comes.
4.1 Workflow
With 6 different binary classification situations, the
automatic OGI-based technique gives a probability
curve of proper assessment (a systematic technique to
test the technology’s effectiveness). A picture may be
An OGI Based Unattended Natural Gas Leak Detection System by Utilizing the Power of Machine Learning and Computer Vision
825
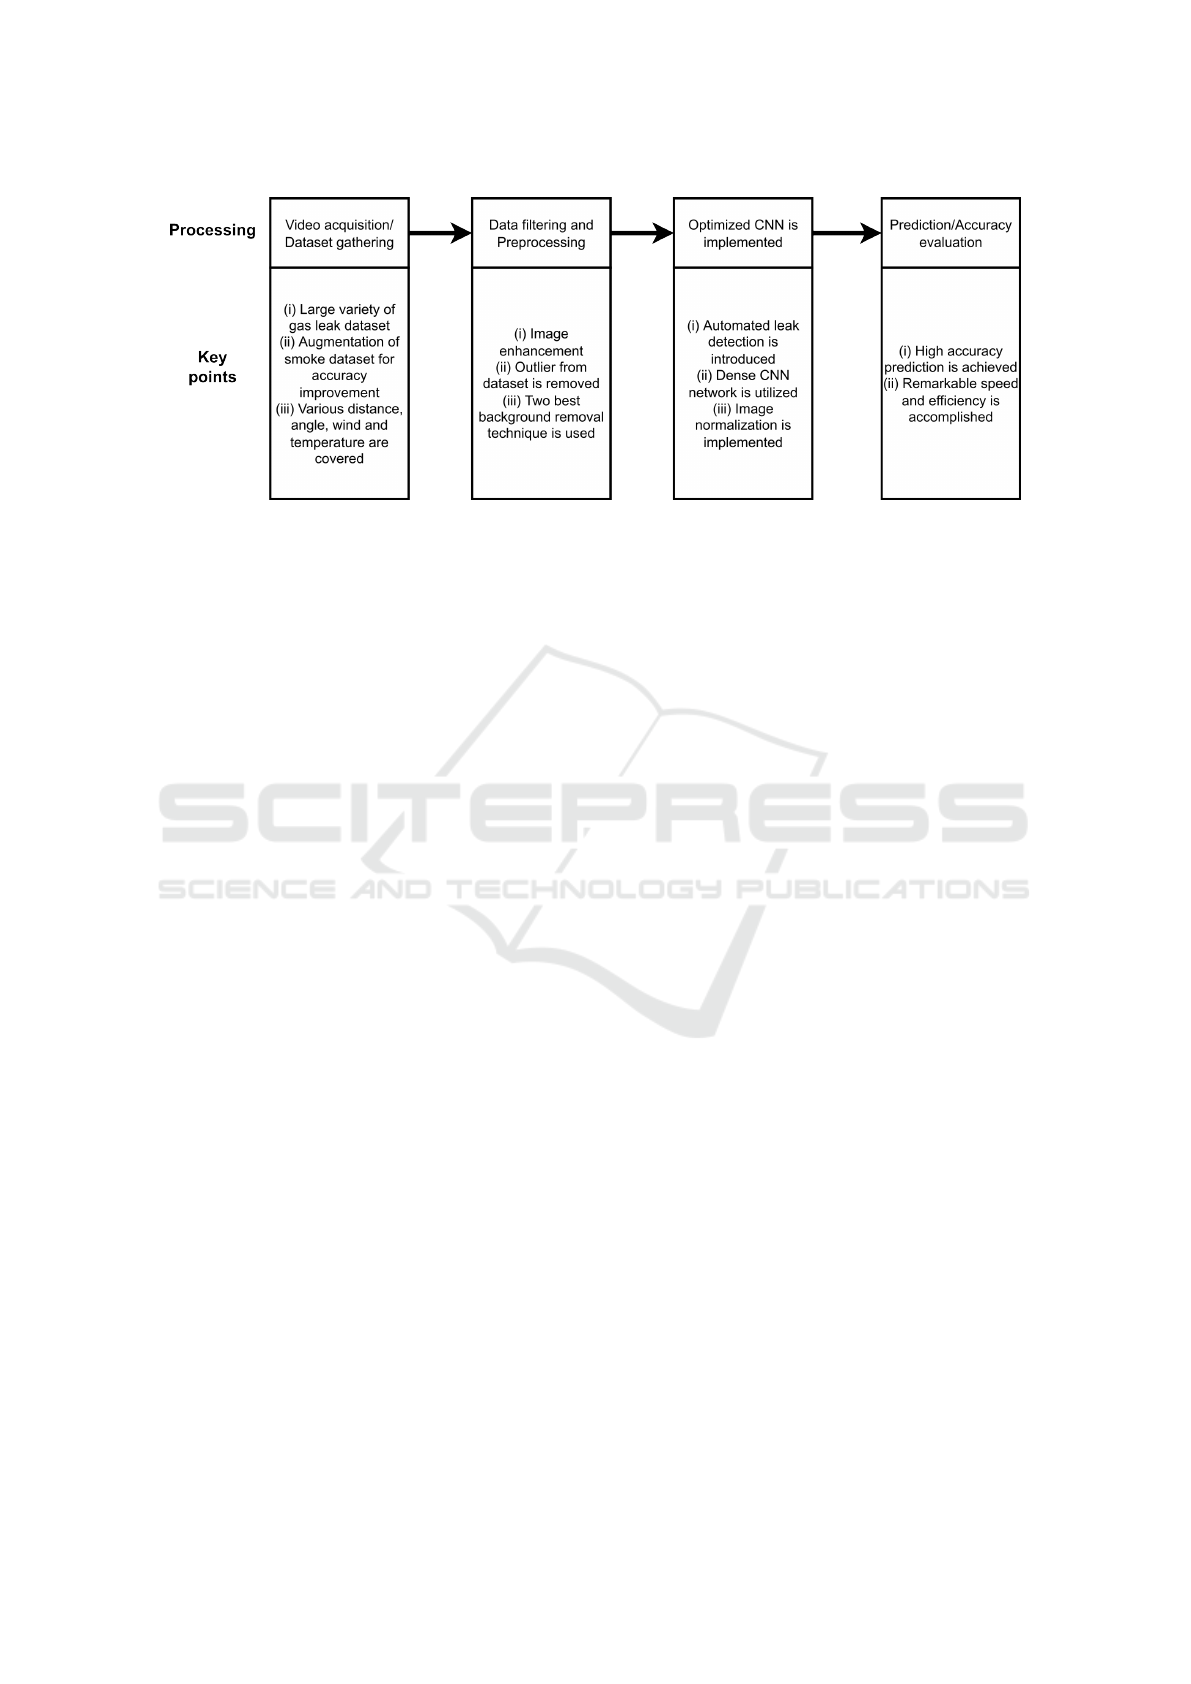
Figure 4: Processing steps and key points of the developed model.
placed into one of two categories using binary classifi-
cation: either non-leak or leak image belonging to any
of the 6 leak categories. This is done for all 5 imag-
ing distances. Therefore, in our baseline scenario, we
have 20 instances that each reflect the binary classi-
fication performance outcomes of 20 separate trained
trials conducted at various distances from the camera
and with varying leak sizes. Twenty individual train-
ing experiments are all carried out in the same man-
ner. First, still images are taken out from videos and
paired with their corresponding class names. Back-
ground removal and picture normalization are used
to prepare the retrieved images for further process-
ing. Each refined image is then fed into a trained
convolutional neural network detection module. Fi-
nally, the percentage of properly detected frames by
the algorithm is used to determine the accuracy of
the predicted output. Data collection, image prepa-
ration (normalization and background removal), de-
ployment of machine learning algorithms, and analy-
sis of the probability distribution curve are all shown
in Figure. 4. We will also go through how our re-
search adds new insights to each procedure.
4.2 Background Subtraction
Background removal helps isolate the plume for de-
tailed inspection. While perfect background removal
would leave only the plume, real-world methods
often retain some non-plume elements. We com-
pare two background removal techniques—Mixture
of Gaussians (MOG) and Gaussian Mixture Model
(GMM)—against a baseline with no background re-
moval. To perform background subtraction, we fuse
frames from the no-leak category to create a static
background for the leaked footage. For the fixed
background scenario, all leak frames share the same
background. A moving average of the last 150 frames
is used to compute a static background for each
frame. This method helps emphasize the gas cloud’s
variation by removing long-term background fluctu-
ations. GMM background subtraction uses Gaus-
sian distribution-generated pixel intensities (OpenCV,
2024), and an adaptive mixing algorithm determines
the optimal number of Gaussian distributions for each
pixel (Zivkovic and Heijden, 2006). Both background
removal techniques yield nearly identical foreground
images, as shown in Figure 5.
4.3 Image Normalization
A vital stage in deep learning, image normalization
which ensures that all input images have a uniform
pixel intensity distribution, allowing training algo-
rithms to converge more quickly than they would with
non-normalized data. The frames in our gas leak
datasets are normalized by dividing each pixel by 255.
4.4 CNN Model
In this work, we use convolutional neural network
(CNN) for making a clear distinction between leak
imagery and other types of imagery using binary leak
classification. Our CNN framework is built using
standard procedures for creating CNN models. The
data that are sent into the network are processed by a
series of fully connected layers and a variety of Con-
vPool components. There is a convolutional layer,
a batch normalization layer, a Rectified Linear Unit
(ReLU) transfer function, a dropout regularization
layer, and a max pooling layer in every ConvPool
structure. Three-by-three-pixel filters are combined
with the source frames in the convolutional layer. By
using batch normalization after convolution, model
training times are reduced while robustness is im-
proved. Nonlinearity is brought into the network via
the ReLU function (Nair and Hinton, 2010). With
dropout, neurons are replaced or destroyed at ran-
ICPRAM 2025 - 14th International Conference on Pattern Recognition Applications and Methods
826
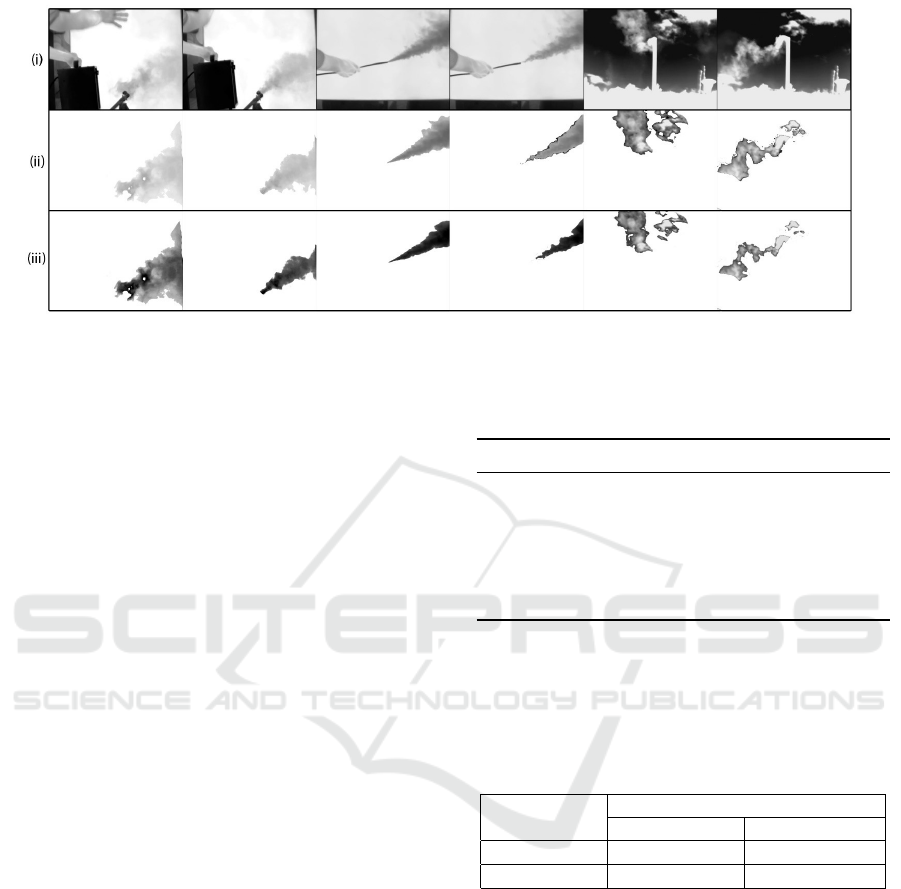
Figure 5: Background subtraction (i) Raw Image from FLIR camera, (ii) Subtraction using MOG and (iii) Subtraction using
GMM.
dom during training as a kind of regularization (Hin-
ton et al., 2012). It can help with stopping the CNN
against overfitting. To decrease the size of the spatial
frame presentation, the number of network parame-
ters, and the amount of computation required, 2 by 2
max pooling is used (Ciregan et al., 2012). The first
and second layer contain 8 and 16 filters respectively.
This processed input frame then goes through two
further fully connected layers, one after the other, fol-
lowing the two Conv-Pool structures. There are 3600
neurons in the first layer, and 48 neurons in fully con-
nected layer give outputs for 2 categories (leak and
non-leak). Next, two probability scores, one for each
of two classes, are generated using a SoftMax func-
tion, and the predicting label is calculated 0 (non-
leak) and 1 (leak) shown in Figure. 6.
4.5 Model Setup
The learning rate for each factor is computed using
the Adam optimizer (Ruder, 2016), an enhancement
to stochastic gradient descent.
Experiment-specific training, validation, and test-
ing datasets are shown in Table 2. The model is devel-
oped with the help of training data, hyperparameters
are tuned using validation data, bias and variance are
balanced with test data, and accuracy is reported using
test data. 70% of the dataset from the second separa-
tor is used for training, while the remaining 30% is
used for validation. The testing data are not included
in the training data of the CNN classifier, and those
are taken from different footage with different light-
ing conditions.
Table 3 shows how accuracy is calculated by cal-
culating up the percentage of accurate binary leak and
non-leak guesses (the total of the true negative and the
true positive proportion over all data for testing). For
each precision, we also determine its associated error.
Table 2: Data distribution for training, testing, and valida-
tion.
Frames
Distance (m) Training Testing Validation
4.2 4000 1500 500
7.3 4000 1600 600
12.1 4000 1700 700
15.9 4000 1800 800
18.3 4000 1900 900
The size of the test dataset required a random 10-fold
partitioning. Every fold in the test set is put through
the testing procedure with the same best-trained clas-
sifier, yielding best accuracy scores.
Table 3: Method for accuracy calculation used in this re-
search.
PREDICTED
ACTUAL No-Leakage Leakage
No-Leakage True Negative False Negative
Leakage False Positive True Positive
4.6 Baseline Model Method
We have created a non-deep learning approach so that
we can compare its accuracy with our developed CNN
model. Our detection accuracy benchmark for natu-
ral gas plumes is based on optical flow analysis. Be-
tween two frames, optical flow calculates how fast
an item seems to be moving in the scene (OpenCV,
2024). Specifically, the dense optical flow method
developed by Gunner Farneback is used to calculate
optical flow at each pixel in the picture (Farneb
¨
ack,
2003). Areas with noticeable motion will be labelled
as potential plume locations. Using the same config-
uration for training, testing and validation dataset as
deep learning-based methods, the baseline approach
An OGI Based Unattended Natural Gas Leak Detection System by Utilizing the Power of Machine Learning and Computer Vision
827
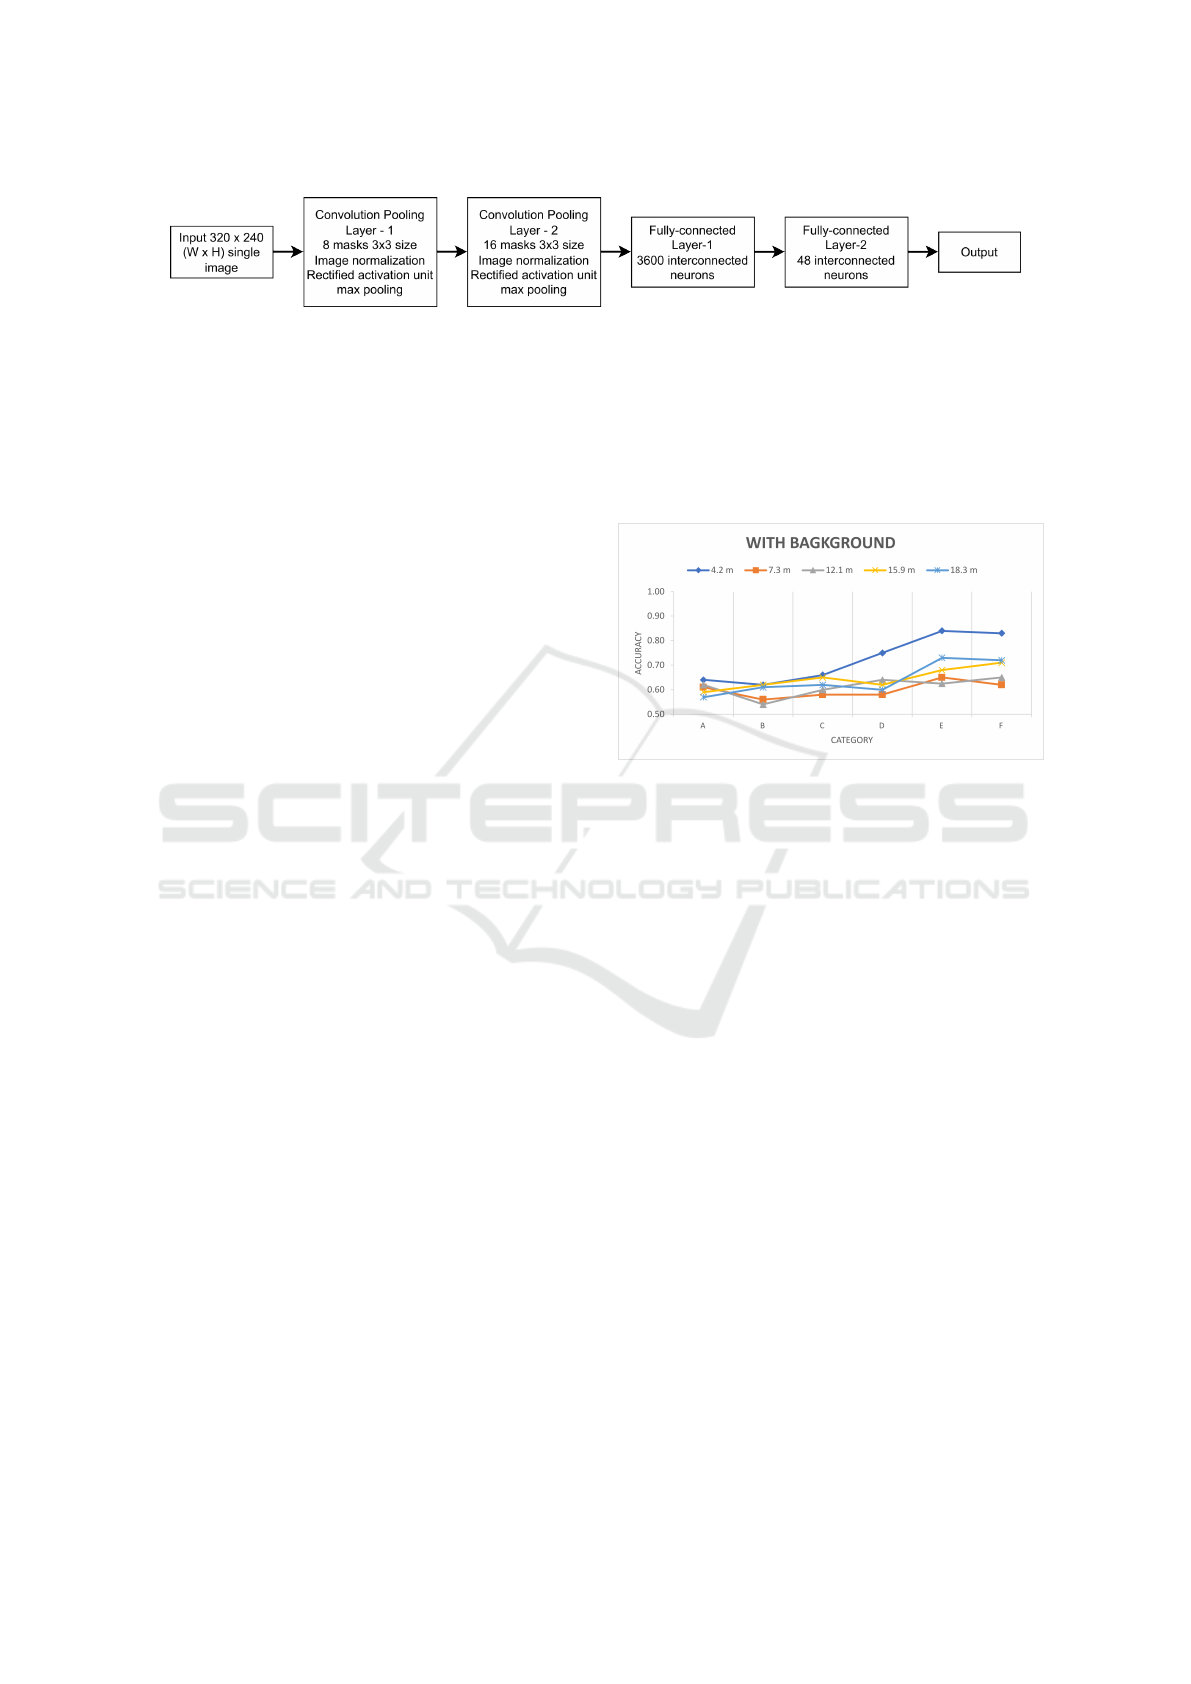
Figure 6: Proposed CNN architecture.
first applies the MOG background removal technique.
The procedure for the baseline technique consists of
four stages:
• Gunner Farneback’s method is tuned using the
training data such that the relocating areas visu-
ally correspond to the plume area.
• As a further step, we do a threshold analysis and
arrive at two separate cutoffs. First, there is a line
defined by the size of the movement (MMT). We
classify a pixel as in motion if its estimated move-
ment speed is greater than the MMT. It is pre-
sumed that any pixels in motion are plume pix-
els. Next is the plume area threshold (PAT). A
leak plume is present in a picture if PAT is less
than the count of moving particles, whereas the
absence of a leak plume is indicated if the plume
size is lower than the PAT. This is done by ana-
lyzing the training data’s distributions of motion
speeds and plume regions to establish a set of ex-
plorable thresholds.
• The validation set is used to iteratively exam-
ine the training data set footage for occurrences
of MMT and PAT within each of the ranges ob-
served. During testing, we look for the threshold
that yields the best accuracy rate in the validation
set and choose that one.
• The accuracy results of our leak category out-
put on the dataset used for testing using the best
threshold pair are reported.
5 RESULTS AND DISCUSSION
The findings of our implemented method are shown
below for the 6 different classifications for leak or no-
leak, each of which was carried out over five differ-
ent imaging distances. The accuracy of predicted out-
put is shown along the horizontal axis, beginning at
0.5, for each scenario. A randomly guessing method
(tossing a coin) allocating frames to leak and non-leak
states, given that we have tested each approach over a
collection of leak or non-leak (50-50%) data.
First, we look at how removing the background
effects the performance of our model, relative to a
complex CNN architecture. We conduct a sensitiv-
ity study on the robustness of CNN model in the next
set of data.
Results generated using two different background
removal algorithms.
Firstly, we have checked the performance of back-
ground removal approach keeping the complexity of
the CNN model constant.
Figure 7: Detection accuracy of proposed model without
background removal.
The diagram processed with the CNN algorithm
and two distinct background reduction techniques. At
the nearest capturing distance (4.2 m), larger leak
sizes often lead to increased likelihood of correct
evaluation when using the dataset keeping the back-
ground constant (Figure. 7). Maximum accuracy was
82% (percentages are rounded to the closest integer
since the typical value for standard deviation is be-
low 2%). As all values of the standard deviation are
below 2.0%, which indicates that there is no varia-
tion in the trained CNN’s performance over the train-
ing dataset with 10-folds. Videos captured 4.2 meters
from the leak source have a plume that fills most of the
frame, while non-leak footage include mostly the sky
backdrop, making binary classification possible even
without the need to remove the sky from the scene.
However, when distance and leak size decrease, per-
formance soon deteriorate to near random chance.
As can be seen in Figure. 8, the accuracy of Gaus-
sian mixture model approach is greater than that of
the fix background method. All 6 possible leak com-
binations have an accuracy of more than 82% at 4.2
m, while at 7.3 m, the accuracy of distinguishing be-
tween non-leak and leak class for C, D and E is greater
than 96%. The accuracy may go up to 99% in these
two scenarios. The gap between the curves for 12.1 m
ICPRAM 2025 - 14th International Conference on Pattern Recognition Applications and Methods
828
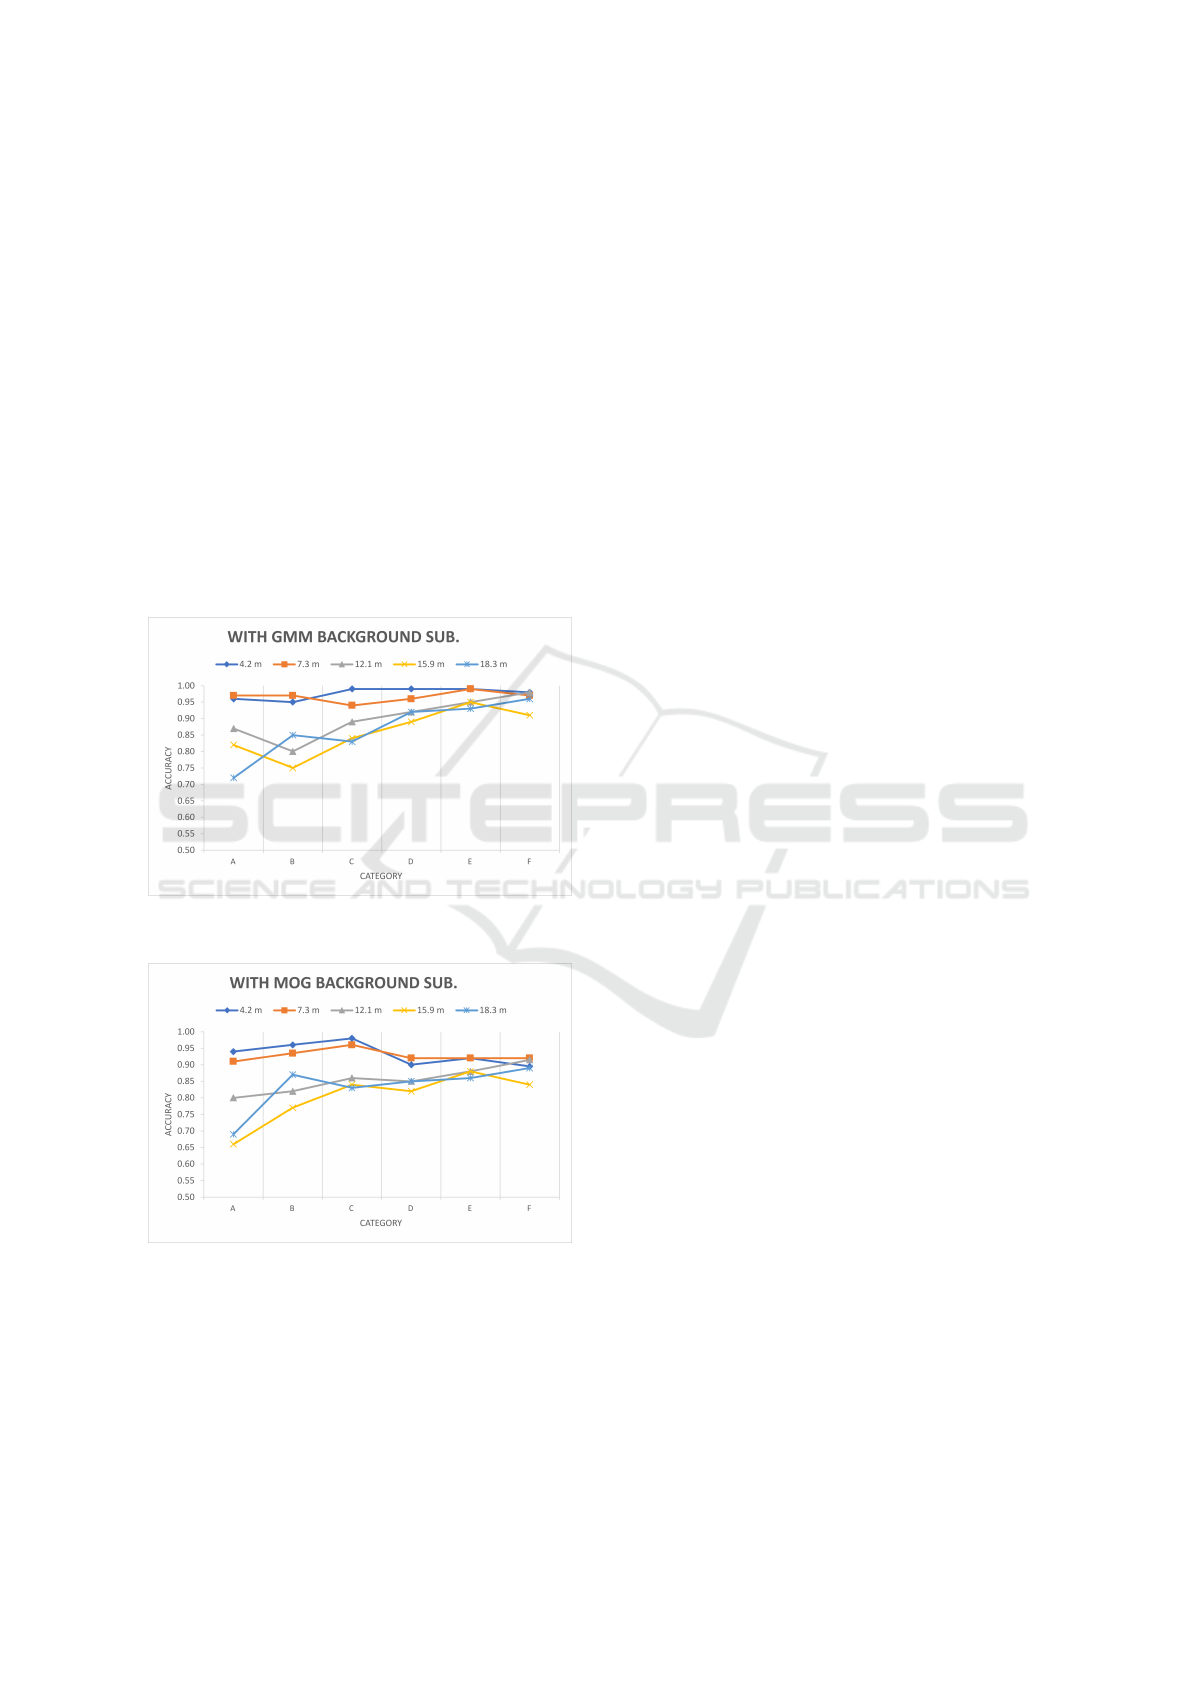
and 15.9 m is much larger. Classification accuracy for
determining leak vs non-leak situations is more than
90% at these distances for classes C, D and E. Except
for the leak class 1 instance at the furthest distance,
all 30 cases had standard deviations of less than 1.6%
throughout the 10 test dataset folds.
Figure. 9 shows that when compared to static
background, MOG-based background subtraction
turns out better, although it still lags behind GMM
mode. MOG and GMM approaches perform similarly
in the two closest observations (capturing distance of
4.2 m and 7.3 m). At imaging distances greater than
10 meters, the accuracy disparity between the two ap-
proaches rises. The MOG-based background subtrac-
tion approach has an average accuracy 2.7%, 3.5%,
and 6.2% poorer than the Gaussian mixture model
subtraction method at distances of 12.1 meters, 15.9
meters, and 18.3 meters, respectively.
Figure 8: Detection accuracy of proposed model with back-
ground removal using GMM.
Figure 9: Detection accuracy of proposed model with back-
ground removal using MOG.
To the greatest extent, the success of automatic
OGI-based techniques depends on the capturing dis-
tance. Our findings reveal that when imaging distance
rises, there is a general downward change in the curve
indicating assessment accuracy across 6 categories of
leak and non-leak. When the capturing distance is
larger, there seem to be fewer plume pixels available
for utilization. Detection accuracy drops dramatically
for the tiniest leakage over greatest distances.
It is important to note that the CNN model predic-
tion results reported in this research for the automatic
OGI-based detection techniques are not like the detec-
tion accuracy findings achieved for the OGI technol-
ogy in past work that was run by humans. We cannot
conclude that the algorithm is not as proficient as a
person at spotting leaks. Two main factors contribute
to this discrepancy is the human can use the highly
sensitive settings of the OGI camera, which is much
responsive to even poor movement of tiny leakage
than the standard settings used in our research. The
existence of hydrocarbon leak was defined by moni-
toring a leak footage, whereas in this study, we ana-
lyzed individual frames.
6 CONCLUSION AND FUTURE
SCOPE
This study demonstrates the use of computer vision
and deep learning techniques to automate natural gas
leak detection with high accuracy. Using publicly
available gas leak footage from the FLIR conserva-
tor website, we successfully tested our system. By
integrating background removal with a CNN-based
model, we identified leaks without needing a back-
ground image. The CNN model outperforms tradi-
tional leak detection methods. Our model achieves
detection accuracy of up to 99%, especially over long
distances with reduced complexity.
The accuracy of the algorithm depends on cam-
era factors such as imaging range, temperature dif-
ference, and background motion. In future work, we
plan to explore other model designs, including time-
series models to track hydrocarbon leaks and plume
movement. Given the numerous environmental vari-
ables affecting plume dispersion, combining physical
models with machine learning could improve detec-
tion accuracy. These models could also help estimate
the volume flux of gas plumes.
The use of ML-powered Optical Gas Imaging
technology could reduce costs and speed up leak de-
tection by installing it on survey trucks or surveillance
cameras in leak-prone areas.
REFERENCES
Abdel-Moati, H. M., Morris, J. M., Ruan, Y., and Zeng, Y.
(2013). Remote gas detection system using infrared
An OGI Based Unattended Natural Gas Leak Detection System by Utilizing the Power of Machine Learning and Computer Vision
829

camera technology and sophisticated gas plume detec-
tion computer algorithm. Proceedings - SPE Annual
Technical Conference and Exhibition, 6:4183–4193.
Alvarez, R. A., Zavala-Araiza, D., Lyon, D. R., Allen, D. T.,
Barkley, Z. R., Brandt, A. R., Davis, K. J., Herndon,
S. C., Jacob, D. J., Karion, A., Kort, E. A., Lamb,
B. K., Lauvaux, T., Maasakkers, J. D., Marchese,
A. J., Omara, M., Pacala, S. W., Peischl, J., Robinson,
A. L., Shepson, P. B., Sweeney, C., Townsend-Small,
A., Wofsy, S. C., and Hamburg, S. P. (2018). Assess-
ment of methane emissions from the u.s. oil and gas
supply chain. Science, 361:186–188.
Brandt, A. R., Heath, G. A., and Cooley, D. (2016).
Methane leaks from natural gas systems follow ex-
treme distributions. Environmental Science and Tech-
nology, 50:12512–12520.
Brehm, P. (2019). Natural gas prices, electric generation
investment, and greenhouse gas emissions. Resource
and Energy Economics, 58:101106.
Ciregan, D., Meier, U., and Schmidhuber, J. (2012). Multi-
column deep neural networks for image classification.
Proceedings of the IEEE Computer Society Confer-
ence on Computer Vision and Pattern Recognition,
pages 3642–3649.
EIA (2024). U.s. energy facts explained - consumption
and production - u.s. energy information administra-
tion (eia).
FAQs (2024). Frequently asked questions (faqs) - u.s. en-
ergy information administration (eia).
Farneb
¨
ack, G. (2003). Two-frame motion estimation based
on polynomial expansion. In Bigun, J. and Gus-
tavsson, T., editors, Image Analysis, pages 363–370,
Berlin, Heidelberg. Springer Berlin Heidelberg.
Fire (2024). Fire and smoke dataset — kaggle.
FLIR (2024). Flir conservator.
Frizzi, S., Kaabi, R., Bouchouicha, M., Ginoux, J. M.,
Moreau, E., and Fnaiech, F. (2016). Convolutional
neural network for video fire and smoke detection.
IECON Proceedings (Industrial Electronics Confer-
ence), pages 877–882.
GWP (2023). Understanding global warming potentials —
us epa.
Hinton, G. E., Srivastava, N., Krizhevsky, A., Sutskever, I.,
and Salakhutdinov, R. R. (2012). Improving neural
networks by preventing co-adaptation of feature de-
tectors.
Hsu, Y.-C., Dille, P., Sargent, R., and Nourbakhsh, I.
(2018). Industrial smoke detection and visualization.
Khallaghi, N., Hanak, D. P., and Manovic, V. (2020).
Techno-economic evaluation of near-zero co2 emis-
sion gas-fired power generation technologies: A re-
view. Journal of Natural Gas Science and Engineer-
ing, 74:103095.
Li, N., Wang, J., Wu, L., and Bentley, Y. (2021). Predict-
ing monthly natural gas production in china using a
novel grey seasonal model with particle swarm opti-
mization. Energy, 215:119118.
Method21 (2023). Method 21 - volatile organic compound
leaks — us epa.
Nair, V. and Hinton, G. (2010). Rectified linear units im-
prove restricted boltzmann machines vinod nair. vol-
ume 27, pages 807–814.
OpenCV (2024). Opencv: Background subtraction.
Ravikumar, A. P., Wang, J., and Brandt, A. R. (2017).
Are optical gas imaging technologies effective for
methane leak detection? Environmental Science and
Technology, 51:718–724.
Ravikumar, A. P., Wang, J., McGuire, M., Bell, C. S., Zim-
merle, D., and Brandt, A. R. (2018). ”good versus
good enough?” empirical tests of methane leak detec-
tion sensitivity of a commercial infrared camera. En-
vironmental Science and Technology, 52:2368–2374.
Ruder, S. (2016). An overview of gradient descent opti-
mization algorithms.
Shakya, S., Li, B., and Etienne, X. (2022). Shale revolution,
oil and gas prices, and drilling activities in the united
states. Energy Economics, 108:105877.
Szegedy, C., Liu, W., Jia, Y., Sermanet, P., Reed, S.,
Anguelov, D., Erhan, D., Vanhoucke, V., and Rabi-
novich, A. (2015). Going deeper with convolutions.
Proceedings of the IEEE Computer Society Confer-
ence on Computer Vision and Pattern Recognition, 07-
12-June-2015:1–9.
Vaughn, T. L., Bell, C. S., Pickering, C. K., Schwiet-
zke, S., Heath, G. A., P
´
etron, G., Zimmerle, D. J.,
Schnell, R. C., and Nummedal, D. (2018). Temporal
variability largely explains top-down/bottom-up dif-
ference in methane emission estimates from a natural
gas production region. Proceedings of the National
Academy of Sciences of the United States of America,
115:11712–11717.
Ye, W., Zhao, J., Wang, S., Wang, Y., Zhang, D., and Yuan,
Z. (2015). Dynamic texture based smoke detection
using surfacelet transform and hmt model. Fire Safety
Journal, 73:91–101.
Yuan, M., Barron, A. R., Selin, N. E., al, Frank, S., Havl
´
ık,
P., Tabeau, A., Ravikumar, A. P., and Brandt, A. R.
(2017). Designing better methane mitigation poli-
cies: the challenge of distributed small sources in the
natural gas sector. Environmental Research Letters,
12:044023.
Zivkovic, Z. and Heijden, F. V. D. (2006). Efficient adap-
tive density estimation per image pixel for the task of
background subtraction. Pattern Recognition Letters,
27:773–780.
ICPRAM 2025 - 14th International Conference on Pattern Recognition Applications and Methods
830
