
Bus Arrival Time Prediction via Hybrid LSTM Using GPS-Derived
Run and Dwell Times
Aigerim Mansurova
a
, Aiganym Mansurova
b
and Aivar Sakhipov
c
Astana IT University, Mangilik El 55/11, Astana, Kazakhstan
Keywords: Public Transportation System, Bus Arrival Time Prediction, Long Short-Term Memory, GPS Trajectory Data,
Urban Traffic Conditions.
Abstract: Accurate bus arrival time prediction is essential for improving the reliability and efficiency of public
transportation systems. While existing models often rely on complex ensemble architectures or extensive
contextual data, this study explores a simplified approach using a hybrid Long Short-Term Memory (LSTM)
model. The model processes sequential features, such as stop IDs, run times, and dwell times, through LSTM
layers while integrating contextual information, such as trip start hour and day of the week, via dense layers.
Comprehensive experiments on GPS data from buses in Kandy, Sri Lanka, demonstrate the model’s superior
performance against state-of-the-art baselines. The proposed model achieves a Mean Absolute Error (MAE)
of 13.4 seconds, a Mean Absolute Percentage Error (MAPE) of 10.32%, and a Root Mean Square Error
(RMSE) of 24.26 seconds, significantly outperforming alternative methods.
1 INTRODUCTION
Public buses are an essential mode of transportation,
supporting daily commutes for work and leisure
(Levin, 2019). However, challenges like
overcrowding and irregular service schedules remain
prevalent. Accurate prediction of bus travel times is
crucial for intelligent transportation systems (ITS),
enabling enhanced service reliability, passenger
satisfaction, and operational efficiency. The advent of
Automatic Vehicle Location (AVL) systems has
marked a new era in analyzing travel time reliability.
These systems, which typically integrate GPS
technology and other location-tracking methods,
provide real-time vehicle position data with
timestamps, forming a foundational component of
Intelligent Transportation Systems (ITS). By
generating vast amounts of bus trajectory data, AVL
enables precise fleet tracking and monitoring. Despite
these advancements, discrepancies between
estimated and actual arrival times persist, impacting
service quality and passenger satisfaction.
Recent advancements in bus arrival time
prediction models have focused on enhancing
a
https://orcid.org/0009-0003-1978-9574
b
https://orcid.org/0009-0007-9076-0722
c
https://orcid.org/0000-0003-1045-4199
accuracy by decomposing total travel time into its
components—dwell time (time spent at stops while
passengers board and alight) and run time (time spent
traveling between stops) (Xie et al., 2021; Osman et
al., 2021). These efforts emphasize hybrid modeling
techniques and multi-model approaches to address
the complexities of urban traffic conditions.
Hybrid models have gained prominence for their
ability to leverage the strengths of different modeling
techniques. Yang et al. (2022) proposed a hybrid
approach combining Simple Moving Averages
(SMA) and Long Short-Term Memory (LSTM)
networks, treating dwell and run times as separate
prediction targets. This method significantly
improved accuracy, achieving a Mean Absolute
Percentage Error (MAPE) reduction to 23.45%.
Similarly, Zeng et al. (2019) developed a hybrid
LSTM model that integrates historical cruising
speeds with real-time traffic factors, demonstrating its
effectiveness in adapting to dynamic urban traffic
conditions.
Multi-model ensemble methods have also shown
promise. Petersen et al. (2019) utilized a multi-output
ensemble combining convolutional layers for spatial
514
Mansurova, A., Mansurova, A. and Sakhipov, A.
Bus Arrival Time Prediction via Hybrid LSTM Using GPS-Derived Run and Dwell Times.
DOI: 10.5220/0013349200003941
Paper published under CC license (CC BY-NC-ND 4.0)
In Proceedings of the 11th International Conference on Vehicle Technology and Intelligent Transport Systems (VEHITS 2025), pages 514-519
ISBN: 978-989-758-745-0; ISSN: 2184-495X
Proceedings Copyright © 2025 by SCITEPRESS – Science and Technology Publications, Lda.

feature extraction and LSTM layers for capturing
temporal dependencies. Although this model
outperformed single-step predictions, its
computational complexity posed challenges for real-
time applications. Ratneswaran and Thayasivam
(2023) further explored ensemble methods by
integrating ConvLSTM and XGBoost models, which
proved effective in high-variability traffic scenarios.
However, their reliance on fine-grained feature
engineering limited scalability.
The balance between simplicity and complexity in
model design is another central theme. Early studies
favored simpler methods, such as Kalman filters and
historical averages (Chien and Kuchipudi, 2003),
which remain advantageous for real-time or resource-
constrained settings. However, modern research leans
toward complex architectures, including hybrid and
ensemble models, to address the variability and
unpredictability of traffic conditions.
This paper contributes to the literature by offering
a simplified yet effective framework that directly
predicts bus arrival time using a hybrid LSTM model.
The approach eliminates the need for complex
ensemble architectures by utilizing data with travel
time components already divided into dwell times and
run times. Unlike the models that integrate external
factors such as traffic, passenger flow, or weather, our
approach relies solely on core travel time data. This
ensures adaptability in data-sparse environments
while maintaining real-time applicability and
computational efficiency.
The rest of the paper is structured as follows:
Section 2 provides a detailed explanation of the
proposed methodology, including an overview of the
data, feature engineering, the model development
process, as well as outlines the experimental design,
describing the evaluation metrics and baselines.
Section 3 presents the results, comparing the hybrid
model's performance with that of the baseline models.
Finally, Section 4 concludes the paper by
summarizing the findings, discussing practical
implications, and suggesting potential directions for
future research.
2 MATERIALS AND METHODS
2.1 Dataset
The dataset utilized in this study was obtained from
the AVL system installed on public buses operating
along Route No. 654 in Kandy, Sri Lanka, connecting
Kandy and Digana terminals with 30 bus stops. The
dataset comprises 14,128 recorded trips collected
over nine months, from October 1, 2021, to February
28, 2022. Bus location data was captured at a 15-
second sampling interval.
The raw GPS data, as provided by Ratneswaran
and Thayasivam (2023), was processed to obtain
segment (a route section between two consecutive bus
stops) running times and dwell times. To ensure a
robust dataset for analysis, data collection was
performed between 6:00 a.m. and 7:00 p.m., covering
morning and evening peak hours, moderate
congestion periods, and off-peak free-flow
conditions. This enables the study to capture
variations in travel time under different traffic
conditions, ensuring that the dataset reflects real-
world operational variability. The original data is
divided into three separate datasets, each stored as a
CSV file, as shown in Table 1.
Table 1: Structure of the original data.
Name Description Attributes
bus_trips_
654.csv
Trip-level
travel time
data
trip_id, deviceid,
start_terminal,
end_terminal,
start_time, end_time,
duration
bus_dwell
_times_65
4.csv
Stop-level
dwell time
data
trip_id, deviceid,
bus_stop, arrival_time,
departure_time,
dwell
_
time
_
in
_
seconds
bus_runni
ng_times_
654.csv
Travel time
between
consecutive
sto
p
s
trip_id, deviceid,
segment, start_time,
end_time,
run
_
time
_
in
_
seconds
bus_stops
_and_term
inals_654.
csv
Bus stop
locations and
route mapping
stop_id, route_id,
direction, address,
latitude, longitude
To prepare the dataset for use in this study,
essential data cleaning and feature engineering were
undergone. Stop locations, represented by the
variables ‘start_point’ and ‘end_point,’ were
engineered through the integration of data from the
bus dwell times and running times datasets. For each
trip, the initial terminal, either ‘T1’ or ‘T2,’ was
assigned based on the travel direction, and subsequent
stops were extracted from the dwell dataset. To
standardize their representation for use in machine
learning models, these stops were encoded into
numerical values using a label encoding technique.
Temporal features such as ‘start_hour’ and
‘day_of_week’ were engineered to capture time-
based patterns. The target variable, ‘travel_time’ was
calculated as the sum of ‘run_time_in_seconds’ and
‘dwell_time_in_seconds,’ representing the total trip
Bus Arrival Time Prediction via Hybrid LSTM Using GPS-Derived Run and Dwell Times
515
segment duration. Table 2 presents an overview of the
dataset, including attribute definitions and a sample
data entry.
Table 2: Dataset overview.
Attribute Description Example
id Unique record identifier 877965
trip_id Unique trip identifier 1
date Date of the trip 2021-10-01
deviceid
Unique bus device
identifie
r
262
direction Travel direction indicator 1
segment Route segment number 1.0
start_point Departure stop identifier T1
end_point Arrival stop identifier 101
start_time Start time of the segment 06:39:49
run_time_in
_
seconds
Time taken to travel
b
etween sto
p
s
69
dwell_time_
in_seconds
Time spent waiting at a
stop
74
arrival_time Arrival time at the stop 06:40:58
departure_ti
me
Departure time from the
sto
p
06:42:12
travel_time
Total travel time (run time
+ dwell time
)
143
For sequence-based analysis, multi-feature
sequences of stop IDs, running times, and dwell times
were created and padded to a fixed length to ensure
consistency for LSTM input.
The dataset was partitioned into training and
testing subsets, with 80% of the trips assigned to the
training set and the remaining 20% allocated to the
testing set. The split was performed in chronological
order.
2.2 Model Development
In this study, a hybrid machine learning model was
developed to predict travel time between successive
bus stops. The model was developed in Python
utilizing the Keras framework and trained with the
Adam optimizer. Sequential features, such as stop
IDs, running times, and dwell times, were processed
using a Long Short-Term Memory (LSTM) network,
leveraging its strength in modeling temporal
dependencies. Non-sequential features, including the
day of the week and trip start hour, were handled
through fully connected dense layers to capture
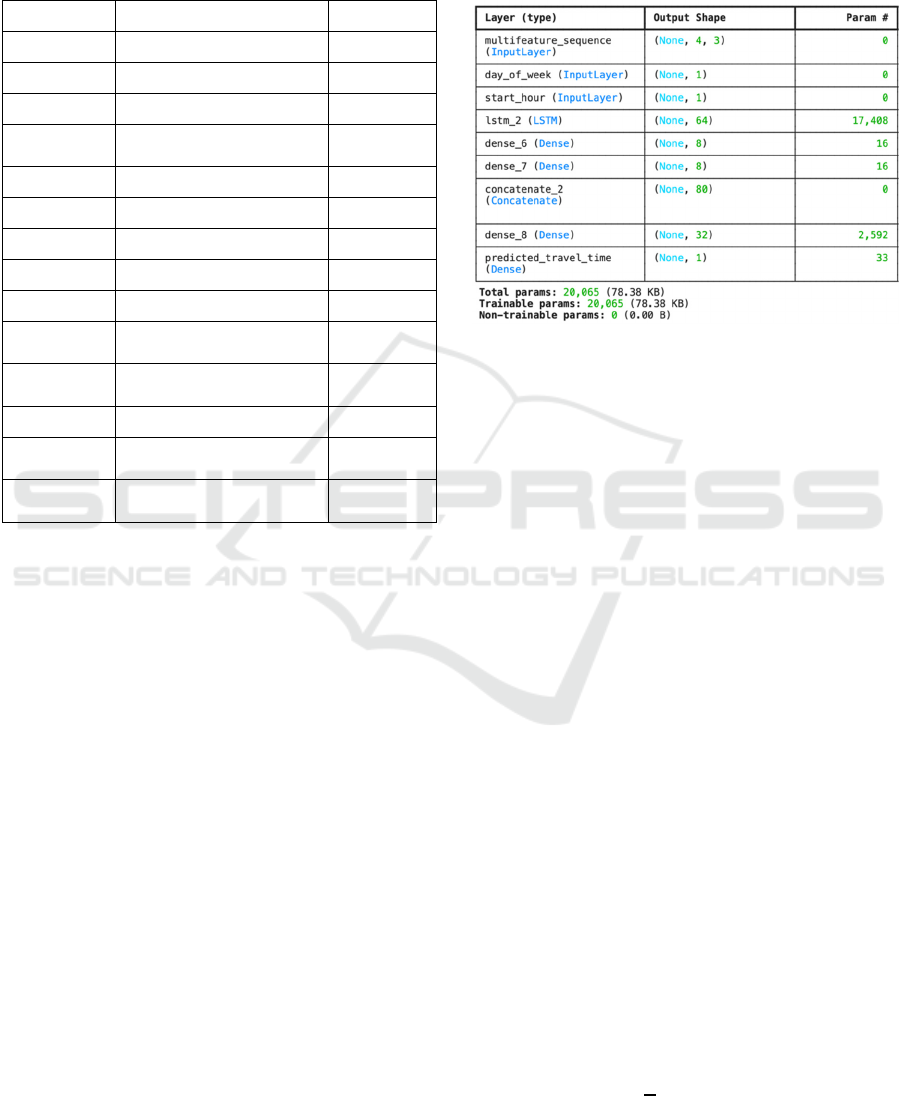
contextual information (see Figure 1). The dependent
variable in this study is bus segment travel time,
defined as the total duration required for a bus to
travel between two consecutive stops. The
architecture combined these processed inputs into a
unified representation, facilitating the modeling of
temporal and contextual aspects of travel time.
Figure 1: The layers of the proposed model.
Dropout layers and batch normalization were
incorporated to mitigate overfitting and enhance
model generalization. This integration of diverse
input types allows the model to achieve high accuracy
with minimal reliance on extensive feature
engineering.
2.3 Experiments
The feasibility of enhancing the accuracy of the bus
travel duration prediction between bus stops was
investigated using baselines including a multi-model
ensemble approach (Ratneswaran & Thayasivam,
2023), a ConvLSTM segment-based model (Xie et
al., 2021), an XGBoost segment-based model (Zhu et
al., 2022), a multi-model methodology integrating
ConvLSTM with Exponential Smoothing (Petersen et
al., 2019), and two standalone ConvLSTM models as
detailed in (Wu et al., 2020). All of these baselines
were evaluated on the same dataset in the work of
Ratneswaran and Thayasivam (2023).
The evaluation of the proposed model and the
baseline methods was conducted using three key
metrics: (1) Mean Absolute Error (MAE), (2) Mean
Absolute Percentage Error (MAPE), and (3) Root
Mean Square Error (RMSE). These metrics are
defined in equations (1) to (3), where 𝑦
indicates the
actual travel times, 𝑦
represents the predicted travel
times, and 𝑛 refers to the number of samples.
𝑀𝐴𝐸
1
𝑛
|
𝑦
𝑦
|
(1
)
VEHITS 2025 - 11th International Conference on Vehicle Technology and Intelligent Transport Systems
516
𝑀𝐴𝑃𝐸
1
𝑛
𝑦
𝑦
𝑦
∙ 100
(2)
𝑅𝑀𝑆𝐸
1
𝑛
𝑦
𝑦
(3)
3 RESULTS
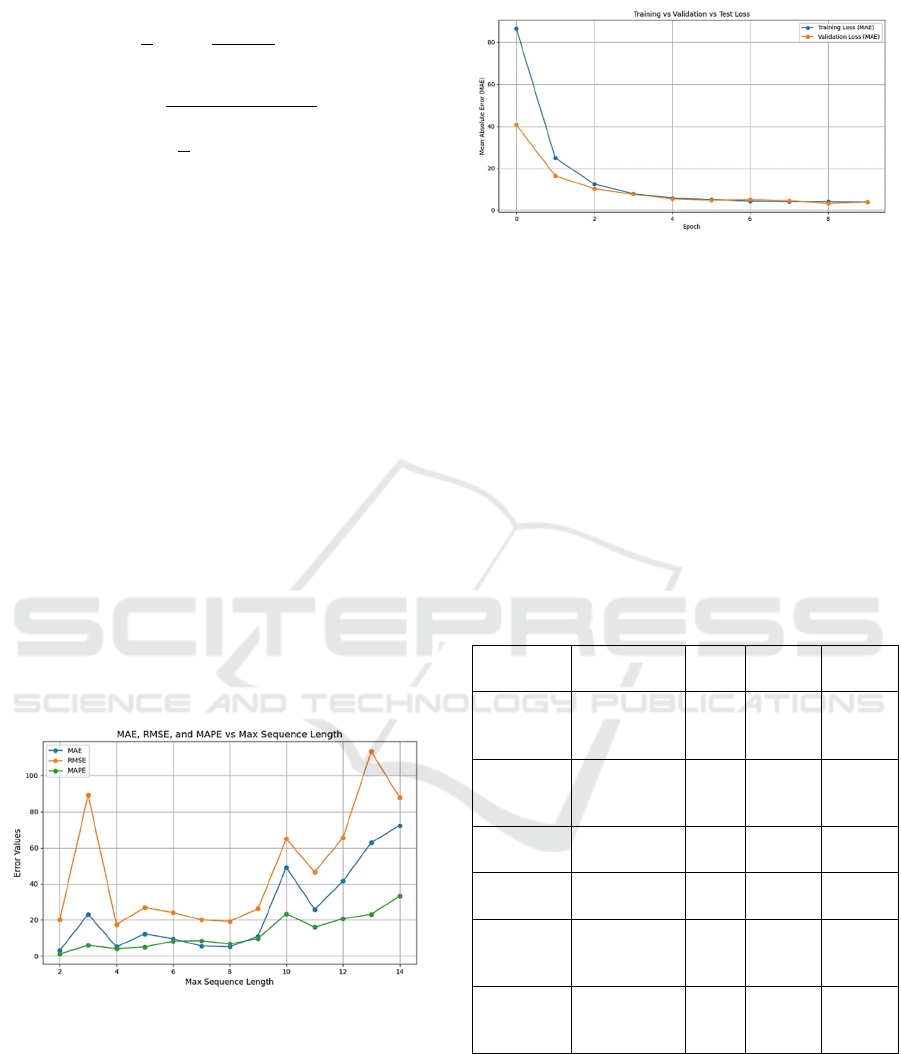
To determine the optimal sequence length
(max_sequence_length parameter) for the LSTM-
based architecture, experiments were conducted with
sequence lengths varying between 2 and 14. Figure 2
demonstrates how the evaluation metrics change with
sequence length, highlighting its impact on model
performance.
While a sequence length of 2 yields lower MAE
and MAPE, it exhibits a higher RMSE, indicating
greater variability in prediction errors. This suggests
that shorter sequences may lead to less stable
predictions with occasional large deviations. In
contrast, a sequence length of 4 strikes a balance
between error minimization and predictive stability.
By incorporating a slightly longer historical context,
it reduces the impact of outliers and enhances the
model’s robustness, making it the optimal choice for
reliable performance.
Figure 2: Impact of sequence length on model performance.
Training and validation losses (MAE) dropped
quickly in the first few epochs and stabilized by the
3rd epoch (Figure 3). After 5 epoch, validation loss
stopped improving while training loss continued to
decrease slightly, indicating overfitting. Thus, the 3rd
epoch was chosen for optimal generalization.
Figure 3: Training and Validation Loss.
The results in Table 3 demonstrate the superior
performance of the proposed hybrid model compared
to baseline methods in predicting bus travel times.
The proposed model achieves a significantly lower
MAE of 13.4 seconds, outperforming the closest
baseline, the multi-model ensemble approach, which
has an MAE of 36.2 seconds. Similarly, the MAPE
for the proposed model is reduced to 10.32%, a
substantial improvement over the lowest baseline
MAPE of 19.01%. For RMSE, the proposed model
achieves 24.26 seconds, markedly lower than the best
baseline performance of 58.2 seconds.
Table 3: Performance comparison of the proposed model
and baseline methods in terms of MAE, MAPE, and RMSE.
Model Ref. MAE
(s)
MAPE
(%)
RMSE
(s)
ConvLSTM
segment-
based
Xie et al., 2021 43.1 20.50 71.4
XGBoost
segment-
based
Zhu et al.,
2022
41.0 23.02 62.3
ConvLSTM
+ ES
Petersen et al.,
2019
39.2 19.12 63.5
ConvLSTM
multi-model
Wu et al., 2020 39.7 20.64 61.7
Multi-model
ensemble
Ratneswaran &
Thayasivam,
2023
36.2 19.01 58.2
Proposed
Hybrid
model
this work 13.4 10.32 24.26
To improve transparency concerning the scale of
segment travel times, it is important to clarify that
segment durations are influenced by factors such as
traffic conditions, route lengths, and stop
characteristics. On average, segment travel times
range from 168 to 274 seconds, with variations
primarily driven by congestion levels and stop
densities. This range ensures that prediction errors, as
Bus Arrival Time Prediction via Hybrid LSTM Using GPS-Derived Run and Dwell Times
517

measured by the Mean Absolute Error (MAE = 13.4
seconds), are evaluated within a meaningful and
practical context. To further enhance clarity,
segment-wise travel time distributions are explicitly
reported in Table 4.
Table 4: Segment travel time distribution.
Segment
Length (km)
Mean Travel
Time (s)
Standard
Deviation (s)
(0 - 0.5] 168.3 66.1
(0.5 – 1] 218.9 77.1
>1 274.4 82.0
4 CONCLUSIONS
The results of this study emphasize the effectiveness
of the hybrid architecture in combining sequential
features, such as stop IDs and running times, with
non-sequential contextual inputs, such as the day of
the week and trip start hour. This integration
leverages the temporal modeling capabilities of
LSTM networks and the contextual feature extraction
of dense layers to achieve exceptional accuracy. The
sequence-based LSTM model dynamically refines
estimates as new data becomes available, mitigating
error accumulation over the course of a journey. The
proposed model’s performance underscores its
superiority over conventional methods, including
standalone models and ensemble approaches. The
model achieves a MAE of 13.4 seconds, MAPE of
10.32% and RMSE of 24.26% making it suitable for
travel time prediction in smart transportation systems.
The dataset used in this study was obtained from
prior research and underwent preprocessing by the
original authors, including the removal of outliers.
While the proposed hybrid model demonstrates
strong accuracy with this preprocessed data, future
validation using less preprocessed datasets is crucial
to assess the model's robustness and its applicability
across diverse real-world scenarios. Such efforts will
help determine the model's adaptability and
effectiveness in varying contexts where data may be
noisier or exhibit different patterns.
While this study focuses on historical data for
training and evaluation, future research will explore
real-time integration to further enhance predictive
adaptability. This step-by-step refinement enables the
model to remain robust, ensuring that travel time
predictions remain accurate even in varying
operational conditions.
ACKNOWLEDGEMENTS
This research has been funded by the Committee of
Science of the Ministry of Science and Higher
Education of the Republic of Kazakhstan (Grant
No.BR24992852 “Intelligent models and methods of
Smart City digital ecosystem for sustainable
development and the citizens’ quality of life
improvement”).
REFERENCES
Levin, L. (2019). How may public transport influence the
practice of everyday life among younger and older
people and how may their practices influence public
transport?. Social Sciences, 8(3), 96.
Yang, Z., Lam, C. T., & Ng, B. K. (2022). Multi-Model Bus
Arrival Time Prediction using Real-Time Online
Information. In 2022 IEEE 22nd International
Conference on Communication Technology, ICCT
2022 (pp. 1918-1922). (International Conference on
Communication Technology Proceedings, ICCT; Vol.
2022-November-November). Institute of Electrical and
Electronics Engineers Inc.. https://doi.org/10.1109/
ICCT56141.2022.10072901
Lingqiu, Z., Guangyan, H., Qingwen, H., Lei, Y., Fengxi,
L., & Lidong, C. (2019, August). A LSTM based bus
arrival time prediction method. In 2019 ieee
smartworld, ubiquitous intelligence & computing,
advanced & trusted computing, scalable computing &
communications, cloud & big data computing, internet
of people and smart city innovation (smartworld/
scalcom/uic/atc/cbdcom/iop/sci) (pp. 544-549). IEEE.
Petersen, N. C., Rodrigues, F., & Pereira, F. C. (2019).
Multi-output deep learning for bus arrival time
predictions. Transportation Research Procedia, 41,
138-145.
Ratneswaran, S., & Thayasivam, U. (2023, September). An
Improved Bus Travel Time Prediction Using Multi-
Model Ensemble Approach for Heterogeneous Traffic
Conditions. In 2023 IEEE 26th International
Conference on Intelligent Transportation Systems
(ITSC) (pp. 2410-2415). IEEE.
Chien, S. I. J., & Kuchipudi, C. M. (2003). Dynamic travel
time prediction with real-time and historic data. Journal
of Transportation Engineering, 129(6), 608-616.
https://doi.org/10.1061/(ASCE)0733-
947X(2003)129:6(608)
Xie, Z. Y., He, Y. R., Chen, C. C., Li, Q. Q., & Wu, C. C.
(2021). Multistep prediction of bus arrival time with the
recurrent neural network. Mathematical Problems in
Engineering, 2021(1), 6636367.
Osman, O., Rakha, H., & Mittal, A. (2021). Application of
long short term memory networks for long-and short-
term bus travel time prediction.
Zhu, L., Shu, S., & Zou, L. (2022). XGBoost‐Based Travel
Time Prediction between Bus Stations and Analysis of
VEHITS 2025 - 11th International Conference on Vehicle Technology and Intelligent Transport Systems
518

Influencing Factors. Wireless Communications and
Mobile Computing, 2022(1), 3504704.
Wu, J., Wu, Q., Shen, J., & Cai, C. (2020). Towards
attention-based convolutional long short-term memory
for travel time prediction of bus journeys. Sensors,
20(12), 3354.
Bus Arrival Time Prediction via Hybrid LSTM Using GPS-Derived Run and Dwell Times
519
