
Refining English Writing Proficiency Assessment and Placement in
Developmental Education Using NLP Tools and Machine Learning
Miguel Da Corte
1,2 a
and Jorge Baptista
1,2 b
1
University of Algarve, Faro, Portugal
2
INESC-ID Lisboa, Lisbon, Portugal
Keywords:
Developmental Education (DevEd), Automatic Writing Assessment Systems, Natural Language Processing
(NLP), Machine-Learning Models.
Abstract:
This study investigates the enhancement of English writing proficiency assessment and placement for Devel-
opmental Education (DevEd) within U.S. colleges using Natural Language Processing (NLP) and Machine
Learning (ML). Existing automated placement tools, such as ACCUPLACER, often lack transparency and
struggle to identify nuanced linguistic features necessary for accurate skill-level classification. By integrat-
ing human-annotated linguistic features, this study aims to contribute to equitable and transparent placement
systems that better address students’ academic needs, reducing misplacements and their associated costs.
For this study, a 300-essay corpus was compiled and manually annotated with a refined set of 11 DevEd-
specific (DES) features, alongside 328 linguistic features automatically extracted from CTAP and 106 via
COH-METRIX. Supervised ML algorithms were used to compare ACCUPLACER-generated classifications
with human ratings, assessing classification accuracy and identifying predictive features. This analysis re-
vealed gaps in ACCUPLACER’s classification capabilities. Experimental results showed that models incorpo-
rating DES features improved classification accuracy, with Na
¨
ıve Bayes (NB) and Support Vector Machine
(SVM) achieving scores up to 80%. The refined features presented and methodology offer actionable insights
for faculty and institutions, potentially contributing to more effective DevEd course placements and targeted
instructional interventions.
1 INTRODUCTION AND
OBJECTIVES
Developmental Education (DevEd) courses play a
crucial role in equipping students who are not yet
prepared for college-level work by developing their
English writing skills and ensuring they are academi-
cally prepared to enter a college program. Placement
into DevEd or college-level courses is typically de-
termined by standardized test scores, which influence
not only students’ educational trajectories but also
carry economic consequences, as students with lower
scores are required to complete one or two semesters
of remedial coursework (Bickerstaff et al., 2022).
This study aims to improve English writing
proficiency assessments and placement within U.S.
community colleges, where DevEd support is most
needed. Approximately 62% of individuals, ages 16
a
https://orcid.org/0000-0001-8782-8377
b
https://orcid.org/0000-0003-4603-4364
to 24, enrolled in colleges or universities in 2023, ac-
cording to the United States Bureau of Labor Statis-
tics
1
. At Tulsa Community College
2
, where this
research was conducted, around 30% of incoming
students require developmental support in multiple
areas, including English (reading and writing) and
Math. The primary focus of this investigation is on
English as an L1, though some observations may ap-
ply to the description of other languages.
Current automated placement tools, such as AC-
CUPLACER, align with academic standards but are not
specifically calibrated to detect patterns unique to stu-
dents requiring DevEd support. Moreover, ACCU-
PLACER’s “black box” approach limits transparency
and interpretability, posing challenges in educational
contexts. This study seeks to address this issue by
refining the linguistic descriptors used in placement
assessments through the identification of key features
that better capture writing proficiency in DevEd stu-
1
https://www.bls.gov
2
https://www.tulsacc.edu
288
Da Corte, M. and Baptista, J.
Refining English Writing Proficiency Assessment and Placement in Developmental Education Using NLP Tools and Machine Learning.
DOI: 10.5220/0013351500003932
In Proceedings of the 17th International Conference on Computer Supported Education (CSEDU 2025) - Volume 2, pages 288-303
ISBN: 978-989-758-746-7; ISSN: 2184-5026
Copyright © 2025 by Paper published under CC license (CC BY-NC-ND 4.0)

dents. By leveraging both human annotations and
NLP-derived features, this research aims at enhancing
placement accuracy and providing actionable insights
for instructional support.
For automated placement systems to become ef-
fective tools for both faculty and students, the use
of high-quality annotated corpora is essential, despite
the time-intensive nature of annotation tasks. These
annotations, crucial for training and testing automated
scoring systems, enhance the reliability and applica-
bility of placement decisions, ultimately supporting
equitable access to education. This study addresses
the need for accuracy in DevEd placements by re-
fining and expanding an annotated dataset, integrat-
ing Natural Language Processing (NLP) tools for au-
tomatic feature extraction, and supplementing these
with novel, manually encoded DevEd features.
The methodology followed employs a 300-essay
corpus annotated with 11 DevEd-specific features,
complemented by linguistic features automatically
extracted through NLP tools, namely COH-METRIX
3
(McNamara et al., 2006) and the Common Text Anal-
ysis Platform (CTAP)
4
(Chen and Meurers, 2016).
This corpus will be used to train and test various ML
classifiers against both ACCUPLACER’s automated
classifications and human ratings, assessing classifi-
cation accuracy to identify the most predictive fea-
tures and the most effective algorithms for DevEd
placements. A suite of well-known ML algorithms
from the ORANGE
5
data-mining tool (Dem
ˇ
sar et al.,
2013) is used as the experiments with the models it
makes available can be easily replicated, helping pro-
vide a framework for future comparisons.
Based on these motivations and the existing limi-
tations mentioned, the purpose of this paper is to: (i)
analyze linguistic features in an expanded corpus us-
ing COH-METRIX, CTAP, and a manually annotated
set of DevEd-specific (DES) features to enhance text
classification accuracy; (ii) assess the impact of these
combined features on classification accuracy for stu-
dent placement in DevEd courses through supervised
ML experiments; (iii) compare classification accuracy
rates achieved with the larger corpus and refined fea-
ture set to a previously established baseline; and (iv)
offer actionable insights into students’ linguistic abil-
ities to support accurate placement and targeted in-
structional support in DevEd courses.
3
https://141.225.61.35/CohMetrix2017/
4
https://sifnos.sfs.uni-tuebingen.de/ctap/
5
https://orangedatamining.com/
2 RELATED WORK
Concerns about the accuracy of automated classifica-
tion systems like ACCUPLACER stem from the limited
detail in the linguistic features considered during the
classification process, as well as uncertainty around
how these features are defined and ranked (Roscoe
et al., 2014; Johnson et al., 2022). This lack of trans-
parency makes it difficult to clearly explain to stu-
dents which linguistic features were evaluated to de-
termine their placement, what defines college-level
writing, and which patterns they should address to
improve their skills. Without such clarity, students
may lack the necessary guidance to effectively en-
hance their writing abilities (Ma et al., 2023).
Studies suggest that up to one-third of placements
may be inaccurate (Ganga and Mazzariello, 2019).
Inaccurate placement in the context of DevEd often
leads to students being assigned to courses that either
underestimate or overestimate their writing abilities,
both of which carry significant implications, not only
economically, but for student outcomes and institu-
tional effectiveness (Hughes and Li, 2019; Link and
Koltovskaia, 2023; Edgecombe and Weiss, 2024).
Assessing students’ linguistic skills solely through
test scores may overlook critical aspects of their lan-
guage abilities at the onset of their academic jour-
ney, highlighting the need for a more nuanced eval-
uation approach. As institutions seek to develop and
support students’ literacy-related skills, especially the
descriptive quality of their written work (Kosiewicz
et al., 2023), it becomes essential to explore and ar-
ticulate the developmental aspects of writing for this
population. Among the features worth exploring, the
literature emphasizes the lexical and syntactic proper-
ties of a text, followed by the text’s length, portraying
them as key indicators of writing development (Sta-
vans and Zadunaisky-Ehrlich, 2024).
Text structure, a key measure of text quality,
constitutes another property worth exploring (Kyle
et al., 2021; Feller et al., 2024). Texts that rely on
single lines or simple, non-multilayered paragraphs
are identified as needing remediation, while those
with well-structured paragraphs—including a clear
introduction, supporting statements, and a conclu-
sion—are better aligned with academic writing stan-
dards (Da Corte and Baptista, 2025). Additionally,
texts that demonstrate a varied grammatical reper-
toire, grammatical complexity, and purposeful gram-
matical choices are more in line with these standards,
showcasing the writer’s ability to use grammar effec-
tively (Nyg
˚
ard and Hundal, 2024).
Studies on DevEd placement for English (L1)
speakers have focused on refining texts ranking tasks
Refining English Writing Proficiency Assessment and Placement in Developmental Education Using NLP Tools and Machine Learning
289

and improving classification accuracy (CA) through
corpora annotation (G
¨
otz and Granger, 2024) and lex-
ical and syntactic analysis supported by text mining
(Lee and Lee, 2023). Key NLP tools, such as COH-
METRIX (McNamara et al., 2006) and CTAP (Chen
and Meurers, 2016)), have proven essential for assess-
ing linguistic complexity across languages. While
this study focuses on English, the identification and
development of linguistic features for enhanced ac-
curacy in automatic language proficiency classifica-
tion is applicable beyond this language. For instance,
(Leal et al., 2023) adapted COH-METRIX for Brazil-
ian Portuguese and (Okinina et al., 2020) extended
CTAP to Italian. (Akef et al., 2023) applied CTAP
to Portuguese proficiency assessment, achieving 76%
CA and emphasizing the role of feature selection.
Similarly, (Wilkens et al., 2022) investigated lexical
diversity and syntactic dependency relations for eval-
uating French language development.
Exploring further the above-mentioned contribu-
tions, lexical features such as word n-grams, part-
of-speech (POS) n-grams, POS-tag ratios, and type-
token ratio (TTR), which reflect the diversity of word
types in a text, play a crucial role in these analyses,
in addition to lexical variation features (e.g., noun,
adjective, adverb, and verb variations), as well as
metrics like lexical density, to capture the breadth of
students’ linguistic proficiency (Vajjala and Meurers,
2012). This confirms the importance of incorporat-
ing rich linguistic features into automated classifica-
tion systems to enhance the accuracy of writing as-
sessments across languages (Vajjala and Lu
ˇ
ci
´
c, 2018;
Vajjala, 2022).
By focusing on descriptive features that more ac-
curately reflect native English proficiency, automatic
classification systems have shown measurable im-
provements in placement accuracy (Da Corte and
Baptista, 2024c; Da Corte and Baptista, 2024b;
Da Corte and Baptista, 2025), providing valuable in-
sights into students’ readiness for college and their
linguistic progression over time. Studies such as
(Pal and Pal, 2013) have demonstrated this poten-
tial by using the WEKA machine-learning platform
with models like Na
¨
ıve Bayes, Multilayer Perceptron,
and Decision Trees, achieving a classification accu-
racy (CA) close to 90% in course placement. Sim-
ilarly, (Filighera et al., 2019) utilized Neural Net-
works and embeddings to categorize texts by read-
ing level with approximately 80% accuracy, while
(Hirokawa, 2018) and (Duch et al., 2024) further
demonstrated the effectiveness of classical ML al-
gorithms—including Na
¨
ıve Bayes, Neural Networks,
and Random Forest—in feature selection and out-
come prediction, with CA rates above 90%.
In alignment with the motivation and objectives of
this study, the findings presented in the state-of-the-
art review confirm the potential of machine learning
models to enhance DevEd placement by emphasizing
relevant linguistic features, helping institutions better
support students both academically and linguistically
(Bickerstaff et al., 2022; Giordano et al., 2024).
3 METHODS
The methodology for this study involves a systematic
and detailed setup that prioritizes ethical participant
selection and focuses on linguistic descriptor relia-
bility for DevEd placement, all done in accordance
with the Institution’s Review Board (IRB) protocols
(ID #22-05
6
). The methodology was designed to ad-
here to guidelines sensitive to the unique academic
challenges experienced by this group.
3.1 Corpus
This study extends a previous classification task con-
ducted with a small corpus of 100 text samples
(Da Corte and Baptista, 2024a; Da Corte and Bap-
tista, 2025) by adding 200 more essays, resulting in a
systematically selected corpus of 300 essays totaling
97,339 tokens
7
. The corpus focuses on non-college-
level classifications to enhance the precision of place-
ment for students requiring DevEd support. The texts
were written by students seeking college admission
during the 2021-2022 and 2023-2024 academic years
and were drawn from a larger pool of 1,000 essays
within the institution’s standardized entrance exam
database. The selected essays cover 11 distinct writ-
ing topics, including Is History Valuable, Necessary
to Make Mistakes, Acquisition of Money, Differences
Among People, Happiness Not an Accident, and Inde-
pendent Ideas, to mention a few. These essays were
written in a controlled, proctored environment at the
institution’s testing center, ensuring no Internet access
or editing tools were available.
The selection criteria aimed at compiling a cor-
pus focused on non-college-level classifications, ac-
curately representing students in DevEd and their
placement levels as determined by ACCUPLACER into
Levels 1 or 2. The corpus was balanced by level,
with essays averaging 324 tokens each, making it
well-suited for examining classification by level. This
dataset provides a valuable foundation for assessing
6
https://www.tulsacc.edu/irb
7
Corpus dataset to be made available after paper publi-
cation.
CSEDU 2025 - 17th International Conference on Computer Supported Education
290

language proficiency among community college stu-
dents. Demographic information—including gender,
first language, years of English studied in high school,
and race—was available for 67% of participants but
was omitted from this stage of analysis. This data will
be analyzed in detail in a future study.
3.2 Corpus Annotation
As an initial step in this study, two trained raters anno-
tated the corpus with a refined set of 11 DES features
devised by (Da Corte and Baptista, 2024a)
8
. Selected
through an open call for volunteers, the annotators
were equally represented in terms of gender distribu-
tion (1 male and 1 female), were both native English
speakers with advanced English skills, held at least a
Bachelor’s degree, and had experience in higher edu-
cation.
The refined set of features derived from an ini-
tial list of 21 and was narrowed down to 11 using
ORANGE’s feature selection tool and the Informa-
tion Gain ranking method. These features, identi-
fied as the most discriminative in previous experi-
ments (Da Corte and Baptista, 2022; Da Corte and
Baptista, 2024a), are summarized in Table 1. They
are grouped into 4 (pattern) clusters: Orthographic
(ORT), Grammatical (GRAMM), Lexical and Seman-
tic (LEXSEM), and Discursive (DISC), each reflect-
ing key aspects of foundational language proficiency.
While most features are classified as negative (-), rep-
resenting deviations from proficiency and identifying
errors, others are positive (+), serving as indicators of
proficiency and advanced language use.
ORT patterns capture basic language structure
through grapheme alterations, punctuation, and the
use of contractions (generally avoided in academic
writing unless otherwise specified). GRAMM pat-
terns measure text quality through verb agreement,
referential pronoun usage, and the omission or addi-
tion of a part of speech, which often interferes with
the meaning of a statement. LEXSEM patterns in-
clude the use of multiword expressions (MWE) and
lexical accuracy. Lastly, DISC patterns highlight
writers’ ability to extend discourse with reasoned ar-
guments and examples. These features were inte-
grated with the previously mentioned NLP-derived
features, automatically extracted from COH-METRIX
(106) and CTAP platforms (328)
9
, and used in the
supervised ML experiments detailed in Section 4.
8
https://gitlab.hlt.inesc-id.pt/u000803/deved/
9
The definitions of COH-METRIX and CTAP are well-
documented in the literature and adopted as cited.
For the annotation of these features on the texts,
Labelbox
10
was selected as the web annotation tool
to use. Labelbox has been tested before and identified
as a tool that simplifies the data labeling process in
a way that can be used to train Artificial Intelligence
(AI) models, and enables the creation of high-quality
annotated datasets (Colucci Cante et al., 2024).
3.3 Annotation Task Assessment
After manually annotating the corpus, all tags were
meticulously tracked and processed through Label-
box. Krippendorff’s Alpha (K-alpha) inter-rater re-
liability coefficient was computed to evaluate anno-
tation reliability. Given the size of the dataset, these
calculations were performed via Excel formulas. For
the interpretation of K-alpha scores, the following
agreement thresholds and interpretations, set forth
by (Fleiss and Cohen, 1973), were followed:
below 0.20 - slight (Sl);
between 0.21 and 0.39 - fair (F);
between 0.40 and 0.59 - moderate (M);
between 0.60 and 0.79 - substantial (Sb);
above 0.80 - almost perfect (P);
The two annotators agreed on the assessment and
tagging of 79,805 tokens and disagreed on 17,534 to-
kens. The observed proportion of agreement (P
o
) was
0.819, while the expected agreement by chance (p
e
)
was 0.5 (or 50%), given two possible outcomes with
equal probability. Using the formula:
K − al pha =
P
o
− 0.5
1 − 0.5
the inter-rater reliability score was calculated as k =
0.640, indicating “substantial agreement”. Consider-
ing the complexity of the task, this level was deemed
adequate. The reasons for disagreeing on the 17,534
tokens will be analyzed in a future study.
A third annotator, with a similar background to
the other two, was engaged in the task assessment to
facilitate consensus and establish a gold standard (or
reference) annotation. This process resulted in a final
set of 17,342 tags applied and used for analysis. Ta-
ble 2 provides a detailed count of tagged features per
level, maintaining the order of features as presented in
Table 1. The table also highlights the uneven distribu-
tion of tags, with 38% found in texts classified by AC-
CUPLACER as Level 1 and 62% as Level 2. Notably,
this feature distribution offers foundational insights
into the linguistic attributes that typically distinguish
Levels 1 and 2 texts, serving as an initial prototype for
defining the unique characteristics of each level.
10
https://docs.labelbox.com/
Refining English Writing Proficiency Assessment and Placement in Developmental Education Using NLP Tools and Machine Learning
291
Table 1: DevEd-specific (DES) features summary.
Patterns Description Features Clustered
Orthographic (ORT)
Patterns representing the foundational language skills
needed to represent words and phrases.
(-) Grapheme (addition, omission, transposition,
and capitalization) (ORT)
(-) Word split (WORDSPLIT)
(-) Punctuation used & Contractions (PUNCT)
Grammatical (GRAMM) Patterns evidencing the quality of text production.
(-) Word omitted (WORDOMIT)
(-) Word repetition (WORDREPT)
(-) Verb agreement (VAGREE)
(-) Pronoun-alternation referential (ALTERN)
Lexical & Semantic (LEXSEM)
Patterns contributing to the structuring
of a writer’s discourse.
(-) Word precision (PRECISION)
(+) Multiword expressions (MWE)
Discursive (DISC) Patterns exhibiting the writer’s ability to produce— extended discourse.
(+) Argumentation with reason (REASON)
(+) Argumentation with example (EXAMPLE)
Table 2: Distribution of DevEd-specific (DES) features across the corpus.
Polarity Feature Level 1 % Level 2 % Dif (L1-L2) Result
- ORT 2,528 38.18% 2,504 23.36% -14.83% Improved
- WORDSPLIT 95 1.43% 72 0.67% -0.76% Almost no improvement
- PUNCT 1,390 20.99% 2,082 19.42% -1.57% Slightly improved
- WORDOMIT 435 6.57% 462 4.31% -2.26% Slightly improved
- WORDREPT 71 1.07% 98 0.91% -0.16% Almost no improvement
- VAGREE 178 2.69% 106 0.99% -1.70% Slightly improved
- ALTERN 37 0.56% 46 0.43% -0.13% Almost no improvement
- PRECISION 599 9.05% 745 6.95% -2.10% Slightly improved
+ MWE 1,038 15.68% 4,101 38.25% 22.57% Improved
+ REASON 200 3.02% 356 3.32% 0.30% Almost no improvement
+ EXAMPLE 50 0.76% 149 1.39% 0.63% Almost no improvement
Total - 6,621 - 10,721 - - -
Overall, Level 1 texts exhibited more frequent in-
stances of foundational issues (PUNCT and ORT) and
demonstrated less cohesion and complexity. In con-
trast, Level 2 texts displayed fewer lower-order errors
and greater exemplification of higher-order features,
such as MWE. As writing develops, texts tend to
incorporate more sophisticated features with correc-
tions focusing on fine-tuning elements that enhance
clarity and refine expression (Nyg
˚
ard and Hundal,
2024). As an illustration, two sample texts represent-
ing Levels 1 and 2 are provided in the Appendix.
The primary improvements noted between texts in
Levels 1 and 2 were a sharp reduction in ORT er-
rors (-14.83%) and a notable increase in the use of
multiword expressions (MWE) (+22.57%), corrobo-
rating previous research findings on the connection
between MWE use and higher proficiency levels (La-
porte, 2018; Kochmar et al., 2020; Pasquer et al.,
2020). Additionally, a slight improvement was ob-
served in the reduced incidence of several negative
features, with proficiency levels improving by ap-
proximately 1.6% to 2.3% for these features. The
distribution of the remaining features shows no sig-
nificant differences, with changes below 1%.
Building on this tagging framework, the ranking
of DES features was compared with the original sub-
corpus of 100 text samples, 200 texts, and the full cor-
pus, 300 text samples, as shown in Table 3. The rank-
ing was determined using the Information Gain scor-
ing method available in ORANGE, selected due to its
superior classification accuracy (CA) demonstrated in
a prior study (Da Corte and Baptista, 2024c). Conse-
quently, this method was applied to all classification
tasks described in Section 4.
The ranking of DES features for the 100- and the
200-text samples yielded a “very strong” Spearman
correlation score
11
(Schober et al., 2018) of ρ = 0.927
with a two-tailed p-value of 0, indicating consistency
in feature ranking across studies despite observable
differences. This correlation, however, does not pre-
clude some shifts in the relative importance of certain
features, likely influenced by differences in corpus
size. Note that the content of each sample does not
overlap. Observable changes include higher rankings
for MWE, EXAMPLE (argumentation of key con-
cepts; support of one’s position with examples.), and
VAGREE (lack of agreement between the subject of
the sentence and the conjugated form of the verb) in
the 200 text samples, while the PRECISION (impre-
cise use of words attending to its meaning in the sen-
tence) feature dropped significantly from 4th to 11th
place, in this sub-corpus.
The final ranking with all 300 text samples com-
bined portrays VAGREE, EXAMPLE, and ORT (de-
noting orthographic errors) as the top 3 features with
comparable Information Gain scores. Comparison of
the Spearman ranking coefficient is also “very high”,
with ρ = 0.948 for the 100 samples vs. 300 samples
corpus (< overlap), and ρ = 0.977 for the 200 vs. 300
samples (> overlap). This indicates a consistent rank-
ing of the features across the subcorpora.
11
https://www.socscistatistics.com/tests/spearman/
CSEDU 2025 - 17th International Conference on Computer Supported Education
292

Table 3: Comparison of DES Feature Rankings Using Information Gain Scores for 100, 200, and 300 Texts.
100 Texts 200 Texts 300 Texts
Rank Feature Info. Gain Rank Features Info. Gain Rank Features Info. Gain
1 ORT 0.084 1 MWE 0.260 1 VAGREE 0.131
2 EXAMPLE 0.080 2 EXAMPLE 0.171 2 EXAMPLE 0.124
3 WORDOMIT 0.080 3 ORT 0.140 3 ORT 0.112
4 PRECISION 0.072 4 WORDOMIT 0.126 4 MWE 0.088
5 WORDREPT 0.062 5 VAGREE 0.126 5 WORDOMIT 0.075
6 VAGREE 0.056 6 ALTERN 0.081 6 REASON 0.045
7 MWE 0.050 7 WORDREPT 0.078 7 WORDREPT 0.039
8 REASON 0.039 8 REASON 0.069 8 ALTERN 0.034
9 ALTERN 0.038 9 WORDSPLIT 0.060 9 PRECISION 0.014
10 PUNCT 0.037 10 PUNCT 0.034 10 WORDSPLIT 0.012
11 WORDSPLIT 0.036 11 PRECISION 0.004 11 PUNCT 0.011
3.4 Skill-Level Classification and
Assessment
In addition to assessing the DevEd-specific features
marked in the corpus, all 300 full-text samples were
classified by the same two annotators according to
skill level, using DevEd-level definitions adapted
from the Institution’s course descriptions:
DevEd Level 1: if essays demonstrated a need for
improvement in general English usage, including
grammar, spelling, punctuation, and the structure
of sentences and paragraphs;
DevEd Level 2: if essays required targeted support
in specific aspects of English, such as sentence
structure, punctuation, editing, and revising; or
College Level: if essays were written accurately
and displayed appropriate English usage at the col-
lege academic level.
The two evaluators agreed on the skill level as-
signed to 260 text samples, while they differed on
40. Among the agreed-upon samples, 122 were clas-
sified as Level 1, 134 as Level 2, and 4 as College
level. To measure the level of agreement, the Krip-
pendorff’s Alpha (K-alpha) inter-rater reliability co-
efficient was calculated using the ReCal-OIR
12
tool
(Freelon, 2013) for ordinal data.
According to (Fleiss and Cohen, 1973), a “mod-
erate” level of agreement 0.473 was obtained. While
this score indicates some consistency in the ratings
between the annotators, it also highlights the com-
plexity involved in assessing proficiency skills. This
suggests that incorporating additional descriptive lin-
guistic criteria, such as numerical subscales to quan-
tify misspelled words, beyond the outlined DevEd
level descriptions, may enhance automatic classifica-
tion accuracy.
Given the moderate agreement score, further anal-
ysis was necessary to resolve discrepancies in classi-
fications. For the 40 cases where differences between
12
https://dfreelon.org/utils/recalfront/recal-oir/
human classifications occurred, the average of the lev-
els assigned for each text was calculated, and a final
classification was attributed. This process resulted in
14 cases being classified as Level 1, 22 as Level 2,
and 4 as College level.
With the discrepancies finally resolved, the DevEd
corpus now comprised 136 essays classified as Level
1, 156 as Level 2, and 8 as College-level. To maintain
balance between the levels, random resampling was
conducted for Level 2 to reduce the number of essays
to 136, equal to Level 1. The College-level essays
were discarded at this stage, as this study focuses on
a two-level DevEd classification task.
This human-rated assessment adds a level of depth
to the analysis, as annotators, unlike automated sys-
tems like ACCUPLACER, can grasp the subtleties of
language use and the complexities involved in student
writing assessment.
3.4.1 Comparing ACCUPLACER vs. Human
Assessment
The classification performance of the ACCUPLACER
system with human annotators is compared in this
section, providing insights into alignment and dis-
crepancies across subcorpora of 100, 200, and all 300
texts, using Pearson coefficient (Cohen, 1988).
The correlation between ACCUPLACER and hu-
man classifications is summarized in Table 4.
Table 4: Pearson Correlation Comparison: Human Raters
vs. Accuplacer Across Subcorpora.
Subcorpus Pearson
100 0.242
200 0.366
300 0.305
The Pearson coefficients consistently indicated
“weak” correlation scores for 100, 200, and for the
full corpus. Similarly, the K-alpha coefficient, com-
puted for all 300 texts, yielded a “fair” score of
k = 0.312 confirming ACCUPLACER’S limitations in
aligning with human raters, particularly in identifying
Refining English Writing Proficiency Assessment and Placement in Developmental Education Using NLP Tools and Machine Learning
293

nuanced linguistic features and transitions between
proficiency levels.
To further illustrate the discrepancies between
ACCUPLACER and human classifications, confusion
matrices (Tables 5,6, 7) provide a detailed breakdown
of specific instances where ACCUPLACER encounters
challenges in accurately predicting proficiency levels.
Table 5 shows that ACCUPLACER aligned with hu-
man classifications for 79 texts (accuracy, 79%). All
21 errors occurred when Level 1 texts were misclas-
sified as Level 2. The results suggest that this auto-
matic classification system has some limitations when
distinguishing Level 1 from Level 2 and the need for
improved recognition of Level 1 linguistic features.
Table 5: Accuplacer vs. Human Assessment: 100 Texts.
Accuplacer L1 Accuplacer L2 Sum
Human L1 50 21 71
Human L2 0 29 29
Sum 50 50 100
With the subcorpus of 200 text samples, as per Ta-
ble 6, ACCUPLACER aligned with the human clas-
sification for 157 texts (accuracy, 78.5%), a simi-
lar ratio as with the subcorpora of 100 texts. How-
ever, the misclassification of 35 Level 2 texts as Level
1 significantly impacts overall accuracy. Addition-
ally, 8 College-level texts were not recognized by Ac-
cuplacer as proficient texts, despite humans identi-
fying linguistic features corresponding to advanced,
college-level writing. These 8 texts were excluded
from both this matrix and the subsequent one.
Table 6: Accuplacer vs. Human Assessment: 200 Texts.
Accuplacer L1 Accuplacer L2 Sum
Human L1 65 0 65
Human L2 35 92 127
Sum 100 92 192
For the 300 text samples, ACCUPLACER aligned
with the human classification for 236 texts (accuracy,
79%). In Table 7, a misclassification of 56 texts (35
Level 2 texts misclassified as Level 1; 21 Level 1 texts
misclassified as Level 2) was noted, indicating AC-
CUPLACER’S difficulty in distinguishing these levels.
Furthermore, ACCUPLACER’S missed all 8 College-
Level texts classified by humans, suggesting that im-
provements are needed to better identify linguistic
features that signal higher proficiency and transitions
between Levels 1 and 2.
Table 7: Accuplacer vs. Human Assessment: 300 Texts.
Accuplacer L1 Accuplacer L2 Sum
Human L1 115 21 136
Human L2 35 121 156
Sum 150 142 292
These misclassifications have broader implica-
tions beyond accuracy scores. Misplacing approxi-
mately 1 in 5 students (approximately 20%) at a level
above or below their true skill carries significant ped-
agogical consequences. These include not only extra
costs in time and money for both students and institu-
tions but also potential impacts on learning outcomes
and student success.
4 MACHINE LEARNING FOR
DevEd PLACEMENT
As mentioned before, this study builds on earlier work
(Da Corte and Baptista, 2024c) by integrating 445
features from three sources to classify text samples
by DevEd level: 106 from COH-METRIX, 328 from
CTAP, and the refined set of 11 DES features man-
ually annotated on the corpus. Supervised ML meth-
ods now use this data in a set of experiments aimed at
(i) identifying the most relevant linguistic features for
classification and (ii) determining the ML algorithm
achieving the highest classification accuracy (CA).
While this represents a classical ML approach to
the classification problem at hand, future research will
expand on these findings by incorporating pre-trained
Large Language Models (LLMs), such as Generative
Pre-trained Transformers (GPT), to assess their abil-
ity to align textual features with refined descriptors
and generate interpretative explanations for classifi-
cation outcomes.
These experiments were set in two scenarios: (i)
using the full corpus with classification levels auto-
matically assigned by ACCUPLACER; and (ii) using
the same corpus with classification levels assigned
by human annotators. In each scenario, experiments
were first conducted with all 445 features, followed
by additional experiments where features were added
incrementally in bundles of 10 until classification re-
sults reached asymptotic results.
The data-mining tool ORANGE was selected for
analysis and modeling for its usability and the diver-
sity of ML tools and algorithms it makes available.
A total of 10 well-known ML algorithms were se-
lected from the set available in ORANGE (listed al-
phabetically): (i) Adaptive Boosting (AdaBoost); (ii)
CN2 Rule Induction (CN2); (iii) Decision Tree (DT)
(iv) Gradient Boosting (GB); (v) k-Nearest Neigh-
bors (kNN); (vi) Logistic Regression (LR); (vii) Na
¨
ıve
Bayes (NB); (viii) Neural Network (NN); (ix) Ran-
dom Forest (RF); and (x) Support Vector Machine
(SVM). The default configuration of these learners
was selected.
CSEDU 2025 - 17th International Conference on Computer Supported Education
294

Figure 1 shows the basic workflow adopted for
this study.
To train and evaluate the models, the Orange
TEST&SCORE widget was employed. Classification
Accuracy (CA) was the primary evaluation metric,
aligned with this study’s goals. In cases where CA
values were identical, Precision (Prec) was used as a
secondary criterion to rank the models. Given the cor-
pus size, a 3-fold cross-validation was implemented
using the DATA SAMPLER widget, allocating 2/3 of
the corpus for training and 1/3 for testing. Addi-
tionally, the RANK widget facilitated an evaluation
of each feature’s discriminative power for the task,
while a Confusion Matrix provided insights into de-
tailed breakdown of the classification results.
Previously, a baseline has been established, set-
ting a CA of 0.727 using the Random Forest (RF)
algorithm (Da Corte and Baptista, 2024c). This rel-
atively high baseline reflects RF’s recognized effec-
tiveness in machine learning applications to writing
assessment (Huang, 2023). Although the classifica-
tion accuracy is high, the baseline represents a con-
cerning value. A CA of 0.727 translates to approx-
imately 3 out of 10 students being misclassified in
DevEd following the ACCUPLACER writing assess-
ment. This misclassification rate raises concerns
about the methodology of current automatic place-
ment systems, with potentially far-reaching implica-
tions for student success and the allocation of institu-
tional resources. Addressing these challenges aligns
with the objectives of this study, which seeks to en-
hance placement accuracy.
4.1 Scenario 1: Classification Using
ACCUPLACER-Assigned Skill Levels
For this classification task, text sample units were
classified using all 445 features with the skill-
level classifications automatically assigned by ACCU-
PLACER as the target variable (150 texts Level 1; 150
texts Level 2). The results of this experiment are pre-
sented in Table 8.
Table 8: CA scores, F1, Precision, and Recall for all models
with 445 features and ACCUPLACER’s classifications.
Model CA F1 Prec Recall
CN2 0.655 0.653 0.655 0.655
AdaBoost 0.675 0.675 0.675 0.675
DT 0.730 0.730 0.731 0.730
RF 0.750 0.748 0.753 0.750
kNN 0.755 0.751 0.764 0.755
NN 0.770 0.768 0.773 0.770
LR 0.780 0.780 0.780 0.780
NB 0.785 0.782 0.794 0.785
SVM 0.795 0.794 0.796 0.795
GB 0.800 0.798 0.806 0.800
When all features were combined, 7 out of the 10
models tested achieved higher CA scores, surpassing
the initial baseline of 72.7% - from 75% with RF up
to 80% with GB (highlighted in bold). This indicates
that the combined features hold significant potential
for improving student placement and ensuring they
receive the necessary support as they begin college.
With this enhanced feature set, at least 8 out of 10
students would now be properly placed, compared to
the previous ratio of 7 out of 10.
To address the question of which features con-
tribute most to improved placement accuracy, the
most discriminative features from Coh-Metrix, CTAP,
and DES were identified using the Information Gain
ranking method. Table 9 provides the topmost 30.
The top-ranked features, overall, were mostly
from CTAP (99%), followed by 2 COH-METRIX fea-
tures, Word count, Number of words ranking 35th (In-
formation Gain: 0.242) and Sentence count, number
of sentences ranking 88th (Information Gain: 0.162)
and one DES feature, VAGREE ranking 117th (Infor-
mation Gain: 0.131). The next DES feature ranked
was in 121st place, EXAMPLE (Information Gain:
0.124). Notably, VAGREE had previously ranked 7th
when the experiments were conducted with a smaller
text sample unit size of 100 (Da Corte and Baptista,
2024c).
All features were then grouped into sets of 10,
and bundles were used in several ML experiments to
identify optimal CA scores performance before re-
sults reached an asymptote. The CA scores for the
top 120 selected features for all 10 ML algorithms are
detailed in Table 10. CA scores in bold indicate the
highest score achieved with different feature combi-
nations, while scores exceeding the previously men-
tioned baseline of 0.727 (in Section 4) are italicized
for each model and bundle. Figure 2 depicts the out-
comes of Experiment 4.1 for a more in-depth evalua-
tion of the results obtained.
Most models consistently outperformed the previ-
ous baseline of 0.727 CA, except for the AdaBoost
and CN2 algorithms, which fell below this value in
most instances. The NN model quickly peaked in the
first run, achieving a CA score of 0.800 with only 10
combined features. While its performance slightly de-
clined in subsequent experiments, it consistently re-
mained above 0.727. Similarly, the NB model demon-
strated strong performance with consistent CA scores
of 0.770 or higher, reaching asymptote results after a
total of 30 combined features. This consistent behav-
ior is likely due to NB’s known great computing effi-
ciency and adaptability to text classification tasks (Pa-
jila et al., 2023).
Refining English Writing Proficiency Assessment and Placement in Developmental Education Using NLP Tools and Machine Learning
295
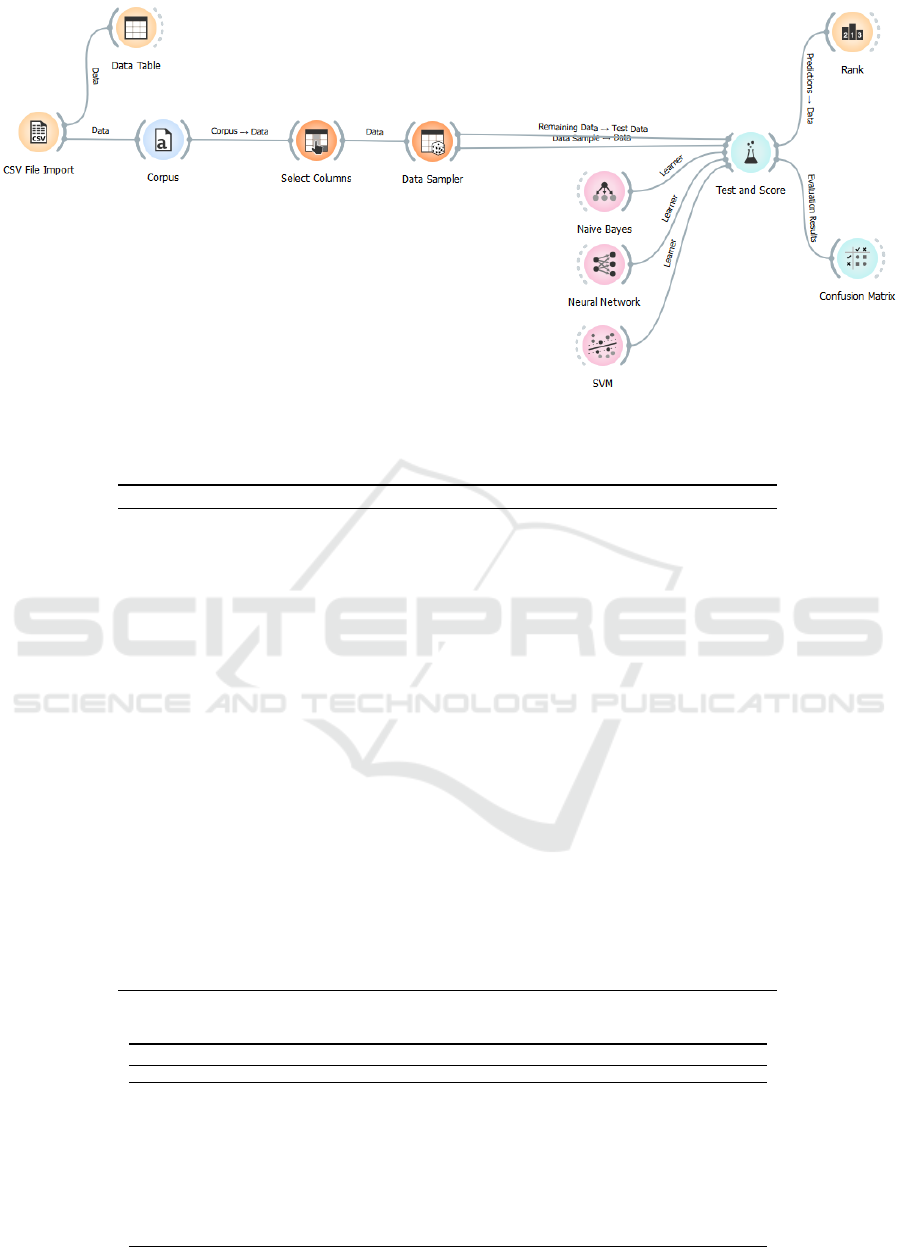
Figure 1: ORANGE workflow setup. The NB, NN, and SVM algorithms are displayed merely as representatives of the chosen
learners.
Table 9: Scenario 1: Combined top-ranked 30 features from COH-METRIX, CTAP, and DES by Information Gain scores.
Rank Source Feature Description Info. gain
1 CTAP Lexical Sophistication: Easy word types (NGSL) 0.341
2 CTAP Number of Tokens with More Than 2 Syllables 0.333
3 CTAP Number of Word Types (including Punctuation and Numbers) 0.331
4 CTAP Number of Word Types (excluding Punctuation and numbers) 0.327
5 CTAP Number of Word Types 0.327
6 CTAP Number of POS Feature: Lexical word Types 0.326
7 CTAP Number Of Letters 0.311
8 CTAP Number of Word Types with More Than 2 Syllables 0.303
9 CTAP Number of POS Feature: Verb Types (including Modals) 0.296
10 CTAP Number of POS Feature: Adjective and Adverb Types 0.288
11 CTAP Lexical Sophistication: Easy verb types (NGSL) 0.275
12 CTAP Number of POS Feature: Preposition Types 0.273
13 CTAP Number of syllables 0.272
14 CTAP Lexical Sophistication: Easy lexical types (NGSL) 0.271
15 CTAP Number of POS Feature: Verb Types (without Modals) 0.271
16 CTAP Lexical Sophistication Feature: SUBTLEX Word Frequency per Million (AW Type) 0.270
17 CTAP Lexical Sophistication: Easy lexical tokens (NGSL) 0.269
18 CTAP Number of POS Feature: Lexical word Lemma Types 0.269
19 CTAP Number of POS Feature: Noun Types 0.268
20 CTAP Number of POS Feature: Noun Lemma Types 0.266
21 CTAP Number of POS Feature: Verb Lemma Types 0.265
22 CTAP Number of POS Feature: Noun Tokens 0.263
23 CTAP Number of Syntactic Constituents: Complex Noun Phrase 0.263
24 CTAP Number of POS Feature: Lexical word Tokens 0.262
25 CTAP Number of POS Feature: Adverb in base form Types 0.262
26 CTAP Number of POS Feature: Adverb Types 0.260
27 CTAP Number of POS Feature: Verb Tokens (without Modals) 0.258
28 CTAP Number of Syntactic Constituents: Declarative Clauses 0.253
29 CTAP Lexical Sophistication: Easy verb tokens (NGSL) 0.251
30 CTAP Number of Unique Words 0.250
Table 10: Scenario 1: CA scores for top 120 features in bundles of 10 across 10 ML models.
Classification Accuracy (CA) Scores
Model 10ft 20ft 30ft 40ft 50ft 60ft 70ft 80ft 90ft 100ft 110ft 120ft
DT 0.700 0.745 0.665 0.655 0.660 0.660 0.735 0.735 0.770 0.760 0.755 0.725
AdaBoost 0.715 0.695 0.640 0.665 0.720 0.730 0.715 0.715 0.765 0.695 0.710 0.705
CN2 0.715 0.680 0.660 0.715 0.695 0.715 0.695 0.695 0.700 0.695 0.695 0.695
GB 0.755 0.745 0.735 0.705 0.710 0.745 0.765 0.760 0.765 0.760 0.780 0.775
NB 0.770 0.790 0.790 0.785 0.785 0.780 0.780 0.785 0.785 0.780 0.780 0.780
RF 0.770 0.745 0.720 0.740 0.760 0.750 0.730 0.775 0.765 0.740 0.745 0.755
LR 0.770 0.780 0.780 0.705 0.755 0.700 0.710 0.700 0.710 0.700 0.715 0.755
kNN 0.775 0.740 0.735 0.765 0.770 0.760 0.745 0.735 0.775 0.770 0.770 0.770
SVM 0.790 0.795 0.780 0.780 0.765 0.770 0.770 0.775 0.770 0.770 0.770 0.775
NN 0.800 0.790 0.760 0.790 0.760 0.760 0.755 0.765 0.750 0.760 0.760 0.740
CSEDU 2025 - 17th International Conference on Computer Supported Education
296
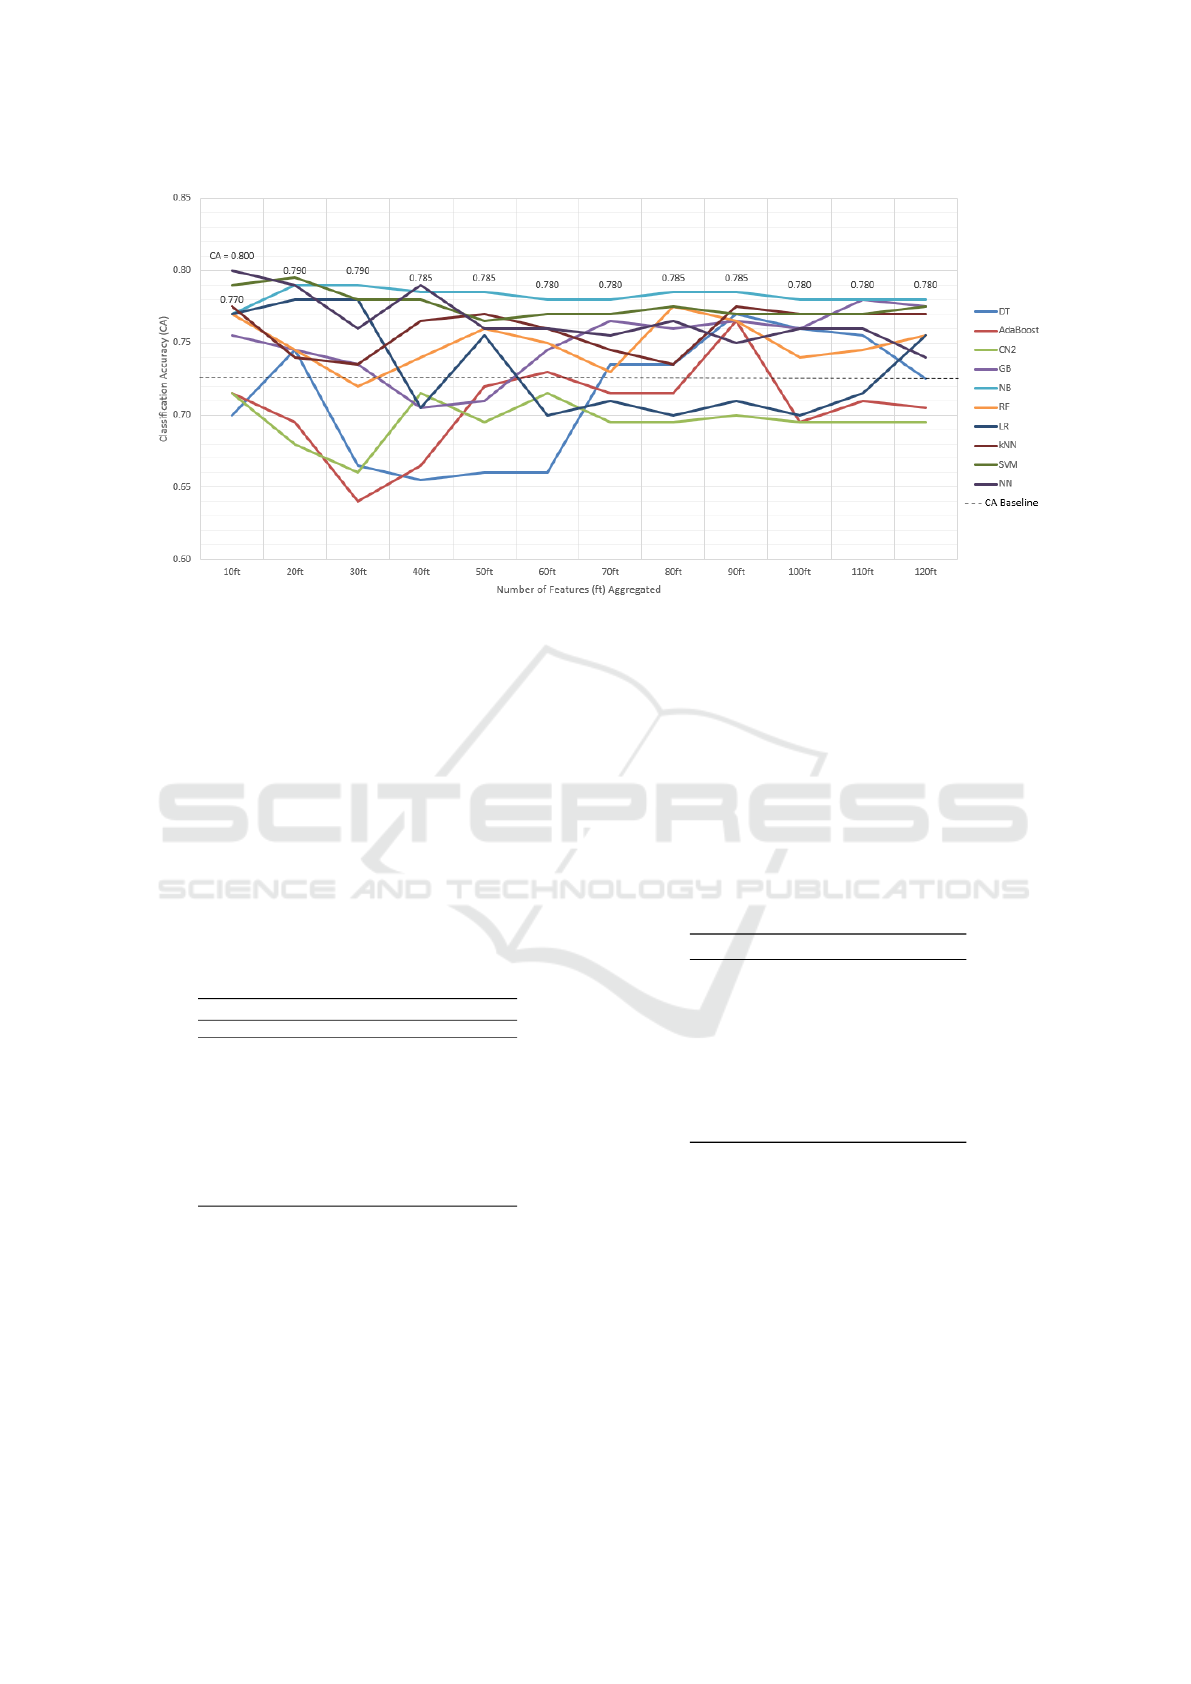
Figure 2: Scenario 1: Machine-learning algorithms performance based on feature aggregation with Accuplacer classification.
Assessing the Impact of DES Features
To better gauge the impact of DES features on
the overall classification task, the 30 CTAP fea-
tures—where NB reached its asymptote—were com-
bined with all 11 DES features. The resulting CA
scores are shown in Table 11, with scores exceed-
ing NB’s CA of 0.790 highlighted in bold. The final
column compares the CA differences with 30 CTAP
features alone to their combination with DES fea-
tures, where positive values indicate improved accu-
racy, and negative values reveal a hindrance to the
models’ performance by this addition.
Table 11: CA scores: top-ranked 30 plus DES features.
CA Model Performance Comparison
Model w/30ft w/30ft+11 DES Difference
DT 0.665 0.750 +8.5%
AdaBoost 0.640 0.705 +6.5%
CN2 0.660 0.640 -2.0%
GB 0.735 0.760 +2.5%
NB 0.790 0.795 +0.5%
RF 0.720 0.755 +3.5%
LR 0.780 0.785 +0.5%
kNN 0.735 0.735 No difference
SVM 0.780 0.810 +3.0%
NN 0.760 0.805 +4.5%
Most models improved their performance with the
addition of DES features. DT and AdaBoost showed
the most significant gains (+8.5% and +6.5%), while
CN2 experienced a slight decline in accuracy (-2%).
The NB remained stable with a modest 0.5% gain.
SVM and NN achieved CA scores of 0.810 and 0.805,
improving by 3% and 4.5%, respectively. These find-
ings highlight the significance of DES features as key
indicators of students’ writing abilities in DevEd.
4.2 Scenario 2: Classification Using
Human-Assigned Skill Levels
Lastly, the resampled dataset of 272 text units (136
for Level 1 and 136 for Level 2), balanced by level fol-
lowing human assessment as described in Section 3.4,
was classified using all 445 features, with the human-
assigned skill levels as the target variable. The results
from this experiment are presented in Table 12.
Table 12: CA scores, F1, Precision, and Recall for all mod-
els with 445 features with Human classifications.
Model CA F1 Prec Recall
CN2 0.552 0.553 0.554 0.552
LR 0.558 0.555 0.564 0.558
AdaBoost 0.608 0.608 0.609 0.608
kNN 0.613 0.613 0.615 0.613
NB 0.635 0.631 0.649 0.635
GB 0.635 0.635 0.639 0.635
NN 0.657 0.657 0.662 0.657
DT 0.674 0.674 0.674 0.674
RF 0.674 0.674 0.674 0.674
SVM 0.713 0.711 0.715 0.713
Overall, the ML algorithms did not surpass
the previously established 0.727 baseline CA score.
However, the SVM model was the highest-performing
model, with a score of 0.713. To further understand
the algorithms’ performance, the most discrimina-
tive attributes across COH-METRIX, CTAP, and DES
were identified using the Information Gain ranking
method. The top 30 features are included in Table 13.
When compared to the ranking of the features pre-
sented in Section 4.1, some shifts in feature rank-
ings were noted, reflecting differences in how hu-
man raters and automated systems interpret linguis-
Refining English Writing Proficiency Assessment and Placement in Developmental Education Using NLP Tools and Machine Learning
297

Table 13: Scenario 2: Combined top-ranked 30 features from COH-METRIX, CTAP, and DES by Information Gain scores.
Rank Source Feature Description Info. gain
1 COH-Metrix Paragraph length, number of sentences in a paragraph, mean 0.144
2 COH-Metrix Lexical diversity, VOCD, all words 0.142
3 CTAP Lexical Sophistication: Easy noun tokens (NGSL) 0.124
4 COH-Metrix LSA given/new, sentences, mean 0.124
5 CTAP Lexical Richness: Type Token Ratio (STTR NGSLeasy Nouns) 0.118
6 COH-Metrix Lexical diversity, MTLD, all words 0.115
7 CTAP Number of POS Feature: Plural noun Types 0.109
8 COH-Metrix LSA given/new, sentences, standard deviation 0.109
9 DES EXAMPLE 0.103
10 CTAP POS Density Feature: Existential There 0.102
11 COH-Metrix Positive connectives incidence 0.100
12 COH-Metrix LSA overlap, adjacent sentences, mean 0.100
13 CTAP Number of POS Feature: Existential there Types 0.099
14 CTAP Number of POS Feature: Preposition Types 0.099
15 COH-Metrix WordNet verb overlap 0.098
16 CTAP Number of Syntactic Constituents: Postnominal Noun Modifier 0.097
17 CTAP Number of Word Types (including Punctuation and Numbers) 0.097
18 CTAP Lexical Sophistication Feature: SUBTLEX Logarithmic Word Frequency (AW Type) 0.096
19 CTAP Number of POS Feature: Existential there Tokens 0.096
20 CTAP Lexical Sophistication: Easy noun types (NGSL) 0.094
21 CTAP Number of POS Feature: Verbs in past participle form Types 0.092
22 COH-Metrix LSA verb overlap 0.092
23 CTAP Number of Unique Words 0.092
24 CTAP Number of Tokens with More Than 2 Syllables 0.090
25 CTAP Number of Word Types with More Than 2 Syllables 0.086
26 CTAP Lexical Richness: HDD (excluding punctuation and numbers) 0.086
27 CTAP POS Density Feature: Possessive Ending 0.086
28 CTAP Number of Syntactic Constituents: Complex Noun Phrase 0.084
29 CTAP Number of POS Feature: Plural noun Tokens 0.083
30 CTAP Referential Cohesion: Global Lemma Overlap 0.083
tic patterns. Most of the highest-ranked features de-
rived from CTAP (67.5%), with a much smaller pro-
portion from COH-METRIX (11%). Two DES fea-
tures (5%)—EXAMPLE(Information Gain: 0.103)
and ORT (Information Gain: 0.082)—were ranked
9th and 31st, respectively.
The presence of these two DES features (EXAM-
PLE and ORT) within the top 31 may highlight the
importance of human-derived features in the task,
though a good approximation of the other features
might have been obtained by mechanical methods as
well. These features also seem to enable a more de-
tailed assessment of students’ writing abilities before
entering an academic program, providing valuable in-
sights into their communication effectiveness (Kim
et al., 2017).
To prepare for the next step in this classification
task, all features were also tested by grouping them
in bundles of 10, using their Information Gain scores,
and incrementally adding them to observe asymptotic
trends in the results. Table 14 summarizes the impact
of these feature bundles (10 bundles, 120 features to-
tal) on the classification accuracy (CA) of the ML al-
gorithms used. Bolded CA scores represent the high-
est score achieved by the ML algorithms with differ-
ent feature bundles, while scores exceeding the base-
line of 0.727 are italicized. Figure 3 depicts the out-
comes of Experiment 4.2.
Out of all the algorithms tested, four (CN2, DT,
AdaBoost, and kNN) underperformed relative to the
0.727 baseline, with CN2 and kNN yielding the low-
est results and showing no significant CA improve-
ments as features were added. Conversely, SVM,
RF, LR, and NB performed better, often surpassing
the 0.727 baseline. Notably, the NB model achieved
a CA of 0.779 with just 10 features, though scores
declined slightly as more features were added, re-
maining above 0.727 with the first 30 features. LR
peaked at 0.785 with 40 features, an improvement
of nearly 6% from the baseline, before its accuracy
decreased, on average, by about 12% in subsequent
iterations. SVM maintained consistent performance
above 0.727, in most instances, reaching an asymp-
totic line at 70 features (CA = 0.740).
The enhanced CA score of almost 80% achieved
by LR indicates some improvements by signaling that
instead of misclassifying 3 students, only 2 face incor-
rect placement, with one more student now receiving
the essential support needed in college.
Assessing the Impact of DES Features
After achieving a peak CA of 0.785 with LR with 40
features, a combination of these top features and the
remaining 9 DES features (2 were already included in
the top 40) was tested to evaluate whether the addition
of more DES features improved accuracy. The result-
ing CA scores are shown in Table 15, with scores of at
least 0.785 in bold. The final column contains the dif-
ference, with positive values indicating an improve-
ment and negative values revealing a decrease in the
models’ accuracy.
In comparison to the first scenario (Section 4.1),
four ML algorithms (DT, GB, LR, and NN) exhibited
CSEDU 2025 - 17th International Conference on Computer Supported Education
298
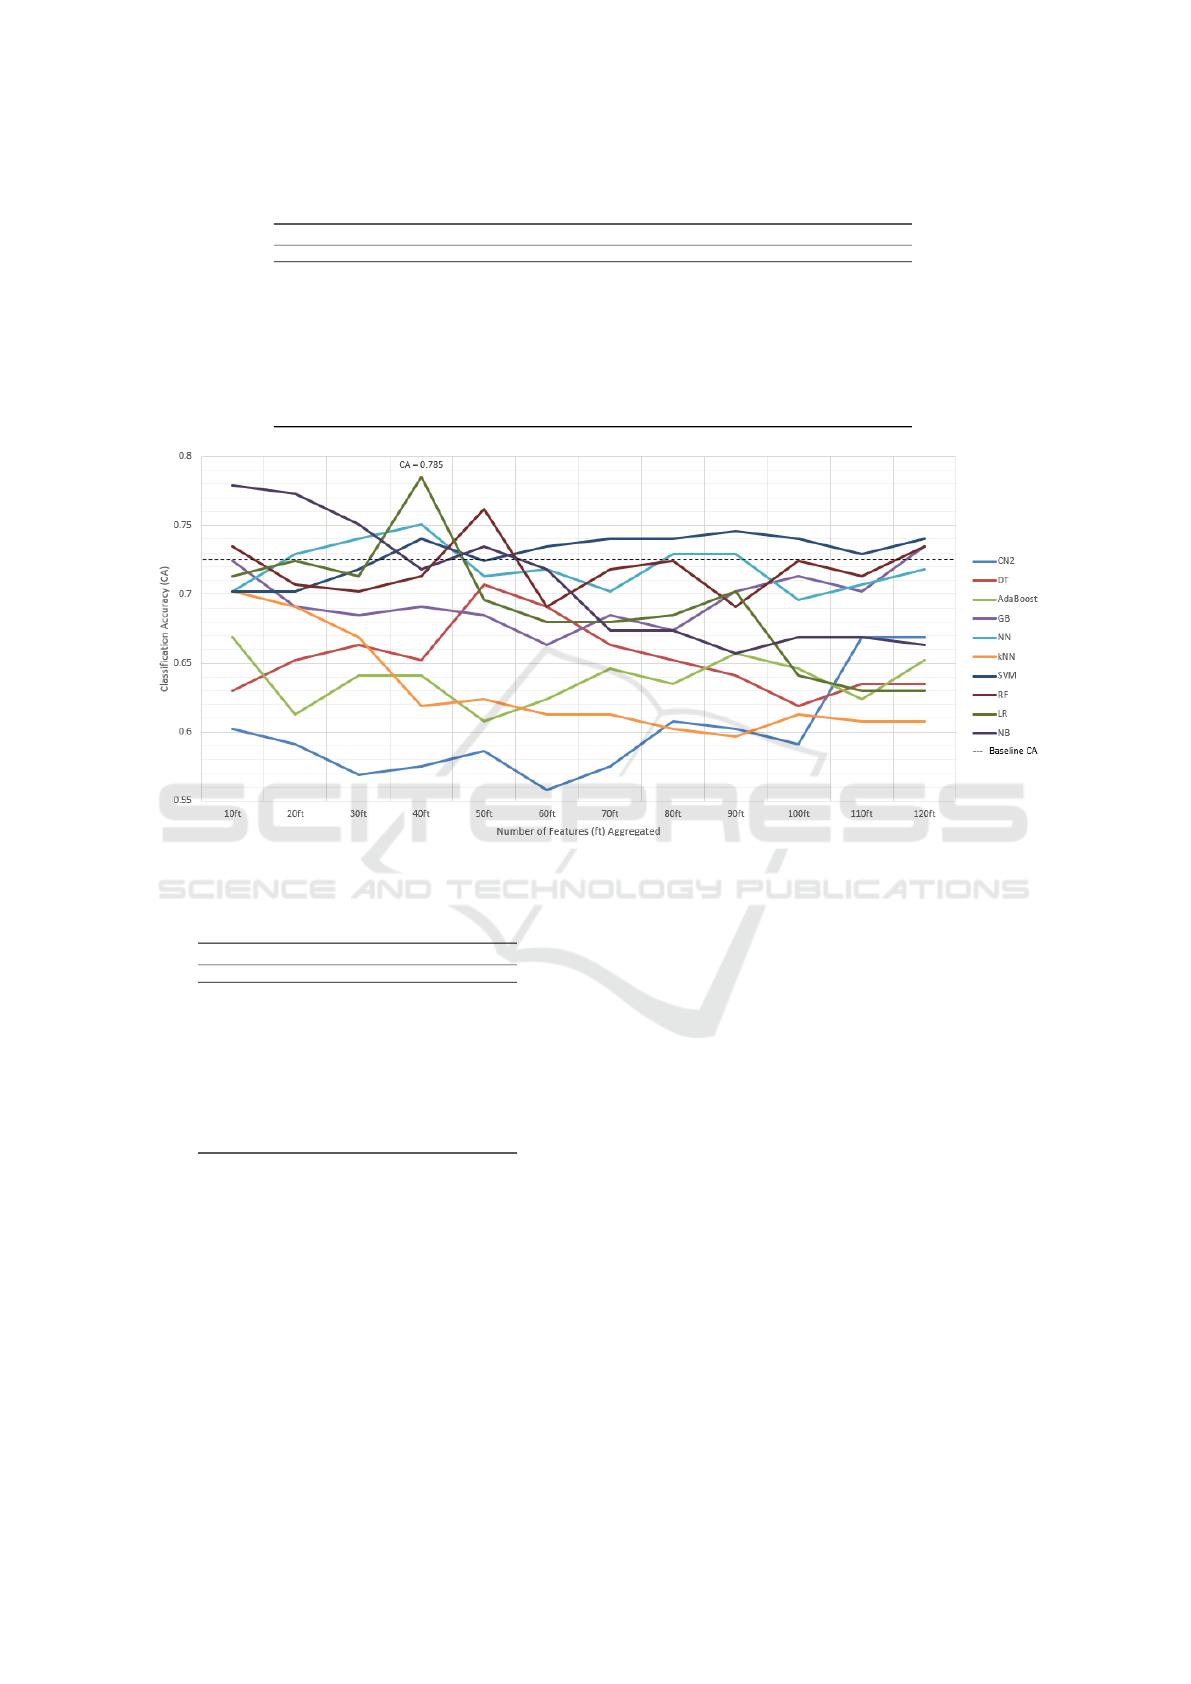
Table 14: Scenario 2: CA scores for top 120 features in bundles of 10 across 10 ML models.
Classification Accuracy (CA) Scores
Model 10ft 20ft 30ft 40ft 50ft 60ft 70ft 80ft 90ft 100ft 110ft 120ft
CN2 0.602 0.591 0.569 0.575 0.586 0.558 0.575 0.608 0.602 0.591 0.669 0.669
DT 0.630 0.652 0.663 0.652 0.707 0.691 0.663 0.652 0.641 0.619 0.635 0.635
AdaBoost 0.669 0.613 0.641 0.641 0.608 0.624 0.646 0.635 0.657 0.646 0.624 0.652
GB 0.724 0.691 0.685 0.691 0.685 0.663 0.685 0.674 0.702 0.713 0.702 0.735
NN 0.702 0.729 0.740 0.751 0.713 0.718 0.702 0.729 0.729 0.696 0.707 0.718
kNN 0.702 0.691 0.669 0.619 0.624 0.613 0.613 0.602 0.597 0.613 0.608 0.608
SVM 0.702 0.702 0.718 0.740 0.724 0.735 0.740 0.740 0.746 0.740 0.729 0.740
RF 0.735 0.707 0.702 0.713 0.762 0.691 0.718 0.724 0.691 0.724 0.713 0.735
LR 0.713 0.724 0.713 0.785 0.696 0.680 0.680 0.685 0.702 0.641 0.630 0.630
NB 0.779 0.773 0.751 0.718 0.735 0.718 0.674 0.674 0.657 0.669 0.669 0.663
Figure 3: Scenario 2: Machine-learning algorithms performance based on feature aggregation with human rater classification.
Table 15: CA scores: top-ranked 40 plus remaining 9 DES
features.
CA Model Performance Comparison
Model w/40ft w/40ft+9 DES Difference
DT 0.652 0.635 -1.7%
AdaBoost 0.641 0.663 +2.2%
CN2 0.575 0.591 +1.6%
GB 0.691 0.635 -5.6%
NB 0.718 0.785 +6.7%
RF 0.713 0.751 +3.8%
LR 0.785 0.713 -7.2%
kNN 0.619 0.669 +5%
SVM 0.740 0.746 +0.6%
NN 0.751 0.735 -1.6%
declines in CA scores, with LR experiencing the most
significant drop of 7.2%. Conversely, models like Ad-
aBoost, RF, kNN, SVM, and NN showed moderate
improvements, averaging 2.64%, though their scores
remained below the 0.785 threshold.
Notably, the NB model matched the highest CA
score of 0.785 achieved by LR with the combined 40
features, consistent with its strong performance in the
first scenario. While some models faced declines, in-
cluding DES features continues to yield valuable in-
sights into writing performance. This is further vali-
dated by the consistent performance of NB, a model
recognized in the literature for its effectiveness in fea-
ture selection and pattern detection (Hirokawa, 2018).
5 CONCLUSIONS
This study aimed at refining English writing profi-
ciency assessment and placement processes by lever-
aging a 300-essay corpus analyzed using a total of 445
linguistic features. These features were drawn pre-
dominantly from well-established platforms such as
COH-METRIX and CTAP, but also included a set of
11 DES-specific features humanly devised and pre-
viously tested for this task, further emphasizing the
importance of lexical and syntactic complexity anal-
ysis in placement accuracy (Stavans and Zadunaisky-
Ehrlich, 2024). The 300 full-text samples were classi-
fied automatically by ACCUPLACER and, also, inde-
pendently by two trained annotators into the follow-
ing skill levels: Levels 1, 2, and College-level. This
dual classification approach provided a comprehen-
sive basis for comparing automated and human eval-
uations.
Refining English Writing Proficiency Assessment and Placement in Developmental Education Using NLP Tools and Machine Learning
299

The study contributes to ongoing efforts in refin-
ing feature selection for text classification, support-
ing the argument that high-quality annotated corpora
are essential for reliable automated assessments (Lee
and Lee, 2023; G
¨
otz and Granger, 2024). Using
ORANGE as a data mining tool, top-performing fea-
tures were identified through Information Gain rank-
ings and evaluated for their impact on classification
accuracy (CA) across various machine learning (ML)
models. This testing attempted to replicate the auto-
matic classification process of ACCUPLACER, about
which the literature currently provides limited infor-
mation regarding its methodology and feature selec-
tion process.
DES features such as EXAMPLE and ORT ranked
among the top 40 most discriminative features and of-
fered granular insights into students’ writing abilities
in areas like argumentation and orthographic preci-
sion. They also improved classification accuracy in
several ML models reinforcing prior work on the role
of argumentation, lexical variation, and orthographic
precision in proficiency assessment (Kosiewicz et al.,
2023; Nyg
˚
ard and Hundal, 2024). Additionally, re-
sults align with research demonstrating the efficacy
of feature selection in enhancing classification out-
comes, as seen in studies utilizing COH-METRIX and
CTAP for multilingual language assessment (Okinina
et al., 2020; Leal et al., 2023; Akef et al., 2023).
The inclusion of human classifications in this
study, validated through inter-rater reliability mea-
sures (Pearson and K-alpha inter-rater reliability co-
efficient), provided a critical benchmark for evaluat-
ing the efficacy of both the automated ACCUPLACER
system and the machine learning models showcasing
an alternative approach to reducing misclassification
rates (Hughes and Li, 2019; Link and Koltovskaia,
2023). Unlike ACCUPLACER, which operates as a
“black-box” system with limited transparency, human
raters have the ability to capture nuanced linguistic
features and transitions between proficiency levels.
By combining these approaches, this study demon-
strated improvements in CA, particularly with models
like NB, which consistently matched or outperformed
the baseline accuracy of 0.727 in both classification
scenarios. These findings align with prior research
on the effectiveness of ML in educational applications
(Filighera et al., 2019).
The refined feature set and methodology presented
in this study is a critical step in the broader process of
advancing equity in educational outcomes by (i) im-
proving student placement, (ii) reducing misclassifi-
cation, and (iii) supporting targeted instructional in-
terventions. Future efforts will continue to refine and
validate these approaches, ensuring they align with
the complex needs of DevEd in higher education.
ACKNOWLEDGMENTS
This work was supported by Portuguese national
funds through FCT (Reference: UIDB/50021/2020,
DOI: 10.54499/UIDB/50021/2020) and by the
European Commission (Project: iRead4Skills,
Grant number: 1010094837, Topic: HORIZON-
CL2-2022-TRANSFORMATIONS-01-07, DOI:
10.3030/101094837).
We also extend our profound gratitude to the ded-
icated annotators who participated in this task and the
IT team whose expertise made the systematic analysis
of the linguistic features presented in this paper possi-
ble. Their meticulous work and innovative approach
have been instrumental in advancing our research.
REFERENCES
Akef, S., Mendes, A., Meurers, D., and Rebuschat, P.
(2023). Linguistic complexity features for auto-
matic Portuguese readability assessment. In XXXIX
Encontro Nacional da Associac¸
˜
ao Portuguesa de
Lingu
´
ıstica, Covilh
˜
a, Portugal, October 26–28, 2023,
Proceedings 14, pages 103–109. Associac¸
˜
ao Por-
tuguesa de Lingu
´
ıstica.
Bickerstaff, S., Beal, K., Raufman, J., Lewy, E. B., and
Slaughter, A. (2022). Five principles for reforming
Developmental Education: A review of the evidence.
Center for the Analysis of Postsecondary Readiness,
pages 1–8.
Chen, X. and Meurers, D. (2016). CTAP: A Web-Based
Tool Supporting Automatic Complexity Analysis. In
Proceedings of the Workshop on Computational Lin-
guistics for Linguistic Complexity (CL4LC), pages
113–119, Osaka, Japan. The COLING 2016 Organiz-
ing Committee.
Cohen, J. (1988). Statistical power analysis. Hillsdale, NJ:
Erlbaum.
Colucci Cante, L., D’Angelo, S., Di Martino, B., and
Graziano, M. (2024). Text annotation tools: A com-
prehensive review and comparative analysis. In In-
ternational Conference on Complex, Intelligent, and
Software Intensive Systems, pages 353–362. Springer.
Da Corte, M. and Baptista, J. (2022). A phraseology ap-
proach in developmental education placement. In Pro-
ceedings of Computational and Corpus-based Phrase-
ology, EUROPHRAS 2022, Malaga, Spain, pages 79–
86.
Da Corte, M. and Baptista, J. (2024a). Charting the linguis-
tic landscape of developing writers: An annotation
scheme for enhancing native language proficiency. In
Calzolari, N., Kan, M.-Y., Hoste, V., Lenci, A., Sakti,
CSEDU 2025 - 17th International Conference on Computer Supported Education
300

S., and Xue, N., editors, Proceedings of the 2024
Joint International Conference on Computational Lin-
guistics, Language Resources and Evaluation (LREC-
COLING 2024), pages 3046–3056, Torino, Italia.
ELRA and ICCL.
Da Corte, M. and Baptista, J. (2024b). Enhancing writ-
ing proficiency classification in developmental educa-
tion: The quest for accuracy. In Calzolari, N., Kan,
M.-Y., Hoste, V., Lenci, A., Sakti, S., and Xue, N.,
editors, Proceedings of the 2024 Joint International
Conference on Computational Linguistics, Language
Resources and Evaluation (LREC-COLING 2024),
pages 6134–6143, Torino, Italia. ELRA and ICCL.
Da Corte, M. and Baptista, J. (2024c). Leveraging NLP
and machine learning for English (l1) writing assess-
ment in developmental education. In Proceedings of
the 16th International Conference on Computer Sup-
ported Education (CSEDU 2024), 2-4 May, 2024,
Angers, France, volume 2, pages 128–140.
Da Corte, M. and Baptista, J. (2025). Toward consistency
in writing proficiency assessment: Mitigating classifi-
cation variability in developmental education. In Pro-
ceedings of CSEDU 2025, Porto, Portugal. (to ap-
pear).
Dem
ˇ
sar, J., Curk, T., Erjavec, A.,
ˇ
Crt Gorup, Ho
ˇ
cevar, T.,
Milutinovi
ˇ
c, M., Mo
ˇ
zina, M., Polajnar, M., Toplak,
M., Stari
ˇ
c, A.,
ˇ
Stajdohar, M., Umek, L.,
ˇ
Zagar, L.,
ˇ
Zbontar, J.,
ˇ
Zitnik, M., and Zupan, B. (2013). Orange:
Data Mining Toolbox in Python. Journal of Machine
Learning Research, 14:2349–2353.
Duch, D., May, M., and George, S. (2024). Empower-
ing students: A reflective learning analytics approach
to enhance academic performance. In 16th Inter-
national Conference on Computer Supported Educa-
tion (CSEDU 2024), pages 385–396. SCITEPRESS-
Science and Technology Publications.
Edgecombe, N. and Weiss, M. (2024). Promoting equity
in Developmental Education reform: A conversation
with Nikki Edgecombe and Michael Weiss. Center
for the Analysis of Postsecondary Readiness, page 1.
Feller, D. P., Sabatini, J., and Magliano, J. P. (2024). Dif-
ferentiating less-prepared from more-prepared college
readers. Discourse Processes, pages 1–23.
Filighera, A., Steuer, T., and Rensing, C. (2019). Automatic
text difficulty estimation using embeddings and neu-
ral networks. In Transforming Learning with Mean-
ingful Technologies: 14th European Conference on
Technology Enhanced Learning, EC-TEL 2019, Delft,
The Netherlands, September 16–19, 2019, Proceed-
ings 14, pages 335–348. Springer.
Fleiss, J. L. and Cohen, J. (1973). The equivalence of
weighted Kappa and the intraclass correlation coeffi-
cient as measures of reliability. Educational and psy-
chological measurement, 33(3):613–619.
Freelon, D. (2013). Recal OIR: ordinal, interval, and ratio
intercoder reliability as a web service. International
Journal of Internet Science, 8(1):10–16.
Ganga, E. and Mazzariello, A. (2019). Modernzing college
course placement by using multiple measures. Educa-
tion Commission of the States, pages 1–9.
Giordano, J. B., Hassel, H., Heinert, J., and Phillips, C.
(2024). Reaching All Writers: A Pedagogical Guide
for Evolving College Writing Classrooms, chapter
Chapter 2, pages 24–62. University Press of Colorado.
G
¨
otz, S. and Granger, S. (2024). Learner corpus research
for pedagogical purposes: An overview and some re-
search perspectives. International Journal of Learner
Corpus Research, 10(1):1–38.
Hirokawa, S. (2018). Key attribute for predicting student
academic performance. In Proceedings of the 10th In-
ternational Conference on Education Technology and
Computers, pages 308–313.
Huang, Z. (2023). An intelligent scoring system for En-
glish writing based on artificial intelligence and ma-
chine learning. International Journal of System As-
surance Engineering and Management, pages 1–8.
Hughes, S. and Li, R. (2019). Affordances and limitations
of the ACCUPLACER automated writing placement
tool. Assessing Writing, 41:72–75.
Johnson, M. S., Liu, X., and McCaffrey, D. F. (2022). Psy-
chometric methods to evaluate measurement and al-
gorithmic bias in automated scoring. Journal of Edu-
cational Measurement, 59(3):338–361.
Kim, Y.-S. G., Schatschneider, C., Wanzek, J., Gatlin, B.,
and Al Otaiba, S. (2017). Writing evaluation: Rater
and task effects on the reliability of writing scores
for children in grades 3 and 4. Reading and writing,
30:1287–1310.
Kochmar, E., Gooding, S., and Shardlow, M. (2020). De-
tecting multiword expression type helps lexical com-
plexity assessment. arXiv preprint arXiv:2005.05692.
Kosiewicz, H., Morales, C., and Cortes, K. E. (2023). The
“missing English learner”’ in higher education: How
identification, assessment, and placement shape the
educational outcomes of English learners in commu-
nity colleges. In Higher Education: Handbook of The-
ory and Research: Volume 39, pages 1–55. Springer.
Kyle, K., Crossley, S. A., and Verspoor, M. (2021). Mea-
suring longitudinal writing development using indices
of syntactic complexity and sophistication. Studies in
Second Language Acquisition, 43(4):781–812.
Laporte, E. (2018). Choosing features for classifying mul-
tiword expressions. In Sailer, M. and Markantonatou,
S., editors, Multiword expressions: In-sights from a
multi-lingual perspective, pages 143–186. Language
Science Press, Berlin.
Leal, S. E., Duran, M. S., Scarton, C. E., Hartmann, N. S.,
and Alu
´
ısio, S. M. (2023). NILC-Metrix: assess-
ing the complexity of written and spoken language in
Brazilian Portuguese. Language Resources and Eval-
uation, pages 1–38.
Lee, B. W. and Lee, J. H.-J. (2023). Prompt-based learn-
ing for text readability assessment. In In Proceed-
ings of the 18th Workshop on Innovative Use of NLP
for Building Educational Applications (BEA 2023),
pages 1–19. Toronto, Canada. Association forCompu-
tational Linguistics.
Link, S. and Koltovskaia, S. (2023). Automated Scoring of
Writing, pages 333–345. Springer International Pub-
lishing, Cham.
Refining English Writing Proficiency Assessment and Placement in Developmental Education Using NLP Tools and Machine Learning
301

Ma, H., Wang, J., and He, L. (2023). Linguistic features
distinguishing students’ writing ability aligned with
CEFR levels. Applied Linguistics, 45(4):637–657.
McNamara, D. S., Ozuru, Y., Graesser, A. C., and Louw-
erse, M. (2006). Validating CoH-Metrix. In Proceed-
ings of the 28th annual Conference of the Cognitive
Science Society, pages 573–578.
Nyg
˚
ard, M. and Hundal, A. K. (2024). Features of gram-
matical writing competence among early writers in a
Norwegian school context. Languages, 9(1):29.
Okinina, N., Frey, J.-C., and Weiss, Z. (2020). CTAP for
Italian: Integrating components for the analysis of
Italian into a multilingual linguistic complexity anal-
ysis tool. In Proceedings of the 12th Conference
on Language Resources and Evaluation (LREC 2020,
pages 7123–7131.
Pajila, P., Sheena, B., Gayathri, A., Aswini, J., Nalini, M.,
and R, S. S. (2023). A comprehensive survey on
Na
¨
ıve Bayes algorithm: Advantages, limitations and
applications. In 2023 4th International Conference
on Smart Electronics and Communication (ICOSEC),
pages 1228–1234.
Pal, A. K. and Pal, S. (2013). Classification model of
prediction for placement of students. International
Journal of Modern Education and Computer Science,
5(11):49.
Pasquer, C., Savary, A., Ramisch, C., and Antoine, J.-Y.
(2020). Verbal multiword expression identification:
Do we need a sledgehammer to crack a nut? In
Proceedings of the 28th International Conference on
Computational Linguistics, pages 3333–3345.
Roscoe, R. D., Crossley, S. A., Snow, E. L., Varner, L. K.,
and McNamara, D. S. (2014). Writing quality, knowl-
edge, and comprehension correlates of human and au-
tomated essay scoring. The Twenty-Seventh Interna-
tional Florida Artificial Intelligence Research Society
Conference, pages 393–398.
Schober, P., Boer, C., and Schwarte, L. A. (2018). Corre-
lation coefficients: appropriate use and interpretation.
Anesthesia & Analgesia, 126(5):1763–1768.
Stavans, A. and Zadunaisky-Ehrlich, S. (2024). Text struc-
ture as an indicator of the writing development of de-
scriptive text quality. Journal of Writing Research,
15(3):463–496.
Vajjala, S. (2022). Trends, limitations and open challenges
in automatic readability assessment research. In Cal-
zolari, N., B
´
echet, F., Blache, P., Choukri, K., Cieri,
C., Declerck, T., Goggi, S., Isahara, H., Maegaard,
B., Mariani, J., Mazo, H., Odijk, J., and Piperidis,
S., editors, Proceedings of the Thirteenth Language
Resources and Evaluation Conference, pages 5366–
5377, Marseille, France. European Language Re-
sources Association.
Vajjala, S. and Lu
ˇ
ci
´
c, I. (2018). OneStopEnglish corpus:
A new corpus for automatic readability assessment
and text simplification. In Tetreault, J., Burstein, J.,
Kochmar, E., Leacock, C., and Yannakoudakis, H.,
editors, Proceedings of the Thirteenth Workshop on
Innovative Use of NLP for Building Educational Ap-
plications, pages 297–304, New Orleans, Louisiana.
Association for Computational Linguistics.
Vajjala, S. and Meurers, D. (2012). On improving the ac-
curacy of readability classification using insights from
second language acquisition. In Proceedings of the 7th
Workshop on Building Educational Applications using
NLP, pages 163–173, Montr
´
eal, Canada. Association
for Computational Linguistics.
Wilkens, R., Alfter, D., Wang, X., Pintard, A., Tack, A.,
Yancey, K. P., and Franc¸ois, T. (2022). Fabra: French
aggregator-based readability assessment toolkit. In
Proceedings of the Thirteenth Language Resources
and Evaluation Conference, pages 1217–1233.
CSEDU 2025 - 17th International Conference on Computer Supported Education
302
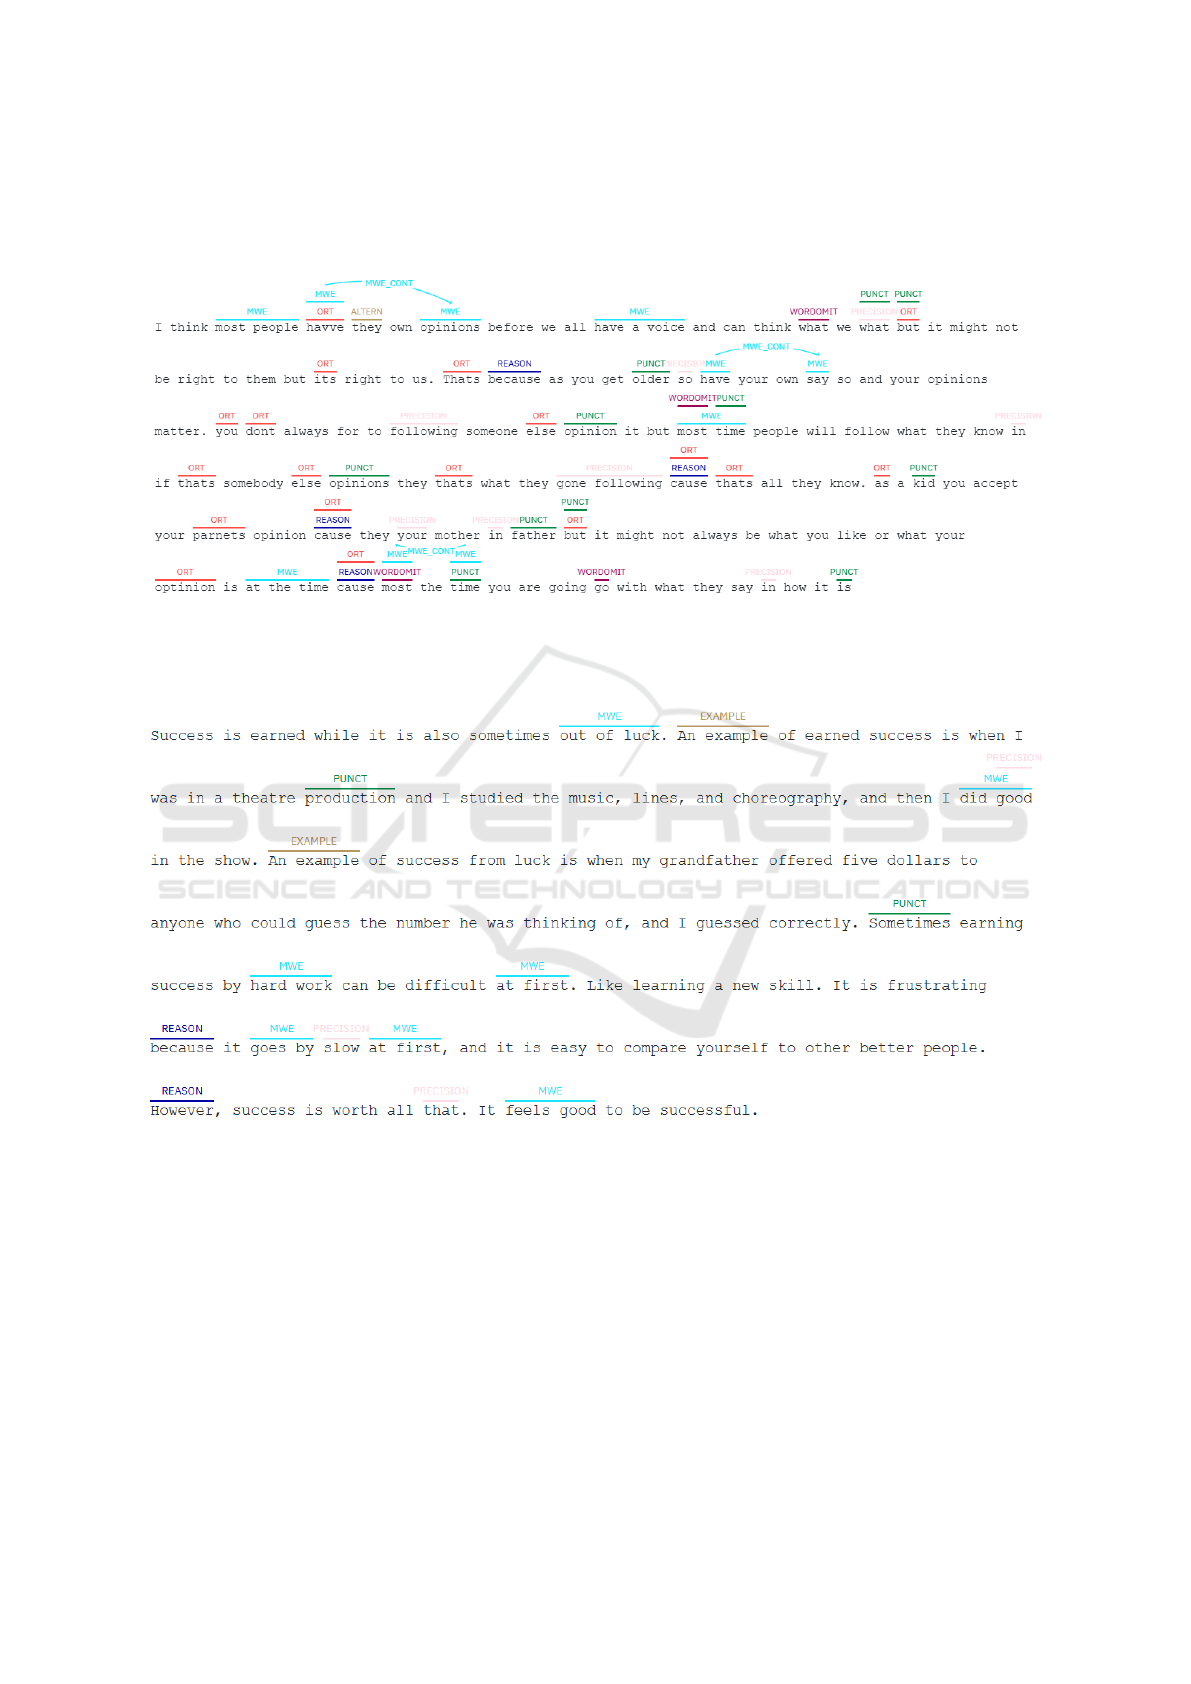
APPENDIX
Text ID: 66, Classified as Level 1 by both raters.
Text ID: 57, Classified as Level 2 by both raters.
Refining English Writing Proficiency Assessment and Placement in Developmental Education Using NLP Tools and Machine Learning
303
