
Intersection with Highly Adaptive Traffic Lights
Can Still Be Suitable for C-ITS Service GLOSA
Thomas Otto
a
, Ina Partzsch and Michael Klöppel-Gersdorf
b
Fraunhofer Institute for Transportation and Infrastructure Systems IVI, Zeunerstraße 38, Dresden, Germany
Keywords: GLOSA, C-ITS, CCAM, Stability Indicators.
Abstract: The C-ITS service “Green Light Optimal Speed Advisory” (GLOSA) is a highly promising Day1.0 services
for efficient, environmentally friendly and safe cooperative transport. It will play a crucial role in the
increasing automation of assistance and driving functions in cooperative connected automated mobility
(CCAM). Over the past three decades, significant efforts have been made to make traffic light signalling as
adaptable as possible to traffic requests. However, there is a common belief that the more flexible the control,
the less reliable the forecast and thus the functionality of GLOSA. This paper introduces stability indicators
to demonstrate that this belief is only partially accurate. The proposed tool allows for the analysis of historical
data from existing systems to derive an indicator for the quality and suitability of the C-ITS GLOSA
application. We demonstrate the feasibility of the approach using real world data from the C-ITS corridor
Hamburg, Germany.
1 OBJECTIVES AN MOTIVATION
Safety and environmental compatibility within the
mobility sector are the main objectives of the coming
years and an essential building block for ensuring an
efficient mobility transition. With increasing
automation and cooperation between the
infrastructure and the vehicles via so-called Car2X
communication, the prerequisites for this are being
created. The need for C-ITS services will increase as
they can be directly integrated into driving functions
of automated and autonomous vehicles. All services
of cooperative intelligent transport systems (C-ITS)
serve to improve traffic safety, increase the efficiency
of the traffic network or ensure environmentally
friendly transport. On the one hand, these C-ITS
applications can be warning services (e.g., traffic jam
warning, road works warning, accident warning) but
also information services (e.g., traffic light phase
assistant, route recommendations, speed limits).
Traffic lights are and remain the bottlenecks of
urban traffic. Increasing automation and
digitalization will not change that. Where large traffic
volumes collide, the only option, also in the future,
will be to separate them temporally. This need will
a
https://orcid.org/0000-0003-0099-9363
b
https://orcid.org/0000-0001-9382-3062
remain as long as not all road users are connected and
automated. Since we always take pedestrians and
cyclists into account in urban areas - which also
contributes to the climate aims - there will be not
more intersections without traffic lights in the
foreseeable future. This makes it even more necessary
to efficiently utilize the previously unused potential
of signalized intersections. To this aim, cooperative
systems offer a range of services that can be used
accordingly. One of the most frequently discussed
services at the moment is the C-ITS service GLOSA.
This is often simply referred to as the traffic light
phase assistant. In addition to transmitting the signal
status information, the GLOSA service also transmits
information about the remaining red and green times.
The forecast algorithm and its accuracy have already
been examined in several research papers, for
example, as statistical prediction model for traffic
lights via Kalman filtering (Protschky et al., 2014),
via support vector machines (Weisheit et al., 2014),
via machine learning algorithm (Scheegans et al.,
2022) or via Markov chain (Otto et al., 2013;
Barthauer et al., 20214). Confidence intervals
regarding switching time difference in consideration
of the lead time to the signal change were first
148
Otto, T., Partzsch, I. and Klöppel-Gersdorf, M.
Intersection with Highly Adaptive Traffic Lights Can Still Be Suitable for C-ITS Service GLOSA.
DOI: 10.5220/0013354500003941
Paper published under CC license (CC BY-NC-ND 4.0)
In Proceedings of the 11th International Conference on Vehicle Technology and Intelligent Transport Systems (VEHITS 2025), pages 148-156
ISBN: 978-989-758-745-0; ISSN: 2184-495X
Proceedings Copyright © 2025 by SCITEPRESS – Science and Technology Publications, Lda.
discussed in (Bodenheimer et al., 2015). The GLOSA
service also transmit speed recommendations for the
optimal approach to the intersection via the
SPATEM/MAPEM C-ITS message.
Coordinated roads and thus the use of GLOSA is
subject to certain boundary conditions, which are
described in (Otto et. al., 2010; Genser, 2022). This is
the problem that is currently often discussed in
research papers. The hypothesis here is often that the
more flexible the control, the less reliable the forecast
and thus the functionality of GLOSA. The efforts of
the last 30 years to implement the most flexible
control possible, which adaptively takes into account
the needs of all road users, seem to be in extreme
contradiction to the requirement for a stable forecast
for the GLOSA service. Due to certain boundary
conditions in the transport network, there are
conditions that are ideal for the quality of the forecast.
These are, for example, coordination. This is exactly
where this hypothesis can be refuted. Research on this
was already carried out (Eckhoff et al., 2013; Eteifa
et al., 2021; Krumnow, 2023; Mellegård et al., 2020;
Suzuki et al., 2020).
Increasing digitalization is clearly accompanied
by increasing availability of data. This not only
happens spatially, but the requirements for temporal
access - such as real-time capability – also underwent
a complete change. Current requirements are not
comparable to the requirements on conventional
traffic management systems and applications. Until
recently, it was not necessary for traffic monitoring
and control to meet real-time requirements. However,
due to increasing digitalization, the necessities of
connected and automated driving, security
requirements, and new services in the C-ITS area,
cities and municipalities are facing completely new
challenges. This is one of the reasons for the current
focus is on transport infrastructure. There is an
enormous amount of catching up to do in terms of
open data provision while at the same time
implementing security mechanisms for the critical
infrastructure as well as dedicated user and rights
management.
Virtual traffic lighting is also often discussed in
the literature (Bazzi et al., 2016; Zhang et al., 2018).
In this case, physical signals could be completely
dispensed with. However, since a physical signal will
always be necessary for VRUs such as cyclists and
pedestrians, this approach will not be considered
further here.
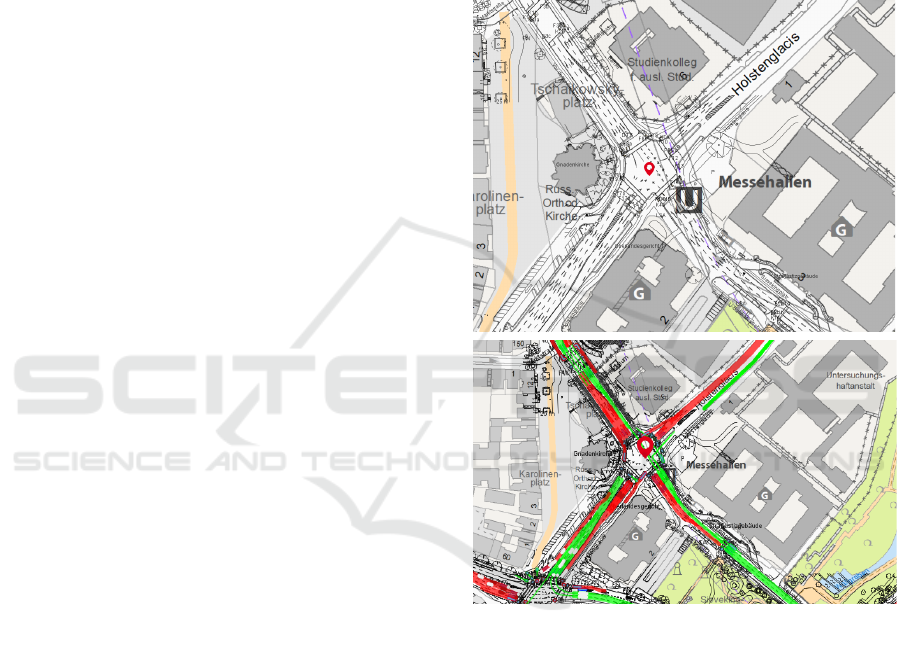
For the reasons mentioned, so-called open data
access to data from the operational transport
infrastructure has so far been rare. The city of
Hamburg is one of the pioneers in Germany in this
regard. Real-time data from a variety of traffic lights
in Hamburg can be accessed via Hamburg’s urban
data platform or the Mobilithek as national access
point for ITS data in Germany. The data set contains
process data for a large number of intersections in
Hamburg. Among other things, current signal state
information can be accessed in real-time. There is
also data from detector inputs from pedestrians,
cyclists, vehicles, and public transport. An example
of this is shown in Figure. 1.
Figure 1: Open data example – no.537 [geoportal-
hamburg.de] upper: geometry of the intersection including
signal layout plan lower: current signal status of the LSA
including MAPEM and SPATEM information.
This paper introduces stability indicators based on the
publicly available traffic data. Here we build on
previous work (Otto et al., 2022), where we
introduced the theoretical background for the analysis
of signalized intersections. Furthermore, (Jeschor et
al., 2024) show results of a large-scale predictability
evaluation in Hamburg, which also provide
statements about consistency.
The derived tool enables the analysis of historical
data from existing systems to derive an indicator for
the quality and suitability of the C-ITS GLOSA
application. We can show that intersections with
Intersection with Highly Adaptive Traffic Lights Can Still Be Suitable for C-ITS Service GLOSA
149
highly adaptive traffic control schemes can still be
suitable for GLOSA.
2 METHOD
Basis of our analysis is the data set provided by the
city of Hamburg. Our goal was to derive stability
indicators for a wide range of intersection topologies
and traffic volumes. For this reason, the
characteristics of the intersections in question should
be completely different. In the end, we settled on
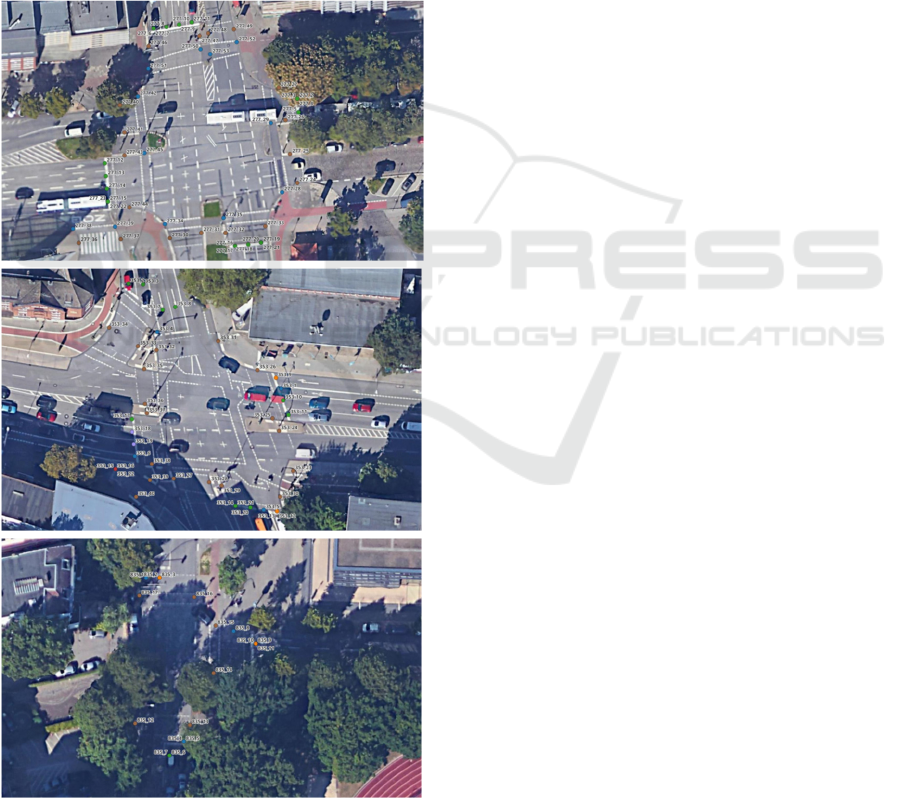
three different intersections (277, 353, 835). The
structural design of these intersections can be seen in
the aerial photos in Figure 2.
Figure 2: Intersections no.277, no.353 and no.835 (up to
down) [maps.google.com] intersection with different
structural characteristics as well as different traffic volumes
and relations.
The chosen intersections can be described as follows:
Intersection no.277: This is the largest
intersection in the selected subset. Traffic
volumes are high during peak hours and
signalization is relatively complex. The
systems are designed with traffic-adaptive
control. The signal programs are designed in
such a way that they can react to traffic
fluctuations during the day. Cycling and
pedestrian traffic are carried on almost all
routes.
Intersection no.353: This is a relatively typical
intersection with a medium geographical
extent. The traffic load also differs throughout
the day, to which the implemented adaptive
control can react.
Intersection no.835: Within the specified
selection, this is a T-intersection that has the
lowest complexity.
Our analysis is based on the signaling parameters of
the intersections. Our research hypothesis is that these
alone are sufficient to find stability indicators,
regardless of intersection layout and size. The
following parameters were examined:
Number of signal programs and activated times
of these programs,
Cycle time of signal programs throughout the
day,
Length of the green time and area of the green
time based on the cycle second,
Sequences of green times in cycle and variation
of the sequences,
Variation of green start and green end of the
signal groups in the cycle based on the signal
program,
Relation via matrices of the start times and end
times of the signal groups to each other to
analyze the interval,
Representation of the probabilities of the signal
groups for green in the cycle based on the data.
Based on the parameters mentioned above, it should
be determined which of these factors can be used
significantly to map the GLOSA suitability of
adaptive controls.
3 RESULTS
The results are evaluated based on the three
intersections described above. To simplify the
presentation, only the results of intersection 353 are
VEHITS 2025 - 11th International Conference on Vehicle Technology and Intelligent Transport Systems
150
presented and shown specific in this paper. This is
intended to facilitate general understanding and
provide an easy introduction to the scientific
evaluations of the tool.
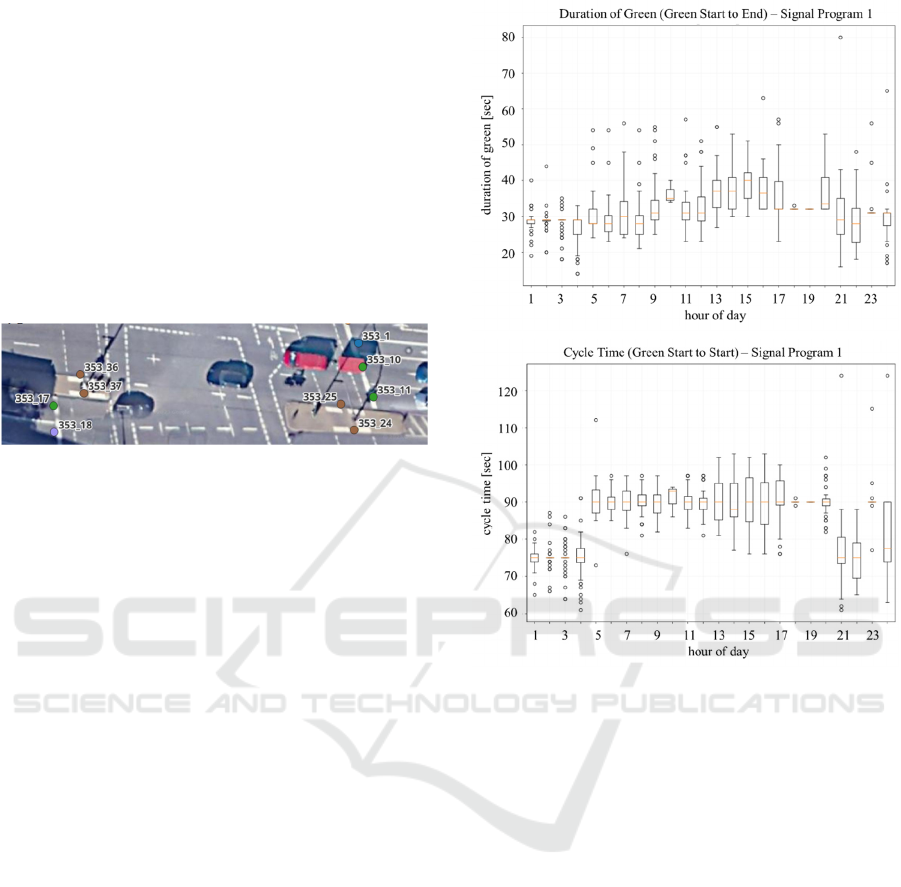
3.1 Geo Data
The geographical coordinates of the individual signal
groups at the intersection were extracted from the
data and clearly displayed using the GIS program
QGIS and the Google satellite map. Fig. 3 shows
intersection 353 with all primary signal groups. The
signal groups are separated by color according to lane
type.
Figure 3: Visualization of geo data at intersection 353 – no
of intersection as well as no of signal controller
[maps.google.com].
In addition to vehicle and pedestrian signal groups,
there are also signal groups for bicycle and bus lanes
with the corresponding signaling systems at this
intersection. Mixed lane types are also available. In
total, there are 36 signal groups.
3.2 Length of Green and Cycle Time
First, the duration of the green state for each signal
group at the intersection was determined from the
data. For this purpose, the observation times for
vehicle, bus and bicycle signal groups were extracted
from the existing data. The selected data were sorted
according to its time in order to determine the time
difference in seconds between successive green and
amber, green and red or green and dark. The
following Figure 4 upper part shows an example of
the green phase duration for the vehicle signal group
353_10. The times were grouped on the x-axis by the
hours of the day and presented with boxplots. It can
be seen from the figure that the green times show a
large variance with the exception of 00:00 to 03:00,
17:00 to 19:00 and 22:00 to 23:00.
A similar procedure was used to determine the
cycle times. For this purpose, only times with signal
state green were extracted from the data. Regardless
of the lane type, the cycle time was then determined
from the sorted data using the time differences
between two consecutive green. The following Fig 4
lower part shows the cycle time using the example of
the vehicle signal group 353_10. Similar to the green
Figure 4: Intersection no.353 – upper: duration of green
phases for signal program 1 and signal group 353_10
throughout the day lower: duration of cycle time for signal
program 1 and signal group 353_10 throughout the day.
stages, the cycle times also show variances, with
the exception of the times from 00:00 to 03:00, 17:00
to 19:00 and 22:00 to 23:00. Furthermore, it becomes
clear that the average from 00:00 to 04:00 and 20:00
to 22:00 is 75 seconds, while at the other times with
the exception of the three hours from 09:00 to 10:00
a.m. as well as 1:00 p.m. to 2:00 p.m. and 11:00 p.m.
to midnight is 90 seconds. (see Figure 4 lower part)
3.3 Signal Programs
In the next step, the signal program data was
evaluated separately for each signal group.
For this purpose, all observation times were
recorded from the data using the respective signal
program and sorted by time. The observation time
indicates the time of switching to another program. In
the following Figure 5, the data for a period of three
days from February 1st, 2023 (Wednesday) to
February 3rd, 2023 (Friday) was presented.
Intersection with Highly Adaptive Traffic Lights Can Still Be Suitable for C-ITS Service GLOSA
151
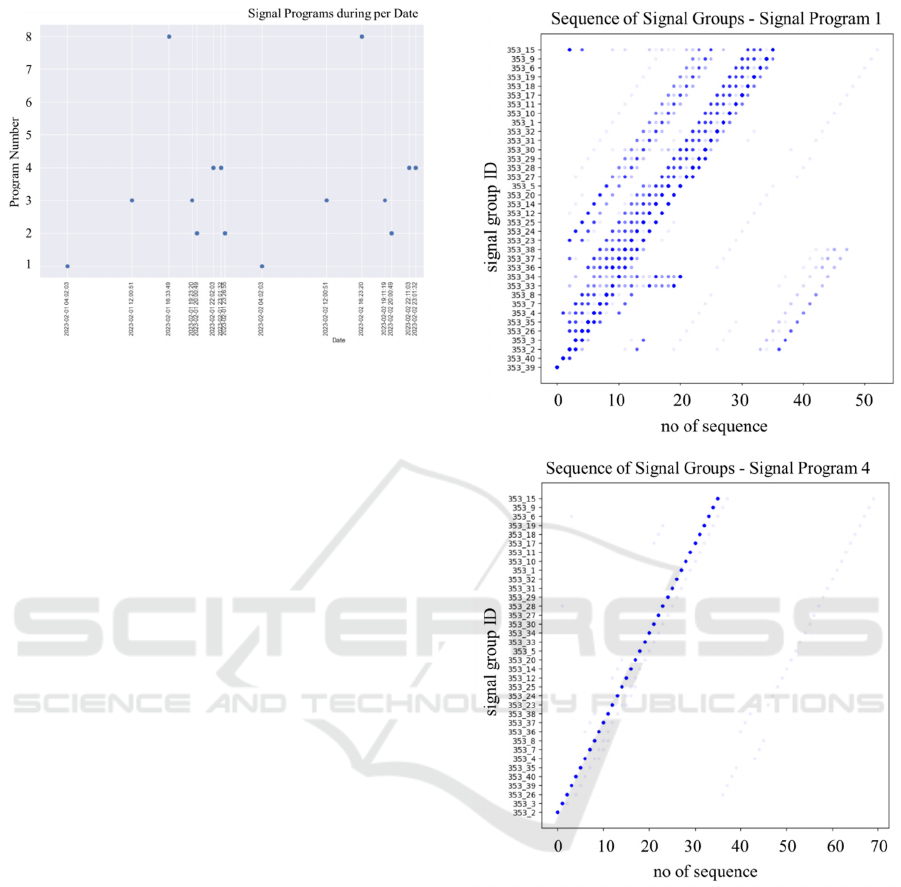
Figure 5: Intersection no.353 – current no of signal
programs throughout the day.
3.4 Sequences
In the first step of the evaluation, the sequence was
determined. This indicates the order in which the
signal groups switch to green, taking into account the
current signal program. For this purpose, only the
observation times in which the signal color was green
were extracted from the data. These dates were sorted
by their time. The entire day's data was then assigned
to the current signal program according to its time.
The first signal group in the series is the one with the
lowest time in the signal program data group. This
signal group is fixed at position 1. The sequences are
then recorded according to their time. A new
sequence starts with the next recurrence of the fixed
signal group. The following figures show examples
of the signal group sequences for two signal
programs.
The frequency of the sequences was made
visually visible using transparent dots. Sequences
shown in very pale blue occur only rarely, while the
main strands are marked in strong blue. The
representations show significant differences in the
variance of the sequences. While the signal programs
1 have a large number of sequences and sometimes
have several main sequences, a clearly fixed sequence
can be seen in the signal programs 4.
3.5 Start and end Times of Green
Signal
To evaluate the specific green start and green end
times within the signal group sequence, the
observation times were extracted from the data,
which contained the signal colors green to amber for
Figure 6: Intersection no.353 – sequence of signal groups -
upper: program 1 – lower: program 4.
the vehicle signal groups or green to red for the
pedestrian signal groups. The data was assigned to the
current signal program according to its time.
Analogous to the procedure for determining the signal
group sequence, the first signal group to appear was
fixed and the sequences were then determined based
on the data with the signal color green. The following
figures show the results for the signal programs.
The time difference in seconds to the fixed signal
group at position 1 is plotted on the x-axis. The
transparency of the points indicates the frequency of
occurrence of the green start (shown in green) and
VEHITS 2025 - 11th International Conference on Vehicle Technology and Intelligent Transport Systems
152
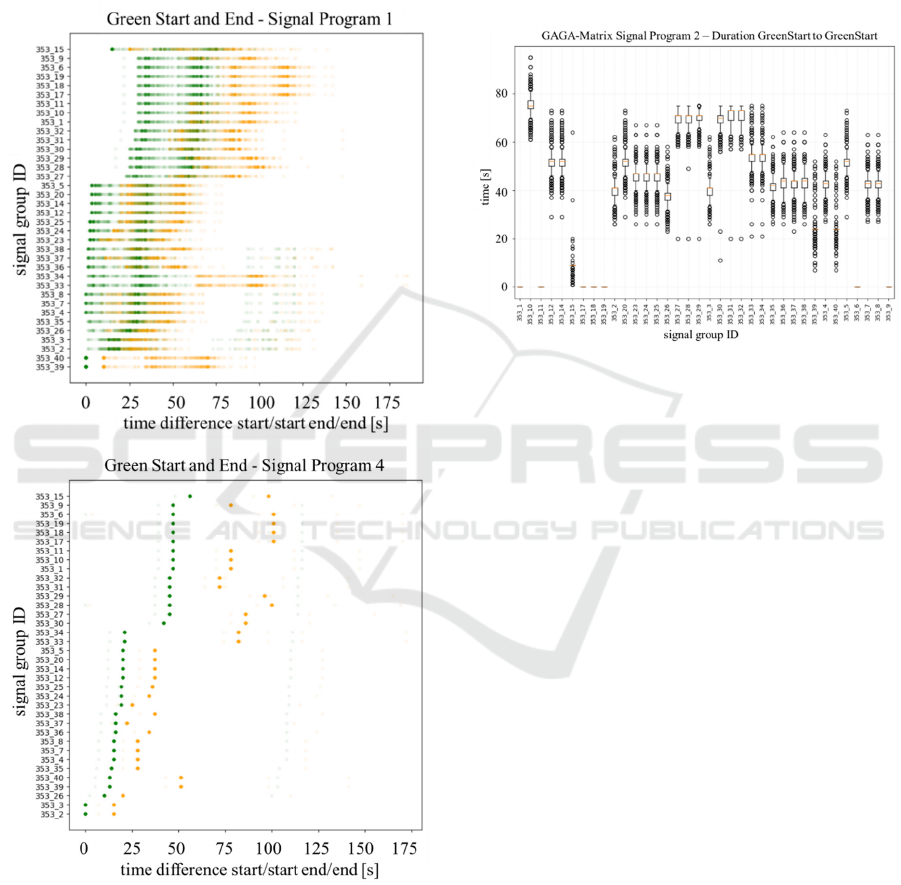
green end times (shown in orange). As with the
determination of the sequences, it is also clearly
visible from these figures that signal programs 1 has
a clear variance in the green start and green end times,
while signal programs 4 largely has fixed time
differences as well as fixed green start and green end
times.
Figure 7: Intersection no.353 – start/end green upper:
program 1 – lower: program 4.
3.6 Matrix Interval Between Signal
Groups
An essential factor for the evaluation is the time
intervals between the signal groups. Before the
matrices could be set up, the specific times between
the green starts (GA) and ends (GE) in all four
combinations (GAGA, GEGA, GAGE, GEGE) as
well as their variance had to be determined. The
following figure shows an example of the result of the
GAGA time differences for the vehicle signal group
353_10 in signal program 2. All signal groups are
plotted on the x-axis.
Figure 8: GAGA-matrix signal program 2 – example of
duration between greenstart and next greenstart.
In this case (GAGA time difference), the cycle time
is shown for the signal group 353_10 to itself. It can
be seen that without exception the signal group
353_10 switches to green at the same time as the
signal groups 353_1, 353_11, 353_17, 353_18,
353_19, 353_6 and 353_9, since the time difference
here is 0 in each case. Fixed time differences can also
be seen for the signal groups 353_15, 353_39 and
353_49, although there are some outliers. This gives
a clear indication of the interval in the stage
transition. For all other signal groups, time
differences with significant variances can be seen.
The box plots were drawn up for each individual
signal group and for all four combinations (GAGA,
GEGA, GAGE, GEGE). They form the data basis for
the matrices.
The intervals of the box plots from the bottom to
the top whiskers were first determined in the matrices.
To assess and visualize the forecast of the green starts
and ends of a signal group relative to the times of the
other signal groups. The intervals were classified into
the groups 0 to 3 seconds (green, well predictable), >
3 to 7 seconds (yellow, moderately predictable) and >
7 seconds (red, poorly predictable). The intervals and
their respective classification in this color scale are
shown in the matrices. Example matrices can be seen
in the following figures.
Intersection with Highly Adaptive Traffic Lights Can Still Be Suitable for C-ITS Service GLOSA
153
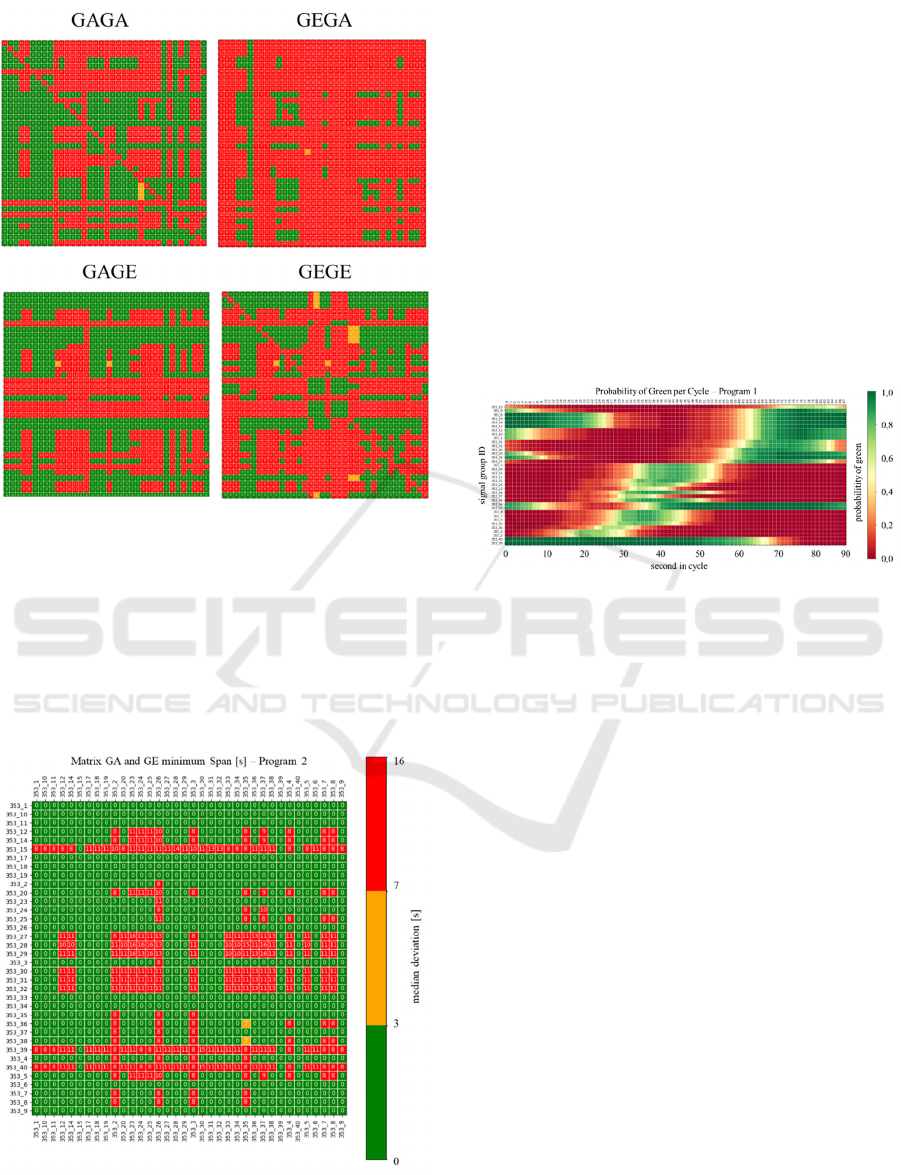
Figure 9: Example matrices of GAGA, GEGA, GAGE and
GEGE – signal program 2.
After setting up the four individual matrices, all
matrices were overlayed. For this purpose, the
individual cell values of the four matrices were
compared with each other. The smallest cell value
from the four matrices is given in the overlay matrix.
The following figure shows the overlay matrix for
signal program 2.
Figure 10: Example matrix green start to green end
minimum span visualization.
The representation shows which signal groups can be
predicted well or poorly with regard to the light signal
changes of another signal group.
3.7 Probability of Green per Cycle
As a final step in the evaluation, the green times per
cycle time were evaluated. For this purpose, the main
strands of the signal group sequence as well as the
green start and green end times were used as a basis.
The green times resulting from the time difference
between the start of green and the end of green were
used to determine the frequency with which the signal
group is switched to green and at what second of
switching. The following figure shows an overview
of the green phases for signal program 1.
Figure 11: Intersection no.353 – Probability of green per
cycle- program 1.
The most frequently occurring sequence plus all
sequences with at least 80% similarity of the
respective sequence to the main sequence was used as
the data basis. The intensity of the green or red cells
visualizes the probability with which the signal group
shows the red or green status at the respective cycle
seconds.
Although the intersections in question show a
certain variability in signal programs, cycle time, etc.
our analysis has shown that due to interrelation
between the different signals there follows a certain
predictability of the signal program. This becomes
apparent in Fig. 10, where most cells in the
predictability matrix are zero, i.e., there is at least one
relation (green start/end, red start/end) between the
signals based on a fixed time period. This allows a
high-quality forecast based on current signal states or
more specifically signal state changes. In addition to
this short-term information, historical analysis also
yielded certain signal groups and time periods within
the cycle, where a certain status of the signal can be
assured (comp. Fig. 11).
VEHITS 2025 - 11th International Conference on Vehicle Technology and Intelligent Transport Systems
154

4 CONCLUSIONS
The commonly suggested thesis in research work and
in traffic engineering practice that the more flexible
the control, the less reliable the forecast and thus the
functionality of GLOSA could be refuted in this
research. The efforts of the last 30 years to implement
the most flexible control possible, which adaptively
takes into account the needs of all road users,
apparently contradict the requirement for a stable
forecast for the GLOSA service. In this article, a tool
chain was presented that shows indicators that at least
partially refute this thesis. The tool enables the
analysis of historical data from existing systems to
derive an indicator of the quality and suitability of the
C-ITS GLOSA application.
Based on the presented and differentiated
systems, it is clear that there are defined indicators
that can provide information about the stability of the
forecast both in the planning process and in the
operation of the system. The prediction is then easily
possible for most signal groups despite adaptive
control over the intermediate times. This leads to very
good results within the overall forecast, especially
when superimposing a long-term forecast from
historical data with a short-term forecast using
sequence, cycle time, green time and intermediate
time matrices.
It should be said here that the toolchain mentioned
is evaluated by traffic lights of only one city. The
systems correspond to the typical planning principles
in Germany and Europe. In most cases, rule-based
logic is stored, which has a fixed circulation time.
Furthermore, the traffic light programs are phase-
related controlled, where fixed phase transitions,
minimum and maximum release times and other
boundary conditions such as coordination - so-called
green waves - exist. Obviously, these boundary
conditions do not apply worldwide, but they are easily
applicable throughout Europe.
Finally, it should be noted that the detector inputs
are of course also of crucial importance, especially for
short-term forecasts. This influence has currently
only been taken into account indirectly. The aim of
further investigations will be to determine
correlations between the detector inputs and the
corresponding signal groups. The prioritization in
particular, the registration for the prioritization of
public transport, is often done very early and can
therefore be easily taken into account in the forecast.
This influence will be taken into account in further
analysis and research.
ACKNOWLEDGEMENTS
We would like to thank Julia Erdmann for her
visualizations of the traffic lights data. We also thank
Per-Arno Plötz and Henning David (City of
Hamburg) for valuable input interpreting the traffic
lights data set.
This study was financially supported by the
European Union.
REFERENCES
Barthauer, M., & Friedrich, B. (2014). Evaluation of a
signal state prediction algorithm for car to
infrastructure applications. Transportation Research
Procedia, 3, 982-991.
Bazzi, A., Zanella, A., & Masini, B. M. (2016). A
distributed virtual traffic light algorithm exploiting
short range V2V communications. Ad Hoc Networks,
49, 42-57.
Bodenheimer, R., Eckhoff, D., & German, R. (2015,
October). GLOSA for adaptive traffic lights: Methods
and evaluation. In 2015 7th International Workshop on
Reliable Networks Design and Modeling (RNDM) (pp.
320-328). IEEE.
Eckhoff, David, Bastian Halmos, and Reinhard German
(2013). Potentials and limitations of green light optimal
speed advisory systems. IEEE Vehicular Networking
Conference. IEEE, 2013.
Eteifa, S., Rakha, H. A., Eldardiry, H. M., & Center, E.
(2021). Estimating Switching Times of Actuated
Coordinated Traffic Signals: A Deep Learning
Approach (No. UMEC-039). Urban Mobility & Equity
Center.
Genser, A. (2022). Machine learning for traffic
management in urban transportation networks
(Doctoral dissertation, ETH Zurich).
Jeschor, D., Matthes, P., Springer, T., Pape, S., & Fröhlich,
S. (2024, June). Cloudy with a Chance of Green:
Measuring the Predictability of 18,009 Traffic Lights in
Hamburg. In 2024 IEEE Intelligent Vehicles
Symposium (IV) (pp. 2882-2889). IEEE.
Krumnow, M. (2023). Prädiktion von Signallaufzeiten
verkehrsadaptiver Lichtsignalanlagen zur
Unterstützung von C-ITS Anwendungen.
Mellegård, N., & Reichenberg, F. (2020). The day 1 C-ITS
application green light optimal speed advisory—A
mapping study. Transportation Research Procedia, 49,
170-182.
Otto, T., & Hoyer, R. (2010). Operating conditions of on-
board displayed green wave speeds via V2I-
communication. Proceedings fovus-Network for
Mobility.
Otto, T., Klöppel-Gersdorf, M., & Partzsch, I. (2022,
August). A Framework for Urban C-ITS GLOSA
Evaluation. In Conference on Sustainable Urban
Intersection with Highly Adaptive Traffic Lights Can Still Be Suitable for C-ITS Service GLOSA
155

Mobility (pp. 382-392). Cham: Springer Nature
Switzerland.
Otto, T., & Weichenmeier, F. (2013). Self-learning
algorithm and signal state prognosis at traffic lights for
V2I applications. In Proceedings 20th ITS World
Congress ITS Japan.
Protschky, V., Wiesner, K., & Feit, S. (2014, June).
Adaptive traffic light prediction via Kalman filtering. In
2014 IEEE Intelligent Vehicles Symposium
Proceedings (pp. 151-157). IEEE.
Scheegans, L. E., Heckmann, K., & Hoyer, R. (2022,
September). Exploiting Stage Information for
Prediction of Switching Times of Traffic Actuated
Signals Using Machine Learning. In 2022 12th
International Conference on Advanced Computer
Information Technologies (ACIT) (pp. 544-548). IEEE.
Suzuki, H., & Marumo, Y. (2020). Safety evaluation of
green light optimal speed advisory (GLOSA) system in
real-world signalized intersection. Journal of Robotics
and Mechatronics, 32(3), 598-604.
Weisheit, T., & Hoyer, R. (2014). Prediction of switching
times of traffic actuated signal controls using support
vector machines. In Advanced Microsystems for
Automotive Applications 2014: Smart Systems for
Safe, Clean and Automated Vehicles (pp. 121-129).
Springer International Publishing.
Zhang, R., Schmutz, F., Gerard, K., Pomini, A., Basseto, L.,
Hassen, S. B., ... & Tonguz, O. (2018, August). Virtual
traffic lights: System design and implementation. In
2018 ieee 88th vehicular technology conference (vtc-
fall) (pp. 1-5). IEEE.
VEHITS 2025 - 11th International Conference on Vehicle Technology and Intelligent Transport Systems
156
