
Enhancing Learning with Gamification: Empowering Students in Web
Development Education
Patrizia Sailer
1,2 a
, Thomas Kremsner
3 b
, Franz Knipp
1,2 c
and Fares Kayali
4 d
1
Department of Information Technology, University of Applied Sciences Burgenland, Campus 1, Eisenstadt, Austria
2
Doctoral School Computer Sciences, University of Vienna, Waehringerstrasse 29, Vienna, Austria
3
Energy Transistion, Forschung Burgenland, Campus 1, Eisenstadt, Austria
4
Centre for Teacher Education, University of Vienna, Porzellangasse 4, Vienna, Austria
{patrizia.sailer, thomas.kremsner, franz.knipp}@hochschule-burgenland.at, fares.kayali@univie.ac.at
Keywords:
Web Development Education, Eye-Tracking, Human-Centered-Design, Gamified Learning Platform.
Abstract:
Digitalization has transformed educational practices, extending its impact to non-technical fields by incorpo-
rating technical subjects such as web development. Students from diverse backgrounds frequently encounter
difficulties when attempting to learn web development, often experiencing feelings of being overwhelmed and
frustrated. This study aimed to address student challenges by identifying their needs and developing a sup-
portive tool to enhance their learning experience in web development. Therefore, human-centered design was
used to conduct preliminary interviews with the students in order gain deeper insights into their perceptions
on how to enhance their learning experience. In response to this feedback, a gamified learning platform (GLP)
was designed and developed. Subsequently, the same group of students evaluated the GLP through interviews,
questionnaires and eye-tracking analyses. The evaluation indicated that students perceived the GLP to be a
valuable supplementary tool, although not a comprehensive substitute for conventional methods. The findings
suggest that refining the GLP, e.g. modifying the color scheme, and integrating it with approaches like flipped
classroom could lead to enhanced learning outcomes in subsequent semesters. This study underscores the
importance of student-centered design in developing effective educational tools for technical subjects.
1 INTRODUCTION
In the contemporary era, the multiplicity of academic
pathways in domains such as technology, business,
environmental science or health care affords students
the flexibility to pursue an educational program that
aligns with their individual interests and aptitudes.
However, many non-technical degree programs in-
clude technical disciplines such as web development
as components of their curriculum, despite the fact
that these programmes do not specialize in a techni-
cal field. Consequently, they enter these courses with
disparate backgrounds and prior knowledge, which
presents a challenging aspect for lecturers. In order
to meet the diverse learning needs of the students, it
is essential to consider their individual requirements.
However, given the limited teaching time, which
a
https://orcid.org/0000-0001-7833-9475
b
https://orcid.org/0000-0001-7387-1913
c
https://orcid.org/0009-0002-1811-9782
d
https://orcid.org/0000-0002-0896-4715
rarely allows for intensive individual support, alter-
native approaches are required. In a previous study
(Sailer, 2024), ten affected students were interviewed
to identify the difficulties they experience when learn-
ing web development and to suggest approaches they
would find helpful. This revealed that a personalized
gamified learning platform (GLP) could be a promis-
ing solution. The key needs and expectations of stu-
dents were identified on the basis of the survey re-
sults. These include specific requirements for a GLP
that provides assistance in challenging subject areas
and motivation through gamification elements.
In order to satisfy the stated requirements, a
prestudy of various learning platforms for web de-
velopment was conducted, which revealed that they
frequently failed to meet the essential criteria. For in-
stance, a considerable number of courses are finan-
cially inaccessible to students, the content diverges
from the curriculum and essential thematic elements
are absent. As the existing platforms failed to meet
the desired specifications, it was resolved that a new
GLP would be developed.
Sailer, P., Kremsner, T., Knipp, F. and Kayali, F.
Enhancing Learning with Gamification: Empowering Students in Web Development Education.
DOI: 10.5220/0013354800003932
Paper published under CC license (CC BY-NC-ND 4.0)
In Proceedings of the 17th International Conference on Computer Supported Education (CSEDU 2025) - Volume 2, pages 557-568
ISBN: 978-989-758-746-7; ISSN: 2184-5026
Proceedings Copyright © 2025 by SCITEPRESS – Science and Technology Publications, Lda.
557

The aim of this platform is to improve the qual-
ity of educational resources, while advancing Sustain-
able Development Goal 4 Quality Education, through
the provision of personalized learning content tai-
lored to meet the diverse needs of learners (Alc
´
antara-
Rubio et al., 2022). Therefore, this study aims to
investigate the impact of implementing a gamified
learning platform based on iterative feedback from
students on its perceived usability, usefulness, user
experience and acceptance among the same students.
2 RELATED WORK
2.1 Gamification in Higher Education
Gamification in higher education effectively enhances
engagement, motivation and skill acquisition (Giang,
2013; Kiryakova et al., 2014). Furthermore, the re-
search findings indicate the beneficial impact of gam-
ification across a range of disciplines, with particu-
lar advantages observed in IT education. These in-
clude enhanced participation, problem-solving abili-
ties and satisfaction (Iosup and Epema, 2014; Pa
ˇ
lov
´
a
and Veja
ˇ
cka, 2022). By incorporating elements like
points, levels or badges, it creates personalized, in-
teractive learning experiences that improve pass rates
and comprehension of complex content (Iosup and
Epema, 2014; O’Donovan et al., 2013). An example
is a meme contest in a database administration course,
which used gamification elements to reinforce knowl-
edge, foster creativity and promote social interaction
(L
´
opez-Fern
´
andez et al., 2023). Learning manage-
ment systems (LMS) like Moodle employ gamifica-
tion to provide learners with learning pathways and
adaptive feedback, which serves to enhance motiva-
tion (Poondej and Lerdpornkulrat, 2019).
However, challenges such as technical issues, neg-
ative stereotypes and potential counterproductive ef-
fects highlight the necessity for a cautious approach to
implementation (Nurutdinova et al., 2021; Bl
ˇ
st
´
akov
´
a
and Piwowar-Sulej, 2019). Effective implementations
are contingent upon meaningful and well-structured
designs that are responsive to the diverse needs of
learners (Algashami et al., 2018), including learning
styles to maximize educational impact (Soepriyanto
et al., 2022; Oliveira et al., 2023; Khaldi et al., 2023).
Further challenges are the potential for negative class-
room dynamics, learner apathy and ethical concerns
(Almeida et al., 2023). It is important to consider eth-
ical implications, including the management of per-
formance pressures and social risks, in order to guar-
antee student welfare and optimize educational out-
comes (Bl
ˇ
st
´
akov
´
a and Piwowar-Sulej, 2019).
2.2 Eye-Movements and Emotions
Emotions are a crucial element in the learning pro-
cess, affecting factors such as motivation, engage-
ment and outcomes that extend beyond the scope of
rational decision-making. It has been proven that pos-
itive emotions facilitate memory, a phenomenon that
can be described as emotional design (Mayer and Es-
trella, 2014; Alemdag and Cagiltay, 2018). The vi-
sual elements of a learning environment, including
layout, color and overall design, have been shown to
influence learners’ emotional responses and engage-
ment (Heidig et al., 2015). For example, studies have
demonstrated that warm colors, rounded shapes, and
human-like avatars with expressive facial features can
evoke positive emotions, which in turn enhance learn-
ing outcomes (Uzun and Yıldırım, 2018; Um et al.,
2012). In contrast, designs that are neutral or purely
decorative can evoke neutral or distracting emotions,
which may reduce motivation (Mikheeva et al., 2021;
Schneider et al., 2016). Additionally, research has
indicated that emotional intensity is associated with
content retention, further emphasizing the importance
of design choices that appeal to learners’ emotions
and attention (Genc¸ Aksaray and Ozcelik, 2023).
To assess such emotional impacts, eye-tracking
represents a method for evaluating the efficacy of
learning platform designs. It analyzes visual atten-
tion through eye movements and offers insights into
emotional responses. Research indicates that design
elements such as color coding can facilitate learn-
ing by enabling users to swiftly identify pivotal ele-
ments, thereby promoting efficient information pro-
cessing (Molina et al., 2024; Ozcelik et al., 2009).
The use of positive features, such as anthropomorphic
illustrations has been demonstrated to attract attention
and focus on relevant content (Peng et al., 2021). In
particular, graphics with instructional value are more
effective than decorative ones, with dynamic visuals
capturing more attention than static ones (Sung and
Mayer, 2012; Alemdag and Cagiltay, 2018).
2.3 Research Gap
The studies discussed highlight the efficacy of gami-
fication in enhancing learning and motivation in tech-
nical subjects. However, there is a research gap in
its application to web development education, which
involves unique challenges like mastering responsive
design. Additionally, an evaluation of existing learn-
ing platforms reveals limitations, such as a lack of
personalized feedback, adaptive learning paths and
task-specific support. This gap underscores the need
for a GLP designed for web development education.
CSEDU 2025 - 17th International Conference on Computer Supported Education
558
3 METHODOLOGY
3.1 Human-Centred Design
Human-centred design (HCD) is a creative approach
to problem-solving that seeks to achieve a balance
between human desirability, technological feasibility
and economic viability. HCD was originally devel-
oped in fields such as computer science, visual de-
sign and architecture. It has since been extended be-
yond user-centred design to encompass a wide array
of products and services. The process is structured
into three principal phases: inspiration, ideation and
implementation (IDEO, 2015; Dam, 2024). The in-
spiration phase is concerned with the development of
empathy through the undertaking of research and the
identification of users’ needs. This is followed by the
definition of the specific problems and requirements,
which ensures a clear understanding of the challenges
to be addressed. In the ideation phase, creative solu-
tions are generated to address the defined needs and
problems, with a particular emphasis on brainstorm-
ing and idea generation to explore a range of poten-
tial approaches. A crucial element of this phase is
the creation of a prototype, which serves as a con-
crete representation of the proposed solutions and fa-
cilitates further development. Finally, the implemen-
tation phase entails evaluating the prototype’s effec-
tiveness through testing, incorporating direct feed-
back from users to refine the solution and ensure it
aligns with their expectations and needs. Through
these phases, HCD provides a systematic framework
for developing innovative and user-centric solutions.
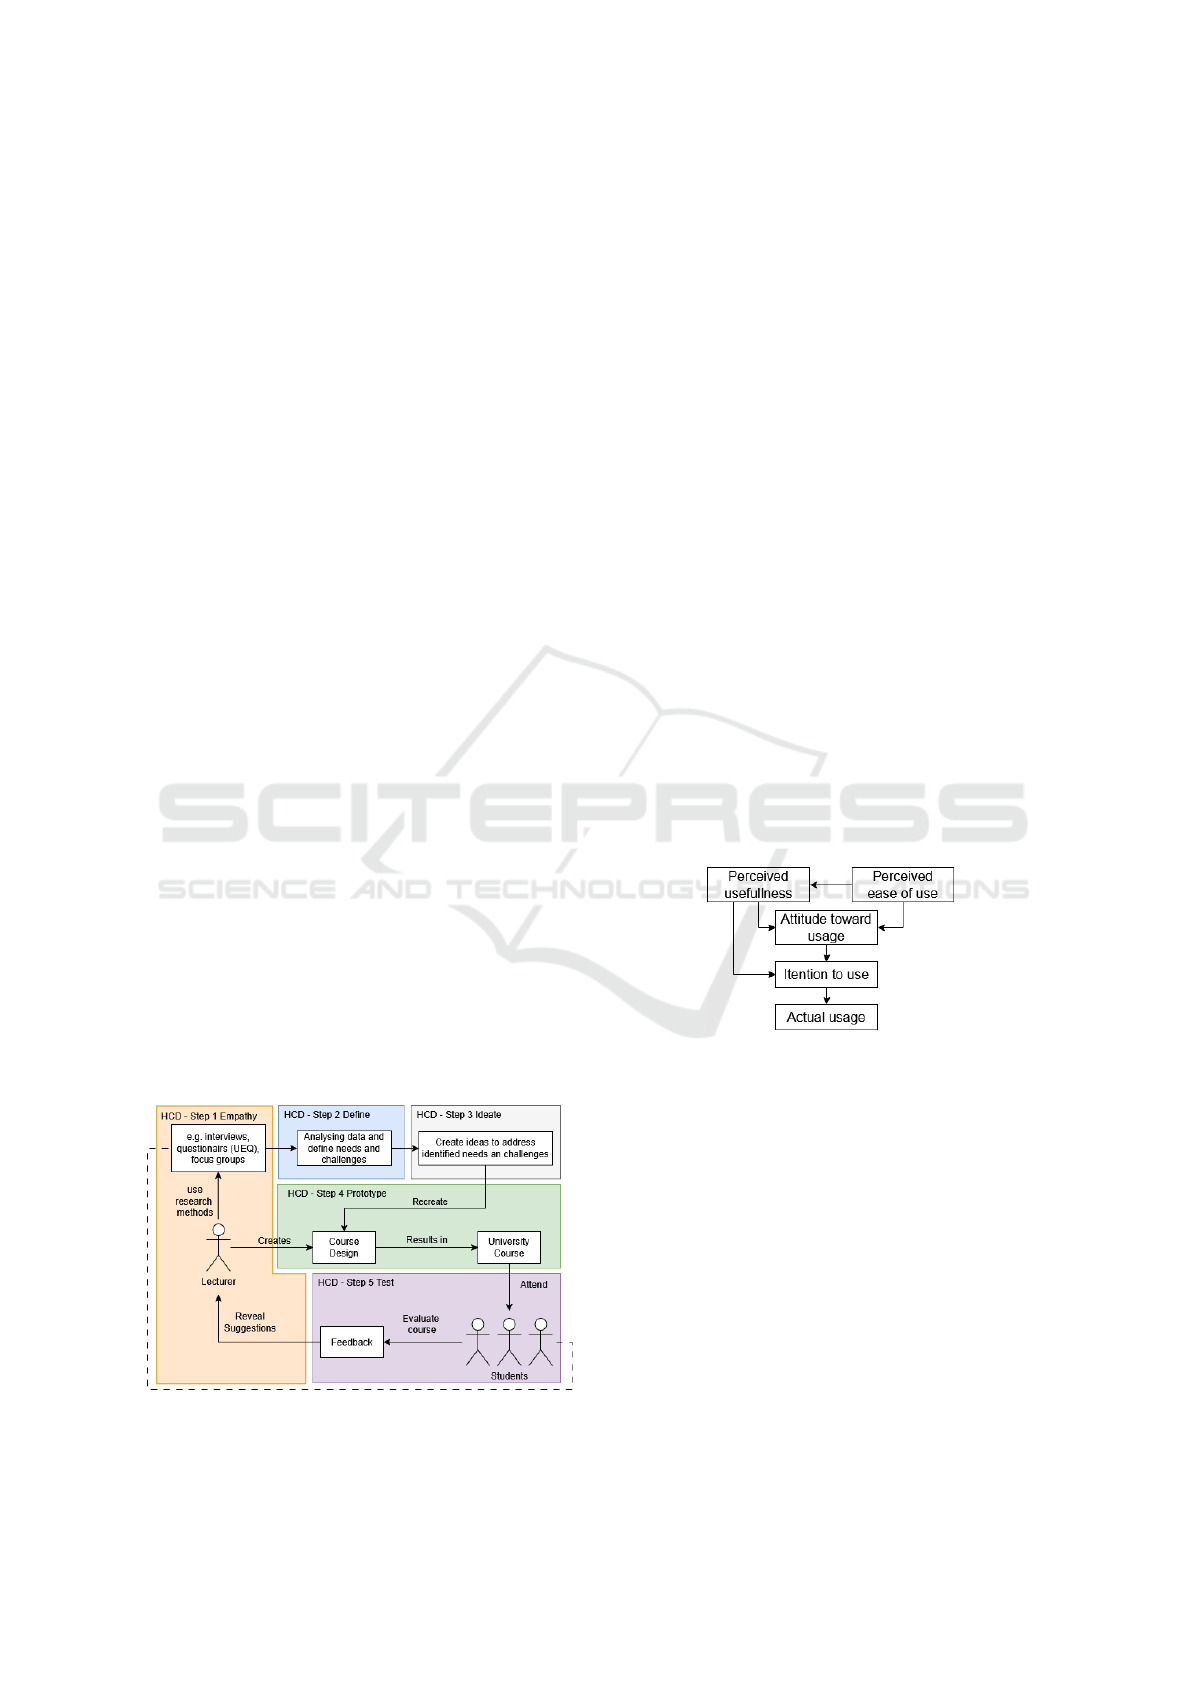
In this research, HCD is applied in a classroom
setting where lecturers design courses, students par-
ticipate and provide feedback. This feedback is used
to continuously improve the courses, see Figure 1.
This iterative process ensures ongoing alignment with
student needs and continuous course improvement.
Figure 1: Visualization of the use of Human-Centred De-
sign (Authors own creation).
3.2 Method Triangulation
This study employs a triangulation of semi-structured
interviews, the Technology Acceptance Model
(TAM), the User Experience Questionnaire (UEQ)
and eye-tracking to provide a comprehensive analy-
sis of user interactions. By integrating these meth-
ods, the research delivers a holistic understanding of
user behavior, motivation and satisfaction, enabling
informed and effective product design and evaluation.
Semi-structured interviews combine standardized
questions with open-ended flexibility, allowing for in-
depth exploration of complex phenomena while main-
taining consistency through the use of an interview
guide (Magaldi and Berler, 2020). The collected data
was analyzed systematically using Kuckartz’s content
analysis approach, supported by the qualitative anal-
ysis tool MAXQDA (Kuckartz and R
¨
adiker, 2024),
ensuring a structured and rigorous interpretation.
The TAM is a robust framework for predicting
user acceptance of technology (Davis et al., 1989) as
shown in Figure 2. It identifies two primary determi-
nants: perceived usefulness (the belief that a system
enhances performance) and perceived ease of use (the
belief that the system is user-friendly). These factors
shape users’ attitudes, intentions and usage behavior.
TAM has been widely applied across domains such as
education, healthcare and business (Maranguni
´
c and
Grani
´
c, 2015; Davis et al., 1989).
Figure 2: Visualization of the Technology Acceptence
Model according to Alomary and Woolard, 2015.
The UEQ evaluates interactive products across
six dimensions: attractiveness, perspicuity, efficiency,
dependability, stimulation and novelty. This stan-
dardized tool captures both pragmatic (task-oriented)
and hedonic (pleasure-oriented) aspects of user expe-
rience, aiding in product comparisons and identifying
areas for improvement (Schrepp, 2015). Widely used
in usability studies, the UEQ provides actionable data
for enhancing user satisfaction and engagement.
For the usability testing eye-tracking is used. This
is a method of measuring participants’ eye move-
ments, including the areas of a website that are viewed
reagrding order and time (Molina et al., 2024). It
offers insights into engaging or confusing parts of a
website (Hy
¨
on
¨
a, 2010).
Enhancing Learning with Gamification: Empowering Students in Web Development Education
559
4 GAMIFIED LEARNING
PLATFORM gAmIcode
This section introduces the GLP gAmIcode, named to
highlight its combination of gamified elements with
coding and its planned integration of AI-driven feed-
back in the future.
4.1 Requirements
A previous study (Sailer, 2024) explored the experi-
ences of ten non-technical students from a web devel-
opment class, identifying ways to enhance the learn-
ing process. A key outcome was the concept of a GLP
designed to address their challenges. The students
provided detailed requirements guiding in developing
a GLP, which aligns with their needs and preferences.
The GLP must be intuitive, user-friendly and re-
sponsive for multi-device-usage, offering personal-
ized learning paths based on prior knowledge and
learning types. It should integrate practical, realis-
tic challenges with interactive elements and immedi-
ate feedback to foster engagement. Core gamification
features, like points, levels, badges, progress indica-
tors and leaderboards, are essential. To reduce stress,
leaderboards should be optional or anonymous. So-
cial tools like forums can promote collaboration and
a sense of community. The platform should provide
regular, constructive feedback, complemented by tu-
torials and videos. Challenges should motivate volun-
tary, creative engagement. An integrated code editor
is essential to avoid reliance on external tools. The
platform must support LMS integration and have a
scalable design to accommodate future growth.
4.2 Structure of gAmIcode
Once the requirements had been defined, the devel-
opment of gAmIcode started. Integrated into the uni-
versity’s LMS via the Learning Tools Interoperability
standard, the platform enables a seamless login expe-
rience as requested during the requirement gathering
phase. Furthermore, it supports the transfer of course
context and facilitates the transmission of grading re-
sults back to the LMS without requiring additional
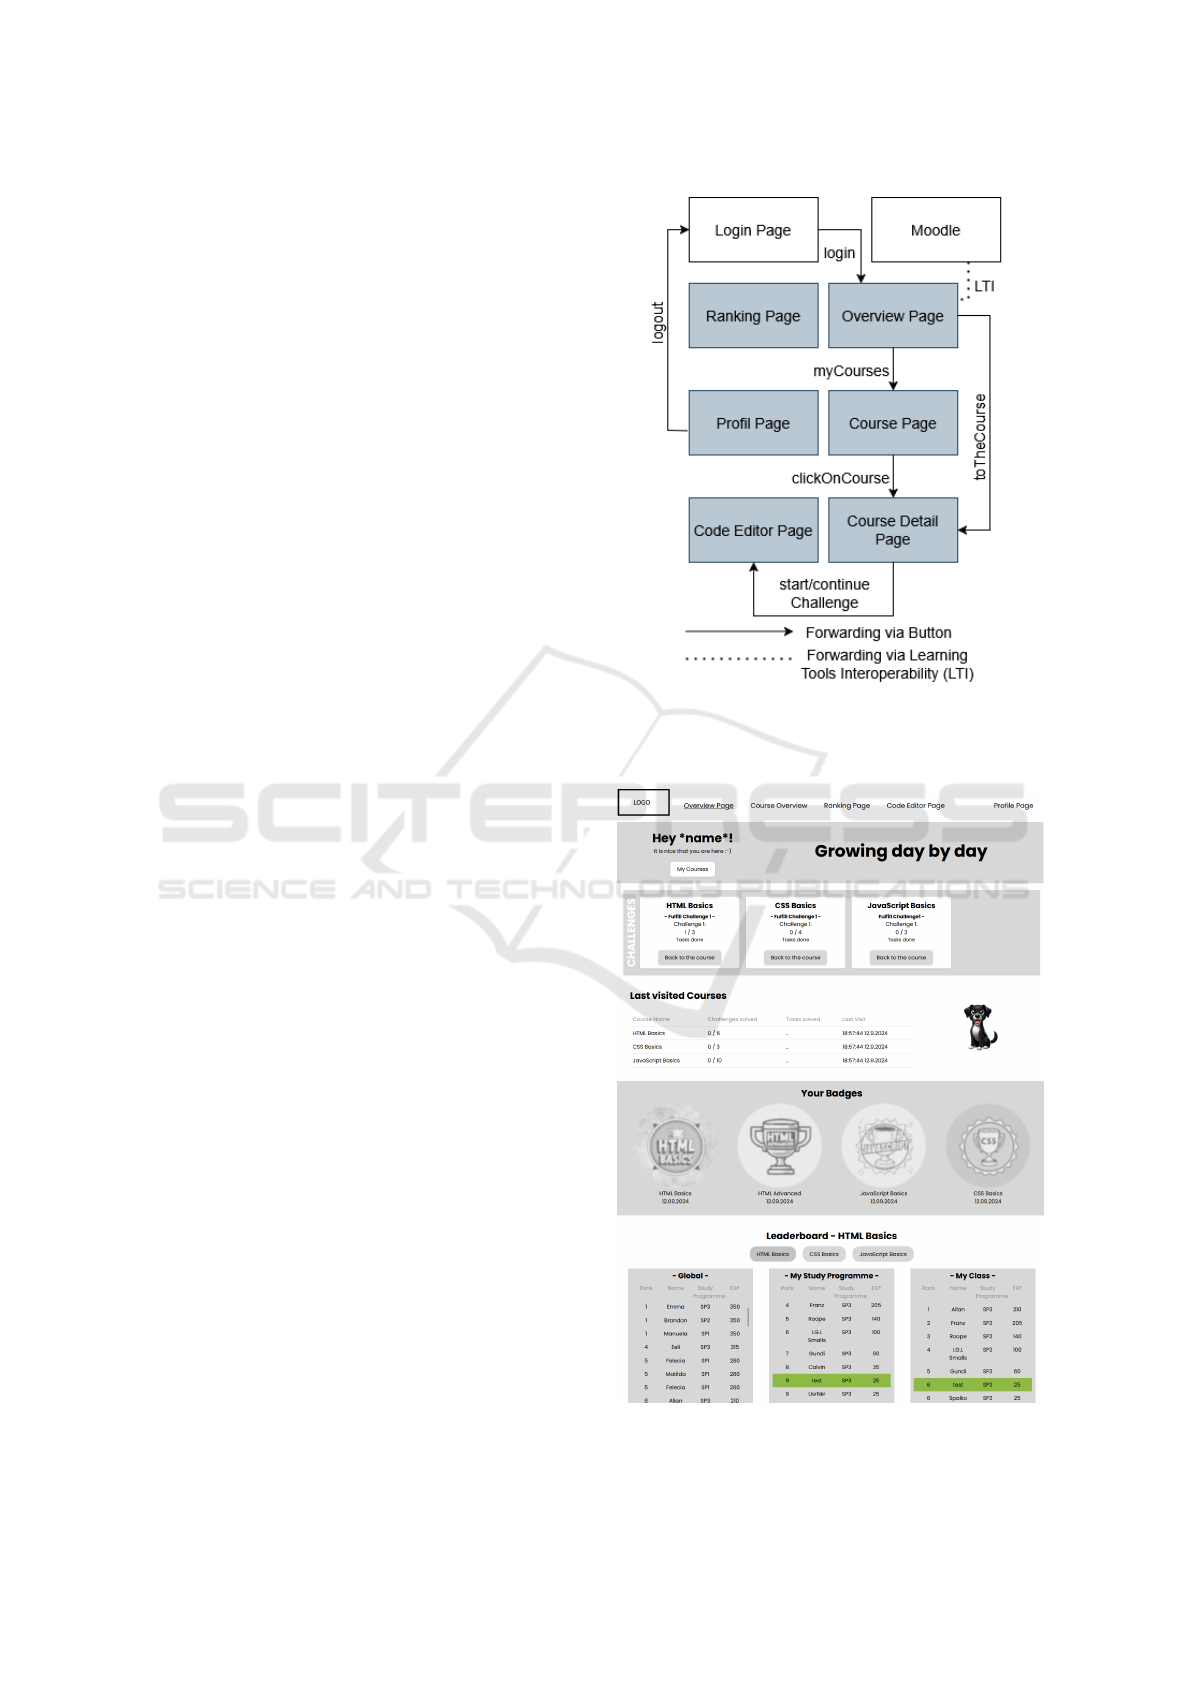
credentials. To facilitate intuitive navigation, the plat-
form features seven subpages, as shown in Figure 3.
Upon logging in, students see an overview page
summarizing recent activity, badges earned and rank-
ings, as shown in Figure 4. The course page lists
available courses with progress indicators, while the
course detail page provides course structure, exercises
and badges. The ranking page, which looks similar
to the leaderboard on the overview page, includes an
Figure 3: Subpages of gAmIcode and their interaction via
buttons. The grey-shaded subpages indicate sections where
navigation is possible from any other grey-shaded page
through the menu (Authors own creation).
Figure 4: gAmIcode - Overview Page.
CSEDU 2025 - 17th International Conference on Computer Supported Education
560
additonal opt-out option for students. The integrated
code editor page enables users to edit project files,
preview web pages and verify solutions, thereby facil-
itating hands-on learning. Feedback is provided im-
mediately after task completion, confirming success
or highlighting issues for revision. The profile page
allows users to personalize settings, including nick-
names for anonymous leaderboard participation.
4.3 Evaluation of gAmIcode
In order to evaluate the user experience of gAmIcode,
a usability test was conducted. This section provides
a detailed description of the procedure.
4.3.1 Setup and Participants
Building on a prior evaluation of 57 students from
non-technical web development classes, ten volun-
teers participated in semi-structured interviews to de-
fine platform requirements. These same students were
later invited to test the platform after its development.
Due to scheduling conflicts only eight participated in
usability testing. Although the sample size was small,
it was sufficient to uncover most usability issues, as
five participants can identify about 85% of problems
(Nielsen and Landauer, 1993). Sessions averaged 45
minutes, including setup, eye-tracking and post-test
interviews, with adjustments made after a pre-test to
refine the methodology.
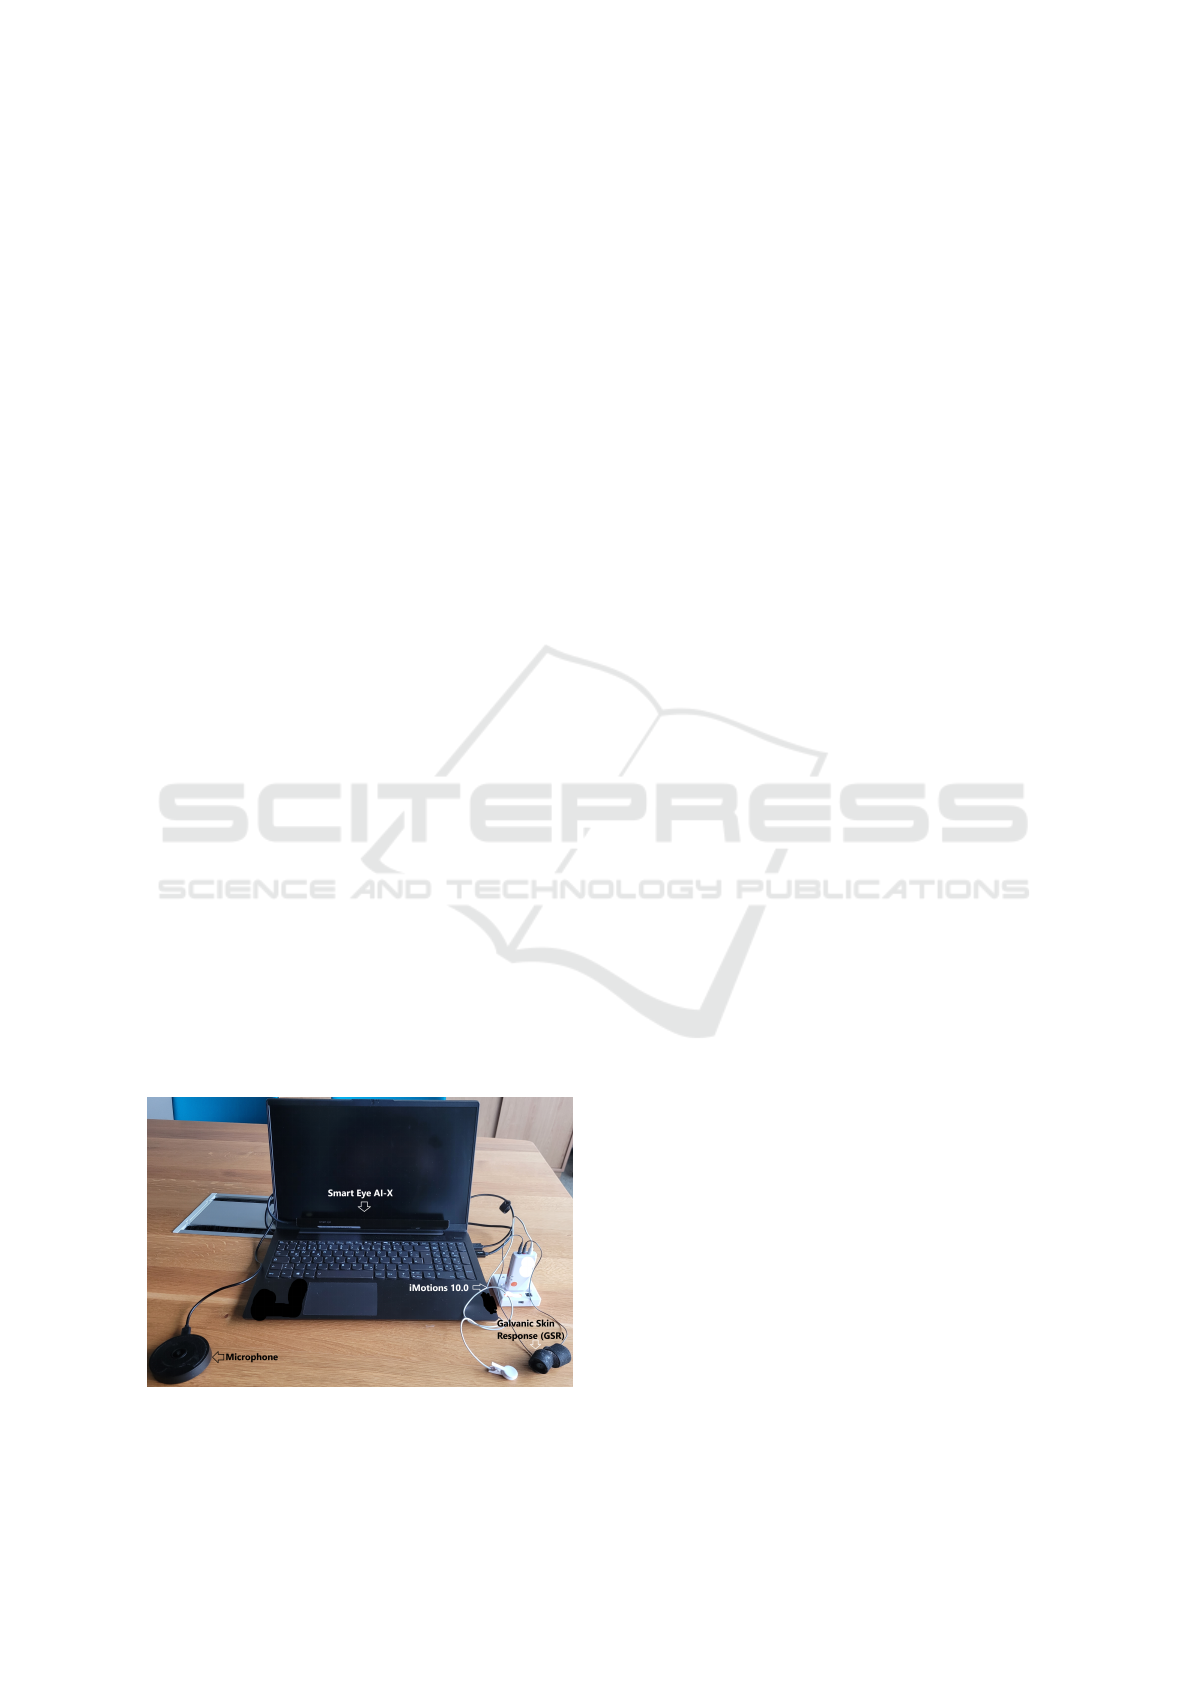
In this study, the Smart Eye AI-X eye tracker (60
Hz) was used, offering greater accuracy compared
to traditional methods such as observation (Alemdag
and Cagiltay, 2018). The UI testing is conducted us-
ing iMotions 10.0, which integrated eye-tracking, fa-
cial expression analysis and galvanic skin response
(GSR), see Figure 5. iMotions heat maps highlighted
visual focus, with red for high, yellow for medium
and green for low attention (Raschke et al., 2014).
Figure 5: Setup Eye-Tracking.
In the interviews, participants shared their impres-
sions of gAmIcode, discussing what they liked, dis-
liked, and found engaging. They identified favorite
features and suggested missing elements to improve
the platform. This feedback provided valuable in-
sights into user preferences, uncover potential pain
points, and identify opportunities for improvement.
By exploring both positive and negative feedback, the
interviews provided a comprehensive understanding
of user needs and expectations, serving as a founda-
tion for refining gAmIcode’s design and functionality.
4.3.2 Conduct Usability Tests
The eight participants of the usability study had to
complete a structured series of tasks designed to eval-
uate the platform’s usability and functionality. These
tasks, outlined in Table 1, included navigating the
platform, updating personal settings, accessing and
interacting with the leaderboard, starting a course and
completing programming exercises. Figures 6 and
7 provide mockups to visually illustrate the task se-
quence, with task instructions displayed on the left
and the platform interface on the right, using color-
coded connections and numbered steps for clarity.
The tasks in Mockup 1 were primarily focused on
fundamental navigation and platform customization,
encompassing the updating of profile information, the
exploration of the leaderboard and the initiation of a
course. In Mockup 2, participants engaged with more
sophisticated tasks, including the resetting of course
progress and the utilization of the integrated code ed-
itor to complete a web development challenge. Feed-
back mechanisms were integrated into the process,
providing immediate responses to users’ actions. The
feedback either confirmed success or offered guid-
ance on the necessary corrections.
The structured task sequence ensured a consistent
evaluation process, while progressive task visibility
encouraged logical navigation and reduced cognitive
load for participants. This approach allowed the study
to gather valuable insights into user interaction and
identify areas for refinement in the platform design.
5 RESULTS
The following sections present the results of the us-
ability test for each page of gAmIcode, highlighting
the usability problems encountered. Furthermore, key
findings were discussed from the analysis of facial ex-
pressions and eye movements, as well as results from
the interviews, TAM and UEQ evaluations.
Enhancing Learning with Gamification: Empowering Students in Web Development Education
561
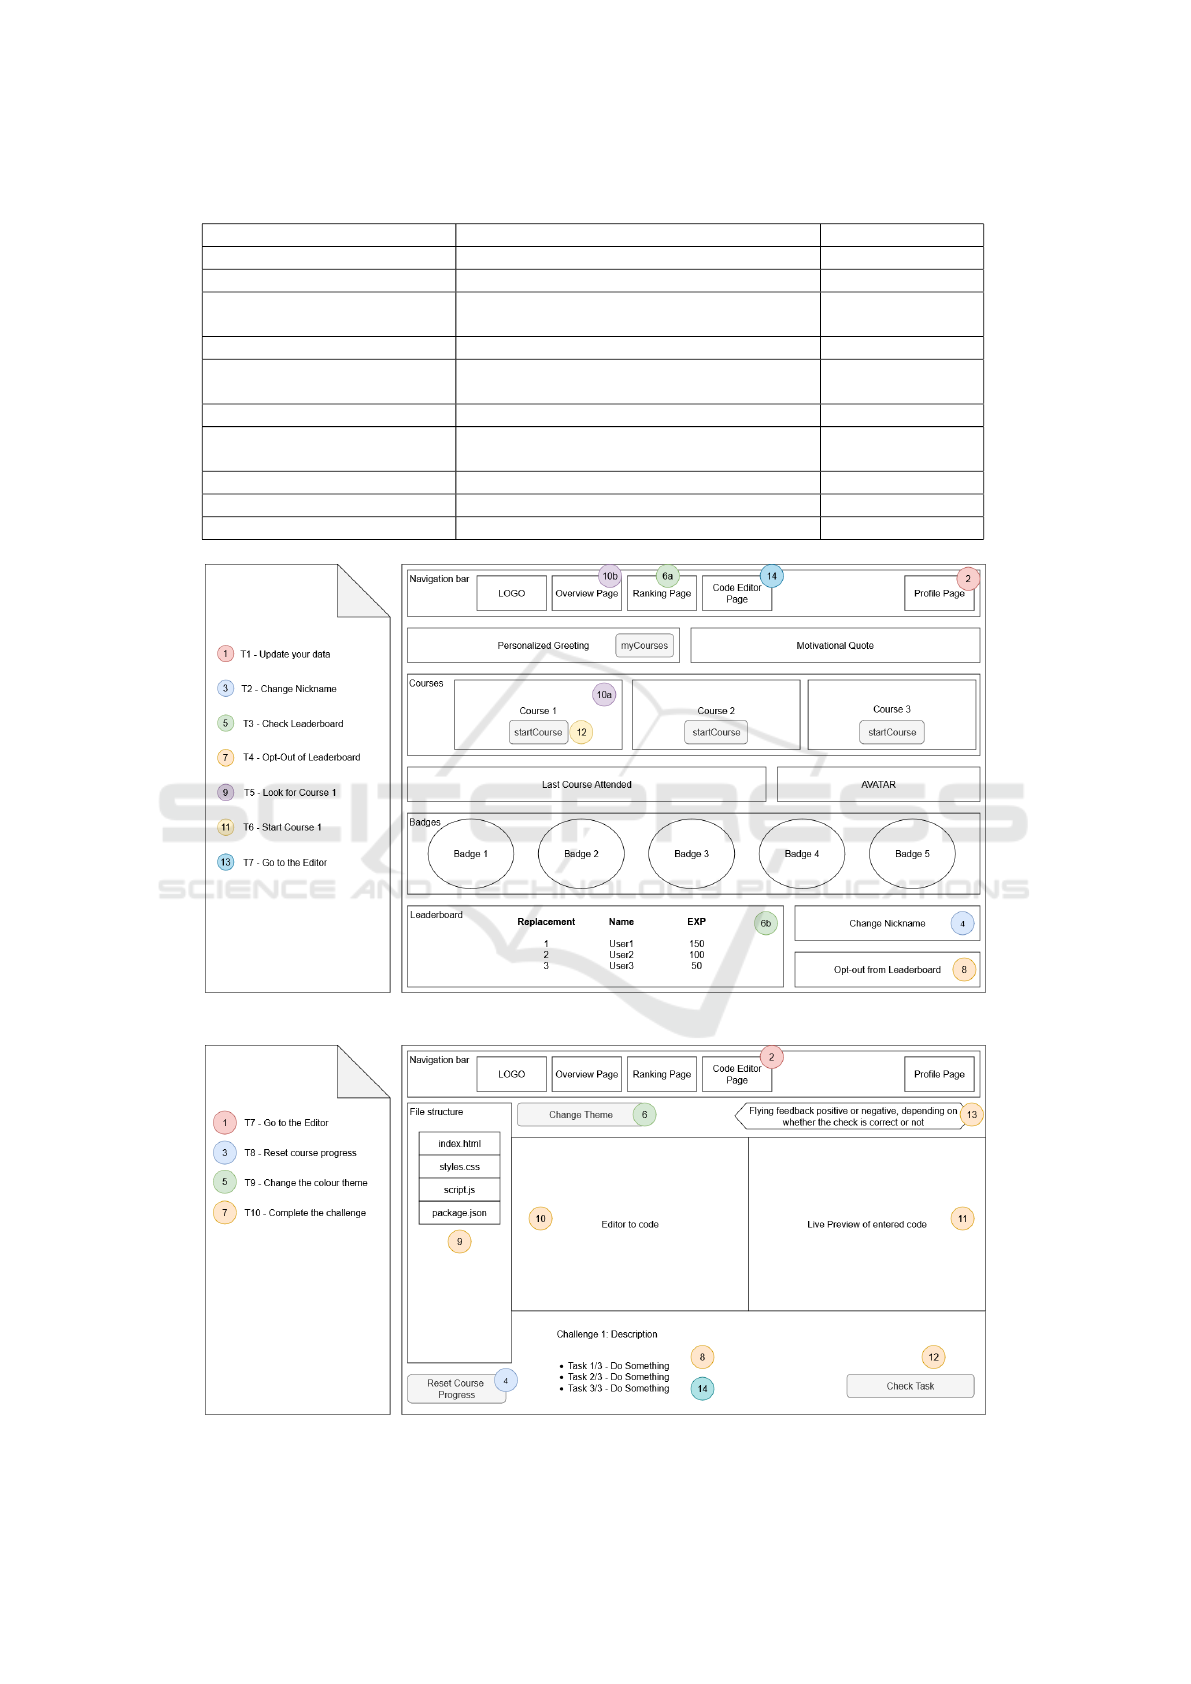
Table 1: Listing of the tasks carried out during usability testing to explore the platform including expected results.
Task Expected Solution Figure and color
T1 - Update your data Go to the profile page Figure 5, red
T2 - Change the nickname Change the name Figure 5, blue
T3 - Check the Leaderboard
a) Go to the ranking page
b) Scroll at the end of the overview page
Figure 5, green
T4 - Opt-out of Leaderboard Click the ”opt-out” button Figure 5, orange
T5 - Look for Course 1
a) Go to the course overview page
b) Scroll to the courses on the overview page
Figure 5, purple
T6 - Start Course 1 Click on the ”start course” button Figure 5, yellow
T7 - Got to the Editor Go to the editor page
Figure 5, darkblue
Figure 6, red
T8 - Reset the course progress Click on the ”reset course progress” button Figure 6, blue
T9 - Change the color theme Select another theme in the drop down menu Figure 6, green
T10 - Complete the challenge Follow the instruction Figure 7, orange
Figure 6: Mockup of the Overview Page (Authors own creation).
Figure 7: Mockup of the Code Editor Page (Authors own creation).
CSEDU 2025 - 17th International Conference on Computer Supported Education
562
5.1 Usability Test with Eye-Tracking
The results of the usability test indicated that the ma-
jority of participants were able to successfully com-
plete the assigned tasks. The recorded facial expres-
sions, detailed in Table 2, revealed a range of emo-
tional responses. The overview page elicited the high-
est levels of fear and confusion, likely due to par-
ticipants’ unfamiliarity during the initial orientation
phase, with an average of 8.2 emotional peaks per
minute. The ranking page also triggered notable neg-
ative emotions, including 5.7% anger and 9.3% con-
fusion. In contrast, the profile page generated the
most positive responses, with 22.3% joy and less than
1% negative reactions, like fear, digust or sadness. It
should be noted that the information displayed in the
heat maps is fictitious.
Table 2: Overview of Facial Expressions that were triggered
per sub page in %.
Subpage Fear Confusion Digust Sadness
Overview 1.4 15.2 4.7 5.1
Profile 0.5 4.0 1.1 1.3
Ranking 1.0 9.3 0.6 3.3
Course 1.3 6.8 1.5 3.1
Editor 2.5 6.2 2.3 3.0
Subpage Joy Contempt Anger Surprise
Overview 19.5 0.9 3.5 1.9
Profile 22.3 1.1 1.5 0.7
Ranking 16.0 2.9 5.7 0.6
Course 15.7 2.6 2.5 1.4
Editor 18.5 1.6 3.0 2.3
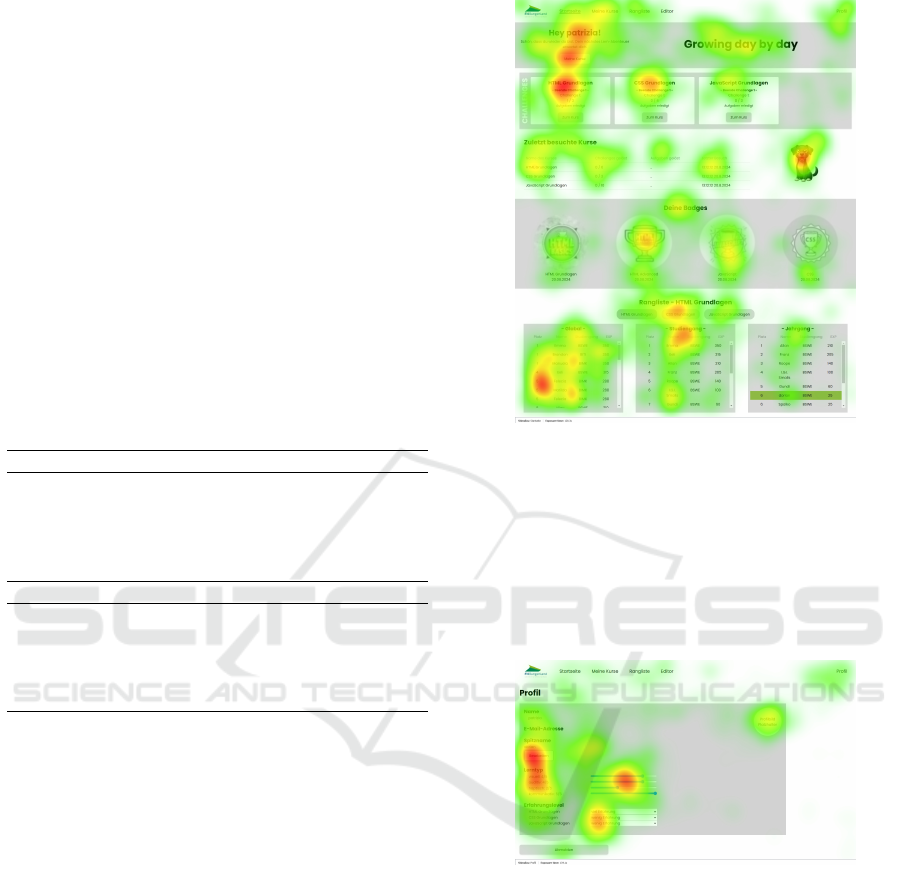
5.1.1 Overview Page of the Learning Platform
The initial task entailed a one-minute review of the
website, which was followed by a discussion in which
participants shared their opinions on the overview
page. The feedback was overwhelmingly positive, as
evidenced by the heatmap in Figure 8, which demon-
strates that all elements were viewed. Participants de-
scribed the page as clear, compact and tidy. While
some suggested incorporating additional colours, the
muted colour scheme was a deliberate design choice.
The hover effect on badges, which changed from grey
to colour and the avatar dog received particular praise.
Only one participant found the page confusing due to
the visibility of multiple courses.
5.1.2 Changing the Profile and Learning Type
After reviewing the overview page, participants were
tasked with updating their profile. Most participants
completed this task efficiently and praised the design
of the page. As shown in Figure 9, all elements were
viewed by the participants. Suggestions included au-
Figure 8: Heat Map of the overview page (n = 8). Red areas
are viewed the most, followed by yellow and green areas.
tomatically populating the current level of knowledge
using a test, adding a field to indicate how frequently
participants use programming languages, expanding
the categories for prior knowledge beyond three levels
and incorporating a help button to clarify these levels.
Additionally, participants recommended a drag-and-
drop feature for uploading photos.
Figure 9: Heat map of Profile settings (n=8). Red areas are
viewed the most, followed by yellow and green areas.
5.1.3 Ranking Page
Participants were asked to identify their name on the
ranking list and indicate their preference to opt out,
as shown in Figure 10. Most found the task easy,
though opinions on the ranking feature were divided.
While some appreciated it, others preferred avoiding
comparisons. The use of nicknames helped to reduce
concerns about privacy, but terms like ’Global Rank-
ing’ needed clarification. The color-coded rankings
were well received, and the opt-out process was ef-
ficient, though participants suggested adding a con-
firmation notification and improving button visibil-
ity. Additional recommendations included detailed
Enhancing Learning with Gamification: Empowering Students in Web Development Education
563
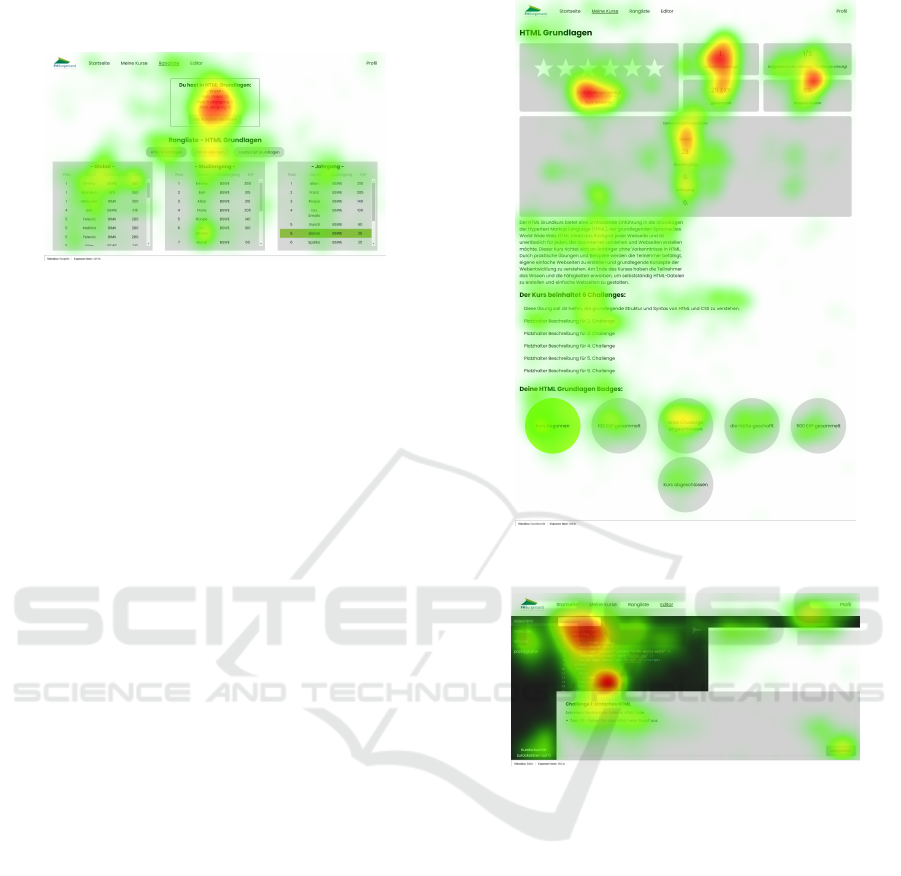
progress metrics and enhancing the feedback message
box, which resembled error alerts.
Figure 10: Heat Map of the Ranking Page (n=8). Red areas
are viewed the most, followed by yellow and green areas.
5.1.4 Course Page and Learning Progress
Upon completion of the HTML course exercises, par-
ticipants were invited to review their progress on the
course page. As illustrated in Figure 11, the dash-
board and badges attracted more visual attention than
the text. The feedback indicated a preference for pre-
senting the course description before the progress de-
tails, with the aim of improving the flow of infor-
mation. Participants also recommended distinguish-
ing headings from text with varying sizes, replac-
ing the confusing star progress indicators with a fill-
ing progress circle and making the page more com-
pact in order to minimize scrolling. Suggestions in-
cluded clarifying the meaning of the EXP abbrevia-
tion, which means experience points, and displaying
the average time required to complete a course in or-
der to facilitate better planning. The design was posi-
tively received, particularly the badges and the use of
green for completed tasks.
5.1.5 Code Editor Page
The code editor, a central component of the platform,
offers instantaneous feedback on web development
tasks, as illustrated in Figure 12, which underscores
its high visual engagement. Participants responded
positively to the code editor, but also offered sug-
gestions for improvements. These included display-
ing the number of permitted attempts for incorrect
tasks, enlarging error messages with more detailed
explanations and providing guidance on errors that
is more accessible to beginners. They also recom-
mended adding a red exclamation mark for error lines,
renaming the Reset Editor button to Repeat Task with
enhanced visibility and improving the accessibility of
the colour scheme button.
Figure 11: Heat Map of the Course Page (n=8). Red areas
are viewed the most, followed by yellow and green areas.
Figure 12: Heat Map of the Code Editor (n=8). Red areas
are viewed the most, followed by yellow and green areas.
5.2 Method Triangulation
The platform evaluation used semi-structured inter-
views, TAM and UEQ to analyze its strengths and
areas for improvement.
The semi-structured interviews gathered user
feedback on design, usability, functionality and over-
all impressions. Users praised the platform’s clar-
ity and intuitive layout but criticized the muted color
scheme as uninspiring. Suggestions included vibrant,
institution-aligned colors, customizable avatars and a
dynamic color scheme that adapts to user progress.
Badges and the integrated editor were praised for fos-
tering accomplishment, but users suggested clearer
feedback, such as progress bars over stars, plus so-
cial features and better navigation, like a ”jump back”
button. Overall, the platform was described as struc-
tured, transparent, intuitive and functional, though
CSEDU 2025 - 17th International Conference on Computer Supported Education
564

Table 3: Results Technology Acceptance Model Mean and Variance (Var.).
Q1 Q2 Q3 Q4 Q5 Q6 Q7 Q8 Q9 Q10 Q11 Q12
Mean 2.375 2.500 2.625 2.750 1.000 1.000 1.125 1.000 1.750 1.000 1.250 1.125
Var. 0.839 0.857 1.411 1.929 0 0 0.125 1.071 0 0.214 0.125 0.214
Q13 Q14 Q15 Q16 Q17 Q18 Q19 Q20 Q21 Q22 Q23
Mean 1.250 1.250 1.625 1.500 1.625 2.000 3.000 3.250 1.875 2.375 3.000
Var. 0.214 0.214 0.554 0.571 0.554 1.143 1.714 1.357 0.982 1.125 0.857
with room for enhancements.
The TAM analysis, summarized in Table 3, used
a scale of 1 (best) to 5 (worst) to evaluate platform-
specific and general usage. Visual appeal and mean-
ingful use of color (Q1–Q4) received moderate scores
(mean: 2.375–2.5). Navigation and readability
(Q5–Q8) were rated highly, with mean scores rang-
ing from 1.0 to 1.125, indicating unanimous approval.
Users found the platform easy to use (Q10), self-
explanatory (Q11), and generally well-liked (Q12,
Q14), with mean ratings between 1.0 and 1.25, re-
flecting high satisfaction and a strong likelihood of
continued use and recommendations (Q13). Techni-
cal engagement (Q15–Q18) showed moderate scores
(mean: 1.625–2.0), with notable variability, while
practical usage (Q19–Q20) received higher ratings
(mean: 3.0–3.25). General willingness to adopt new
systems (Q21–Q23) displayed variability, with mean
scores ranging from 1.875 to 3.0, reflecting mixed
perspectives among users.
The UEQ results, shown in Table 4, assessed
six UX dimensions on the same 1 to 5 scale. Per-
spicuity (mean: 2.250) and efficiency (mean: 2.219)
were the highest-rated dimensions, indicating clar-
ity and practicality in task completion. Attractive-
ness (mean: 1.563) and dependability (mean: 1.875)
received moderate ratings, with dependability show-
ing the highest variance (1.05), highlighting divided
opinions on reliability. Stimulation (mean: 1.563)
and novelty (mean: 1.250) scored lowest, suggest-
ing limited user engagement and innovation. Vari-
ance data pointed to enhancing reliability, visual ap-
peal and stimulation to create a more engaging UX.
Table 4: Results UEQ Mean and Variance.
UEQ Scales Mean Variance
Attractiveness 1.563 0.33
Perspicuity 2.250 0.79
Efficiency 2.219 0.40
Dependability 1.875 1.05
Stimulation 1.563 0.71
Novelty 1.250 1.41
6 DISCUSSION
6.1 gAmIcode
The evaluation of gAmIcode offered valuable insights
into its alignment with user requirements, usability
and the influence of design elements on user engage-
ment. The platform’s features were evaluated using a
combination of eye-tracking (ET) data, interview (I)
feedback and supplementary evaluations based on the
TAM and the UEQ. Each requirement was classified
as either implemented, partially implemented, inade-
quately implemented, or missing, as summarized in
Table 5. While the platform received positive feed-
back with regard to its intuitive interface, motivational
gamification features and immediate feedback mecha-
nisms, there were also a number of areas identified for
improvement, including the absence of learning paths,
social interaction tools and multi-device usability.
The findings confirm that the implementation of
gamification elements, such as badges, progress indi-
cators and leaderboards has a positive impact on mo-
tivation and a sense of accomplishment. However,
as evidenced by research on gamification strategies
(Almeida et al., 2023), the ambivalent response to the
leaderboard feature underscores the necessity for per-
sonalization to accommodate diverse learner prefer-
ences. Although some participants reported that the
leaderboard was motivational, others perceived it as
a conduit for negative competition. This underscores
the necessity of providing anonymity options, which
were effectively implemented in gAmIcode.
The integrated code editor was well-received for
its functionality, providing immediate feedback that
aligns with prior research regarding real-time feed-
back in maintaining engagement and reducing frustra-
tion (Giang, 2013; Kiryakova et al., 2014). However,
user feedback indicated the need for more detailed
error messages, task-specific guidance and enhance-
ments to visual progress indicators. This suggests
that augmenting these features could further align the
platform with recommendations for personalized and
adaptive learning tools (Oliveira et al., 2023).
The visual design was another critical element
subject to evaluation. The muted grey colour scheme,
Enhancing Learning with Gamification: Empowering Students in Web Development Education
565

Table 5: Overview of Requirements and Implementation
Ratings Based on Eye-Tracking (ET) Data and Interview
(I) Feedback.
Requirement Method Implemention
Learning Paths I Missing
Immediate Feedback ET/I Inadequate
Realistic challenges I Missing
Social Interaction I Missing
Integrated Code-Editor ET/I Implemented
Learning Types I Partial
Integration LMS I Partial
Scalability, Flexibility I Implemented
Visual code Feedback ET/I Implemented
Task-related Feedback ET/I Implemented
Badges as reward ET/I Implemented
Leaderboard ET/I Implemented
Progress indicators ET/I Inadequate
Tutorials, videos I Missing
Nicknames ET/I Implemented
Avoid external tools ET/I Implemented
Responsive Design ET/I Missing
Multi-device usage I Missing
Levels/stages I Missing
Attractive design I Inadequate
Colour Scheme I Inadequate
Intuitive UI ET/I Implemented
selected to reflect a sense of professionalism, was
critiqued for its lack of vibrancy. This observa-
tion aligns with prior research indicating that colours
can significantly influence user emotions and engage-
ment(Ozcelik et al., 2009; Uzun and Yıldırım, 2018).
Participants indicated a preference for institution-
aligned colours and a dynamic colour scheme, which
aligns with prior studies on emotional design and the
balance between aesthetics and functionality (Molina
et al., 2024; Um et al., 2012). Decorative elements,
such as the dog avatar, attracted positive attention
without detracting from usability, contrary to earlier
studies that suggested visual embellishments can im-
pair functionality (Mikheeva et al., 2021).
The absence of adaptive gamification strategies,
such as personalized learning paths, was identified as
a limitation. Participants underscored the importance
of such features for personalization, aligning with re-
search indicating that adaptive gamification enhances
engagement and learning outcomes (Oliveira et al.,
2023; Khaldi et al., 2023). Additionally, recommen-
dations for social interaction tools (L
´
opez-Fern
´
andez
et al., 2023), such as forums or chats, reinforce the
importance of collaborative learning environments in
fostering engagement and peer support.
In conclusion, the results confirm the positive im-
pact of gamified elements on perceived usability, use-
fulness and user experience, thereby directly address-
ing the research. The findings are in accordance
with existing literature on the essential function of
feedback mechanisms, adaptive design and engaging
visuals in learning platforms (Dambic et al., 2021;
Soepriyanto et al., 2022). By eliminating the iden-
tified limitations, the platform will be better aligned
with user expectations. With these refinements, the
platform will be prepared for comprehensive class-
room testing to validate its potential to enhance learn-
ing outcomes and engagement.
6.2 Future Work
In advance of the platform’s launch a number of en-
hancements are considered. These include adapt-
ing feedback messages to provide hints after multiple
failed attempts, resizing badges, clarifying abbrevia-
tions and replacing progress stars with progress bars.
Feedback mechanisms will be improved with leader-
board opt-outs and nickname changes. Additionally,
chat features will be introduced to promote a collabo-
rative supportive learning community.
The Goal-Access-Feedback-Challenge-
Collaboration model (Huang and Hew, 2018)
will guide gamification. Immediate feedback will
come from mini-assignments with automated testing,
while open-ended tasks will foster creativity and
intrinsic motivation (Sharmin, 2022). As traditional
auto-grading falls short, innovative grading solutions
(Messer et al., 2023) will be developed. Large
Language Models will be explored for real-time
feedback on complex tasks (Hou et al., 2024), and
peer assessment will support collaboration and
motivation (Di Mascio et al., 2021).
To align with advancements in adaptive learning
and automated formative feedback, the platform will
integrate chatbots capable of providing detailed, real-
time responses, thereby enhancing personalization
and engagement (Elhayany et al., 2024). These fea-
tures will adhere to ethical AI guidelines (du Boulay,
2022) to ensure equitable and transparent practices.
These improvements aim to create an engaging, effec-
tive learning experience for non-technical students.
7 CONCLUSION
Students of non-technical programmes frequently
encounter considerable difficulties when confronted
with technical classes, such as web development.
These difficulties frequently result in frustration, dis-
engagement and poor course evaluations, underscor-
ing the necessity for solutions that better align with
CSEDU 2025 - 17th International Conference on Computer Supported Education
566

the specific needs of these learners. Insights gathered
through interviews revealed that students encounter
difficulties with traditional approaches to technical
education and expressed a desire for more engaging,
user-friendly tools. This feedback directly informed
the development of the GLP gAmIcode, which was
designed to incorporate functionalities and gamifica-
tion elements tailored to student preferences.
The HCD (Human-Centered Design) approach
was a key element in the development of gAmIcode,
with student input being given consideration in the
shaping of its design and features. The prototype
was subjected to a comprehensive evaluation process,
which included eye-tracking studies, TAM and UEQ
assessments, and follow-up interviews. The feedback
indicated that the intuitive interface and ease of use
were well-received, with eye-tracking data confirm-
ing effective task completion and emotional analysis
revealing a generally positive user experience.
However, areas for improvement were identi-
fied, including a preference for a more vibrant color
scheme, more effective feedback mechanisms, and an
FAQ section for common queries. Once these en-
hancements have been integrated, the prototype will
be tested further in classroom settings. This phase
will involve at least 25 students per class across three
classes, addressing a key limitation of the initial us-
ability testing, which included only eight participants.
ACKNOWLEDGEMENTS
The authors would like to thank the University of Ap-
plied Sciences Burgenland, the University of Vienna
and the UniVie Doctoral School Computer Science
(DoCS) for their support in developing and evalu-
ating the gAmIcode platform. Special thanks go to
DeepL and DeeplWrite for their support with the par-
tial translation and proofreading in terms of spelling
and grammar as well as ChatGPT as a reliable spar-
ring partner during the creation process.
REFERENCES
Alc
´
antara-Rubio, L., Valderrama-Hern
´
andez, R., Sol
´
ıs-
Espallargas, C., and Ruiz-Morales, J. (2022). The
implementation of the sdgs in universities: a sys-
tematic review. Environmental Education Research,
28(11):1585–1615.
Alemdag, E. and Cagiltay, K. (2018). A systematic review
of eye tracking research on multimedia learning. Com-
puters & Education, 125:413–428.
Algashami, A., Cham, S., Vuillier, L., Stefanidis, A., Phalp,
K., and Ali, R. (2018). Conceptualising gamification
risks to teamwork within enterprise. In The Practice
of Enterprise Modeling: 11th IFIP WG 8.1. Working
Conference, PoEM 2018, October 31–November 2,
2018, Proceedings 11, pages 105–120, Vienna, Aus-
tria. Springer International Publishing.
Almeida, C., Kalinowski, M., Uch
ˆ
oa, A., and Feij
´
o, B.
(2023). Negative effects of gamification in educa-
tion software: Systematic mapping and practitioner
perceptions. Information and Software Technology,
156:107142.
Bl
ˇ
st
´
akov
´
a, J. and Piwowar-Sulej, K. (2019). Gamification
as an innovative idea within human resources man-
agement. International Scientific Conference Hradec
Economic Days 2019.
Dam, R. F. (2024). The 5 stages in the design thinking pro-
cess. https://www.interaction-design.org/literature/
article/5-stages-in-the-design-thinking-process [Ac-
cessed: 06.08.2024].
Dambic, G., Kesscec, T., and Kucak, D. (2021). A
Blended Learning with Gamification Approach for
Teaching Programming Courses in Higher Educa-
tion. In 2021 44th International Convention on In-
formation, Communication and Electronic Technol-
ogy (MIPRO), pages 843–847, Opatija, Croatia. IEEE.
Davis, F. D., Bagozzi, R., and Warshaw, P. (1989). Technol-
ogy acceptance model. J Manag Sci, 35(8):982–1003.
Di Mascio, T., Peretti, S., and Temperini, M. (2021). The
role of intrinsic motivation in peer assessment activity:
an empirical evaluation. In 2021 19th International
Conference on Information Technology Based Higher
Education and Training (ITHET), pages 1–7. IEEE.
du Boulay, B. (2022). Artificial intelligence in education
and ethics. In Handbook of open, distance and digital
education, pages 1–16. Springer.
Elhayany, M., Steinbeck, H., and Meinel, C. (2024). Adap-
tive learning at scale: Investigating the effects of auto-
mated formative feedback in mooc-based data science
learning. In 2024 IEEE 3rd German Education Con-
ference (GECon), pages 1–6.
Genc¸ Aksaray, S. and Ozcelik, E. (2023). Attention medi-
ates the effect of emotional arousal on learning out-
comes in multimedia learning: an eye-tracking study.
Educational Psychology, 43(1):38–56.
Giang, V. (2013). Gamification. Techniques Increase Your
Employees’ Ability to Learn by, 40.
Heidig, S., M
¨
uller, J., and Reichelt, M. (2015). Emotional
design in multimedia learning: Differentiation on rel-
evant design features and their effects on emotions and
learning. Computers in Human behavior, 44:81–95.
Hou, X., Zhao, Y., Liu, Y., Yang, Z., Wang, K., Li, L., Luo,
X., Lo, D., Grundy, J., and Wang, H. (2024). Large
Language Models for Software Engineering: A Sys-
tematic Literature Review.
Huang, B. and Hew, K. F. (2018). Implementing a theory-
driven gamification model in higher education flipped
courses: Effects on out-of-class activity completion
and quality of artifacts. Computers & Education,
125:254–272.
Hy
¨
on
¨
a, J. (2010). The use of eye movements in the study
of multimedia learning. Learning and Instruction,
20(2):172–176.
Enhancing Learning with Gamification: Empowering Students in Web Development Education
567

IDEO (2015). The Field Guide to Human-centered Design:
Design Kit. IDEO.
Iosup, A. and Epema, D. (2014). An experience report on
using gamification in technical higher education. In
Proceedings of the 45th ACM technical symposium on
Computer science education, pages 27–32.
Khaldi, A., Bouzidi, R., and Nader, F. (2023). Gamification
of e-learning in higher education: a systematic litera-
ture review. Smart Learning Environments, 10(1):10.
Kiryakova, G., Angelova, N., and Yordanova, L. (2014).
Gamification in education. In Proceedings of 9th in-
ternational Balkan education and science conference,
volume 1, pages 679–684.
Kuckartz, U. and R
¨
adiker, S. (2024). Fokussierte Interview-
analyse mit MAXQDA: Schritt f
¨
ur Schritt. Springer.
L
´
opez-Fern
´
andez, D., Gordillo, A., Tovar, E., and Alarc
´
on,
P. P. (2023). Gamification in computer science educa-
tion: An empirical study of a meme contest. In 2023
IEEE Frontiers in Education Conference (FIE), pages
1–6.
Magaldi, D. and Berler, M. (2020). Semi-structured inter-
views. Encyclopedia of personality and individual dif-
ferences, pages 4825–4830.
Maranguni
´
c, N. and Grani
´
c, A. (2015). Technology accep-
tance model: a literature review from 1986 to 2013.
Universal access in the information society, 14:81–
95.
Mayer, R. E. and Estrella, G. (2014). Benefits of emotional
design in multimedia instruction. Learning and In-
struction, 33:12–18.
Messer, M., Brown, N. C. C., K
¨
olling, M., and Shi, M.
(2023). Automated Grading and Feedback Tools
for Programming Education: A Systematic Review.
ACM Transactions on Computing Education, page
3636515.
Mikheeva, M., Schneider, S., Beege, M., and Rey, G. D.
(2021). The influence of affective decorative pictures
on learning statistics online. Human Behavior and
Emerging Technologies, 3(3):401–412.
Molina, A. I., Arroyo, Y., Lacave, C., Redondo, M. A.,
Bravo, C., and Ortega, M. (2024). Eye tracking-
based evaluation of accessible and usable interactive
systems: tool set of guidelines and methodological
issues. Universal Access in the Information Society,
pages 1–24.
Nielsen, J. and Landauer, T. K. (1993). A mathematical
model of the finding of usability problems. In Pro-
ceedings of the INTERACT’93 and CHI’93 conference
on Human factors in computing systems, pages 206–
213.
Nurutdinova, A., Shakirova, D., Fazlyeva, Z., Dmitrieva,
E., Sheinina, D., and Galeeva, G. (2021). Gamifica-
tion Method to Improve Speech Skills and Proficiency
Among Students: Methodology for Implementation.
In 2021 World Engineering Education Forum/Global
Engineering Deans Council (WEEF/GEDC), pages
461–467, Madrid, Spain. IEEE.
O’Donovan, S., Gain, J., and Marais, P. (2013). A case
study in the gamification of a university-level games
development course. In Proceedings of the South
African Institute for Computer Scientists and Informa-
tion Technologists Conference, pages 242–251, East
London South Africa. ACM.
Oliveira, W., Hamari, J., Shi, L., Toda, A. M., Rodrigues,
L., Palomino, P. T., and Isotani, S. (2023). Tailored
gamification in education: A literature review and fu-
ture agenda. Education and Information Technologies,
28(1):373–406.
Ozcelik, E., Karakus, T., Kursun, E., and Cagiltay, K.
(2009). An eye-tracking study of how color coding
affects multimedia learning. Computers & Education,
53(2):445–453.
Pa
ˇ
lov
´
a, D. and Veja
ˇ
cka, M. (2022). Implementation of
Gamification Principles into Higher Education. Eu-
ropean Journal of Educational Research, 11(2):763–
779.
Peng, X., Xu, Q., Chen, Y., Zhou, C., Ge, Y., and Li, N.
(2021). An eye tracking study: positive emotional in-
terface design facilitates learning outcomes in multi-
media learning? International journal of educational
technology in higher education, 18:1–18.
Poondej, C. and Lerdpornkulrat, T. (2019). Gamification
in e-learning: A Moodle implementation and its effect
on student engagement and performance. Interactive
Technology and Smart Education, 17(1):56–66.
Raschke, M., Blascheck, T., and Burch, M. (2014). Visual
analysis of eye tracking data. Handbook of human
centric visualization, pages 391–409.
Sailer, P. (2024). Learning web technologies: Overcom-
ing educational challenges. In EdMedia+ Innovate
Learning, pages 466–475, Brussels, Belgium. Associ-
ation for the Advancement of Computing in Education
(AACE).
Schneider, S., Nebel, S., and Rey, G. D. (2016). Decorative
pictures and emotional design in multimedia learning.
Learning and Instruction, 44:65–73.
Schrepp, M. (2015). User experience questionnaire hand-
book. All you need to know to apply the UEQ suc-
cessfully in your project, pages 50–52.
Sharmin, S. (2022). Creativity in CS1: A Literature Review.
ACM Transactions on Computing Education, 22(2):1–
26.
Soepriyanto, Y., Azzahra Fazarini, P. F., Sulthoni, Maul-
ida, T. R., Nurfahrudianto, A., and Afandi, Z. (2022).
The Effect of Player Type in Learning Programming
with Online Gamification Activities on Student Learn-
ing Outcomes. In 2022 2nd International Conference
on Information Technology and Education (ICIT&E),
pages 382–386, Malang, Indonesia. IEEE.
Sung, E. and Mayer, R. E. (2012). When graphics improve
liking but not learning from online lessons. Computers
in human behavior, 28(5):1618–1625.
Um, E., Plass, J. L., Hayward, E. O., Homer, B. D., et al.
(2012). Emotional design in multimedia learning.
Journal of educational psychology, 104(2):485.
Uzun, A. M. and Yıldırım, Z. (2018). Exploring the effect
of using different levels of emotional design features
in multimedia science learning. Computers & Educa-
tion, 119:112–128.
CSEDU 2025 - 17th International Conference on Computer Supported Education
568
