
Planning Delivery Services: Depot Clustering Based on Socio-Economic
Indicators and Geospatial Metrics
I
˜
naki Cejudo
a
, Laura Rabad
´
an
b
, Eider Irigoyen
c
and Harbil Arregui
d
Intelligent Systems for Mobility and Logistics, Vicomtech Foundation, Basque Research and Technology Alliance (BRTA),
Mikeletegi 57, Donostia, Spain
{icejudo, lrabadan, eirigoyen, harregui}@vicomtech.org
Keywords:
Depot Clustering, Delivery Logistics, Socio-Economic Indicators, Urban Network, Decision Support Systems.
Abstract:
People’s lifestyles have evolved in recent years, making home deliveries a necessity for various types of
services. Moreover, with the growth of big data and Artificial Intelligence, predicting the performance and
customer demand of new businesses is a key aspect of logistics and last-mile delivery planning. By using
examples and predictions as a foundation for goods delivery services, initial over-sizing costs can be signifi-
cantly reduced. In this paper, we analyze and compare operational zone similarities for food and parcel deliv-
ery services in Spain, considering socio-economic indicators and urban network features. The study leverages
motorbike delivery metrics to complement the analysis. The results demonstrate how similar depots can be
clustered, providing a foundational performance scenario for decision-making when planning the launch of a
new service.
1 INTRODUCTION
The rapid evolution of urban lifestyles has signifi-
cantly transformed our habits in many aspects. One
of them is how e-commerce has altered our way of
buying things. We now buy from home and expect a
fast delivery. As customer habits were evolving, last-
mile delivery logistics in cities have adapted too. Fur-
thermore, these habits have been extended to order-
ing food, where in the last few years there has been
a game changer in cities with many riders delivering
food.
Opening new commerce now entails planning an
efficient last-mile delivery system, and it requires a
delicate balance between cost management, opera-
tional scalability, and customer satisfaction. More-
over, the diversity of urban environments, shaped by
socio-economic and geographical factors, adds layers
of complexity to this process. Understanding these
dynamics is essential for predicting the performance
of a new commerce in terms of demand, and therefore
correctly sizing the service needs, optimizing delivery
operations, and ensuring their sustainability in an in-
creasingly competitive market.
a
https://orcid.org/0000-0002-7325-9350
b
https://orcid.org/0000-0001-5912-046X
c
https://orcid.org/0000-0001-9486-0906
d
https://orcid.org/0000-0002-7934-9250
One of the biggest challenges is to predict the ser-
vice demand and profile and location of the potential
customers. This is essential for successful fleet sizing
and demand categorization. Recent studies have high-
lighted various approaches to tackle these challenges.
For instance, Hu et al. (2024) explored how infor-
mation and communication technology (ICT) impacts
the micro-location choices of stores in urban areas,
emphasizing the role of digital platforms in optimiz-
ing food delivery operations in densely populated dis-
tricts. Using real data and machine learning methods,
the work found the importance of considering loca-
tion and traffic patterns when designing efficient de-
livery zones.
Similarly, Ko et al. (2020) proposed a collabora-
tion model for service clustering in last-mile deliv-
ery, demonstrating that cooperative approaches can
enhance service efficiency and reduce costs. This
highlights the relevance of clustering methodologies
for planning delivery zones, especially in scenarios
with heterogeneous demand patterns.
Another perspective is provided by Ram
´
ırez-
Villamil et al. (2022), who used clustering techniques
to link clients to the satellites and improve last-mile
parcel delivery. Their findings reveal that integrating
data-driven clustering with logistics algorithms can
significantly reduce operational costs and improve de-
livery times.
172
Cejudo, I., Rabadán, L., Irigoyen, E. and Arregui, H.
Planning Delivery Services: Depot Clustering Based on Socio-Economic Indicators and Geospatial Metrics.
DOI: 10.5220/0013355200003935
Paper published under CC license (CC BY-NC-ND 4.0)
In Proceedings of the 11th International Conference on Geographical Information Systems Theory, Applications and Management (GISTAM 2025), pages 172-178
ISBN: 978-989-758-741-2; ISSN: 2184-500X
Proceedings Copyright © 2025 by SCITEPRESS – Science and Technology Publications, Lda.

In another context, Regal et al. (2023) highlighted
in their analysis how clustering can capture the di-
verse socio-economic and functional characteristics
of urban regions, easing more tailored and efficient
delivery strategies. This work aligns with the need for
approaches that integrate socio-economic and geospa-
tial data to address the complexities of urban logistics.
The analysis of Kang (2020) complements the dis-
cussion by examining the spatial evolution of ware-
house and logistics center locations, emphasizing
their tendency to move from urban centers to the pe-
riphery despite the significant growth of online shop-
ping and the demand for instant delivery services.
Regarding machine learning algorithms, Sarkar
(2024), and Wangwattanakool and Laesanklang
(2024) explored customer segmentation and delivery
zone partitioning, both using advanced clustering al-
gorithms. Their research demonstrates how clustering
can be leveraged not only to understand customer be-
havior but also to establish delivery zones. K-means
algorithm is shown to be effective for these tasks. Be-
sides, Dupas et al. (2024) propose a K-means cluster-
ing approach to allocate customers to depots and opti-
mize vehicle routing, evaluating both the operational
efficiency and the impact of last-mile depot locations.
Lastly, Zheng et al. (2023) applied fuzzy cluster-
ing analysis to optimize logistics distribution based on
customer demand attributes.
Overall, these studies have demonstrated how
clustering urban areas and clients is a meaningful
method for a first-base idea for business sizing and
logistics planning. Most of them focus on clustering
customer demand based on geographical coordinates
or on client profiles.
This paper proposes a clustering approach for
food and parcel delivery services in Spain, that in-
corporates socio-economic indicators and urban net-
work features, based on the amount of demand from
specific small areas within a city. By analyzing the
clustering differences and similarities in operation
zones concerning the group of indicators used, our
study provides insights into depot performance and
decision-making in last-mile delivery planning.
2 DATA DRIVEN APPROACH
Building depot clustering algorithms requires know-
ing specific metrics of stores performance. Using de-
livery electric and combustion motorbike data from
food and parcel delivery services, in a prior work the
process to link that data to specific depots and extract
performance metrics and statistics of each service was
made (Arregui et al., 2024). The result was the de-
tection of many food and parcel delivery services in
Spain, the motorbikes that operate within each ser-
vice, geolocated trips, and delivery data of each mo-
torbike. The data used in this work is from 2024 and
overall, we have detected 854 parcel and 579 food de-
livery services.
Additionally, this data is enhanced with open data
population indicators and geospatial information of
the urban areas.
2.1 Depot’s Performance Metrics
After the corresponding data cleaning and processing,
the obtained daily performance metrics of each depot
are the following:
• Number of bikes
• Time of use of each bike
• Distance covered by each bike
• Number of deliveries per km
• Consumption per km
• Average delivery radius
• Maximum delivery radius
• Average time per trip
• Number of deliveries per trip
• Total number of deliveries
With this data, we are capable of knowing the de-
livery demand in every area of a city and the fleet met-
rics, therefore we are able to use this information as
a benchmark for future service planning. The depot
clustering analysis increases the usability of this in-
formation, and it relies on socio-economic and net-
work features.
2.2 Socio-Economic Data
In Spain, the National Statistics Institute (Instituto
Nacional de Estad
´
ıstica, 2024) offers insights into
many social, demographic, and economic indicators
with a high granularity. These indicators show, for
instance, inhabitants, genre, origin, educational level,
working status, marital status, and housing. The data
is updated to the year 2022. The full list of indicators
is depicted in Table 1.
2.3 Network Features
The heterogeneity of urban areas can be captured us-
ing Open Street Map (OSM) data enhanced with ele-
vation data. We can obtain interesting geospatial indi-
cators to cluster the services based on metrics such as
Planning Delivery Services: Depot Clustering Based on Socio-Economic Indicators and Geospatial Metrics
173

Table 1: Socio-economic indicators published by the Statistics National Institute (INE) of Spain.
Code Indicator Code Indicator
t1 1 Total people t17 3 Percentage of widowed people
t2 1 Percentage of women t17 4 Percentage of people with unknown marital status
t2 2 Percentage of men t17 5 Percentage of people legally separated or divorced
t3 1 Average age t18 1 Total dwellings
t4 1 Percentage of people under 16 t19 1 Primary dwellings
t4 2 Percentage of people aged 16 (inclusive) to 64 (in-
clusive)
t19 2 Non-Primary dwellings
t4 3 Percentage of people over 64 t20 1 Owner-occupied dwellings
t5 1 Percentage of foreigners t20 2 Rented dwellings
t6 1 Percentage of people born abroad t20 3 Dwellings under other tenure types
t7 1 Percentage of people pursuing higher education
over population 16+
t21 1 Total households
t8 1 Percentage of people pursuing university education
over population 16+
t22 1 Single-person households
t9 1 Percentage of people with higher education over
population 16+
t22 2 Two-person households
t10 1 Percentage of unemployed people over active pop-
ulation
t22 3 Three-person households
t11 1 Percentage of employed people over population
16+
t22 4 Four-person households
t12 1 Percentage of active population over population
16+
t22 5 Five-or-more-person households
t13 1 Percentage of disability pensioners over population
16+
r1 Average net income per person
t14 1 Percentage of retirement pensioners over popula-
tion 16+
r2 Average net income per household
t15 1 Percentage of people in other inactive situations
over population 16+
r3 Average income per unit of consumption
t16 1 Percentage of students over population 16+ r4 Median income per unit of consumption
t17 1 Percentage of single people r5 Average gross income per person
t17 2 Percentage of married people r6 Average gross income per household
area, elevation, road speed, slope, etc. After a process
to extract the metrics, these are depicted in Table 2.
3 METHODOLOGY
3.1 Weighting the Variables
Socio-economic and network features are obtained at
the census section level. A census section is the small-
est administrative unit used for statistical purposes in
Spain. It is defined by the INE and typically cor-
responds to a neighborhood or a similar small geo-
graphic area within a municipality.
For each depot, this data is aggregated from all the
individual census sections where deliveries are made.
However, the number of deliveries in each census sec-
tion can vary a lot. For instance, we can have a big
census section with just a few deliveries and a small
one with many deliveries. This particular case makes
the smallest census section’s indicators and metrics
more meaningful for that service than the ones of the
bigger area. Therefore, it is necessary to weigh every
socio-economic and geospatial indicator according to
the number of deliveries made in each area.
Clustering analysis is carried out separately for
parcel and food delivery. This separation attends to
the performance, demand, and delivery differences
between these two service types. For each of them,
socio-economic and network indicators from all de-
pots are analyzed. Although some clustering meth-
ods, such as hierarchical clustering or density-based
methods could be used, because of the regular distri-
bution of data, the ease of finding an optimal number
of clusters, and results interpretability, K-means algo-
rithm, a widely used unsupervised machine learning
algorithm was chosen. It divides the data by a pre-
defined number of clusters, where each data point be-
longs to the cluster with the nearest mean, minimiz-
ing the variance within clusters. It has proven to be a
good method for customer segmentation among other
applications.
Once the clustering is made, a classification
dataset is created with the 854 parcel delivery services
and their corresponding socio-economic and network
features. The clustering group is added to the dataset
as the target variable. The same is done with the 579
GISTAM 2025 - 11th International Conference on Geographical Information Systems Theory, Applications and Management
174

Table 2: Network features.
Code Description
surface m2 Average area of the census
sections
way distance meters Average road distance within
the census sections
num of nodes Average number of nodes in
the census sections
avg speed Average maximum speed of
roads in the census sections
max max speed Average of the maximum
speed of roads in the census
sections
min max speed Average of the minimum
speed of roads in the census
sections
speed percentil 10 10th percentile of the average
maximum speeds in the cen-
sus sections
speed percentil 90 90th percentile of the average
maximum speeds in the cen-
sus sections
avg elev Average of the average eleva-
tion in the census sections
max elev Average of the maximum ele-
vations in the census sections
min elev Average of the minimum ele-
vations in the census sections
elev percentil 10 10th percentile of the average
elevations in the census sec-
tions
elev percentil 90 90th percentile of the average
elevations in the census sec-
tions
avg slope Average of the average slope
in the census sections
food delivery services. These datasets are used to cre-
ate classification models with random forest machine
learning algorithms, and these models can serve as a
tool for decision-making.
3.2 Parcel Delivery Clustering
K-means algorithm needs the optimal number of clus-
ters to be predefined. For choosing the best number in
each iteration, we use 3 different methods: K-means
Inertia, GMM (Gaussian Mixture Model) BIC, and
GMM AIC methods. The optimal number depends
on the data used, therefore we have different numbers
of optimal clusters when using socio-economic indi-
cators or network features. These numbers are:
• For socio-economic indicators: 6 clusters
• For network features: 4 clusters
The generated clusters distribution is depicted in
Figure 1.
Figure 1: Parcel socio-economic vs network features cluster
distribution.
An overview of the indicator’s impact on forming
each cluster is shown in Figure 2. We can observe for
example the variables that do not have almost an im-
pact or the ones that have an impact in more than one
cluster. Focusing on geospatial clustering, elevation
metrics are meaningful to form two of the clusters.
With all the depots linked to a cluster, we have
created random forest classification models to predict
new depots. The models show an accuracy of 90% for
the socio-economic analysis and 93% for the geospa-
tial analysis.
To better understand the model performance and
have more information for future decision-making,
we have looked into the model explainability through
a feature importance method. SHAP (SHapley Addi-
tive exPlanations) values allow understanding a ma-
chine learning model prediction by assigning each
feature a contribution to the output. It shows which
indicators have a bigger impact on each class predic-
tion, Figure 3. In the case of socioeconomic indica-
tors, apart from the salary variables, t6 1, t20 2, and
t4 3 are the ones with a higher importance. These are
related to age, origin, and housing. Although there
are other indicators like t12 1 and t11 1, related to
employment, that have a considerable impact in some
specific clusters. For the network features, we appre-
ciate that speed percentil 10 is taken into account for
two clusters followed by avg elev in four clusters.
3.3 Food Delivery Clustering
Food delivery services work on a different basis than
parcel ones. For instance, in every food delivery trip,
the rider usually serves a few customers and then re-
turns to the depot. Therefore, we have different per-
formance metrics and a separate clustering study. The
optimal number of cluster groups, using the same
methods as in parcel analysis, are:
• For socio-economic indicators: 5 clusters
• For network features: 6 clusters
The generated clusters and their distribution are
depicted in Figure 4. Unlike for socio-economic clus-
Planning Delivery Services: Depot Clustering Based on Socio-Economic Indicators and Geospatial Metrics
175
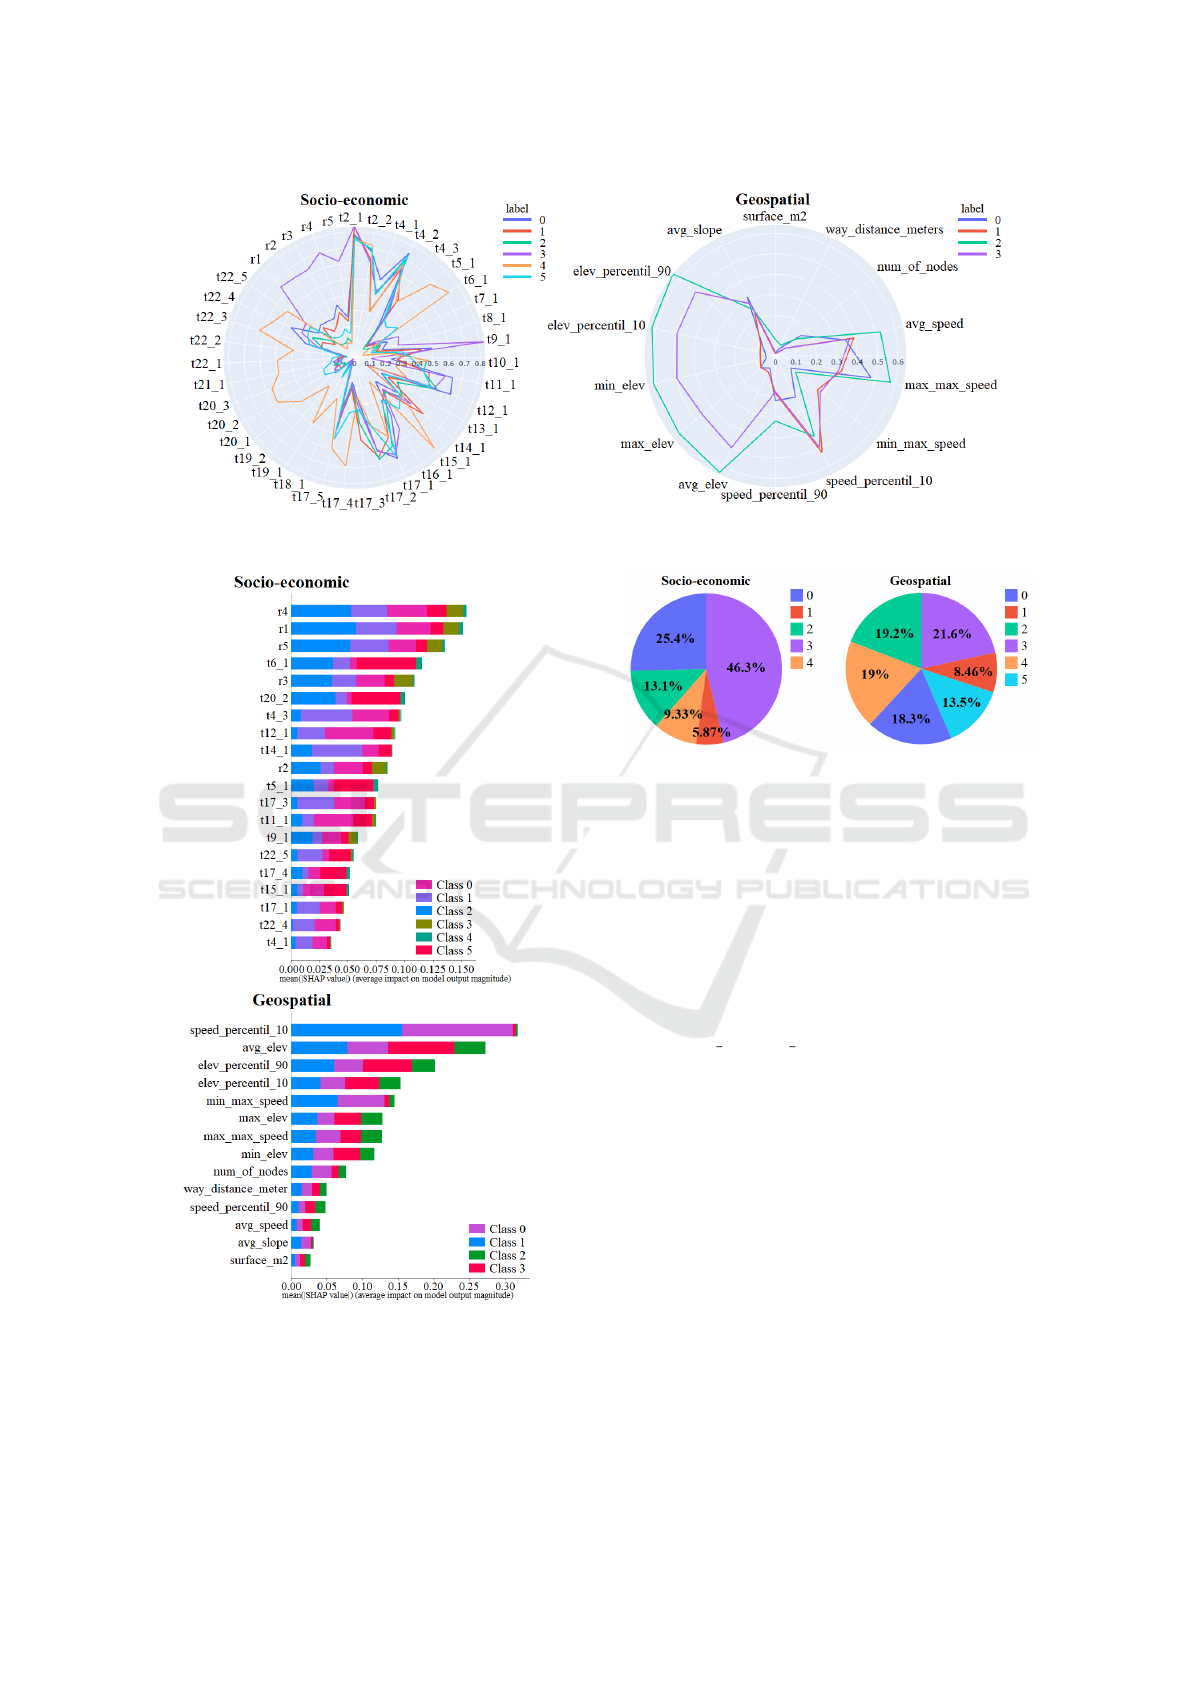
Figure 2: Parcel socio-economic vs network variables in clustering.
Figure 3: Parcel socio-economic vs network features im-
portance.
ters, we see a balanced distribution for those with the
network features.
Figure 5 shows the impact of the indicators to cre-
Figure 4: Food socio-economic vs network features cluster
distribution.
ate each cluster. It is worth mentioning that the most
impacting network features are the same as in parcel
delivery analysis.
Regarding the classification models, they give an
accuracy of 94% in the socio-economic case and 91%
in the geospatial case.
Finally, features importance for the model pre-
diction, Figure 6, shows how for the socio-economic
analysis, salary variables are again important, but now
we have t14
1 and t9 1, related to retired people and
education level respectively. In the geospatial case,
now the lowest maximum speeds impact considerably
in all the clusters while surface and average slope do
not have any impact again.
4 APPLICATION USE CASE
A module has been built to plan services and their lo-
cations. The process starts with the user selecting the
estimated delivery area of a new store on a map. Pos-
sible depot locations can also be selected, for which
accessibility and centrality road network metrics are
obtained. These metrics help decide the best possible
location for the depot.
The socio-economic and network features of the
GISTAM 2025 - 11th International Conference on Geographical Information Systems Theory, Applications and Management
176
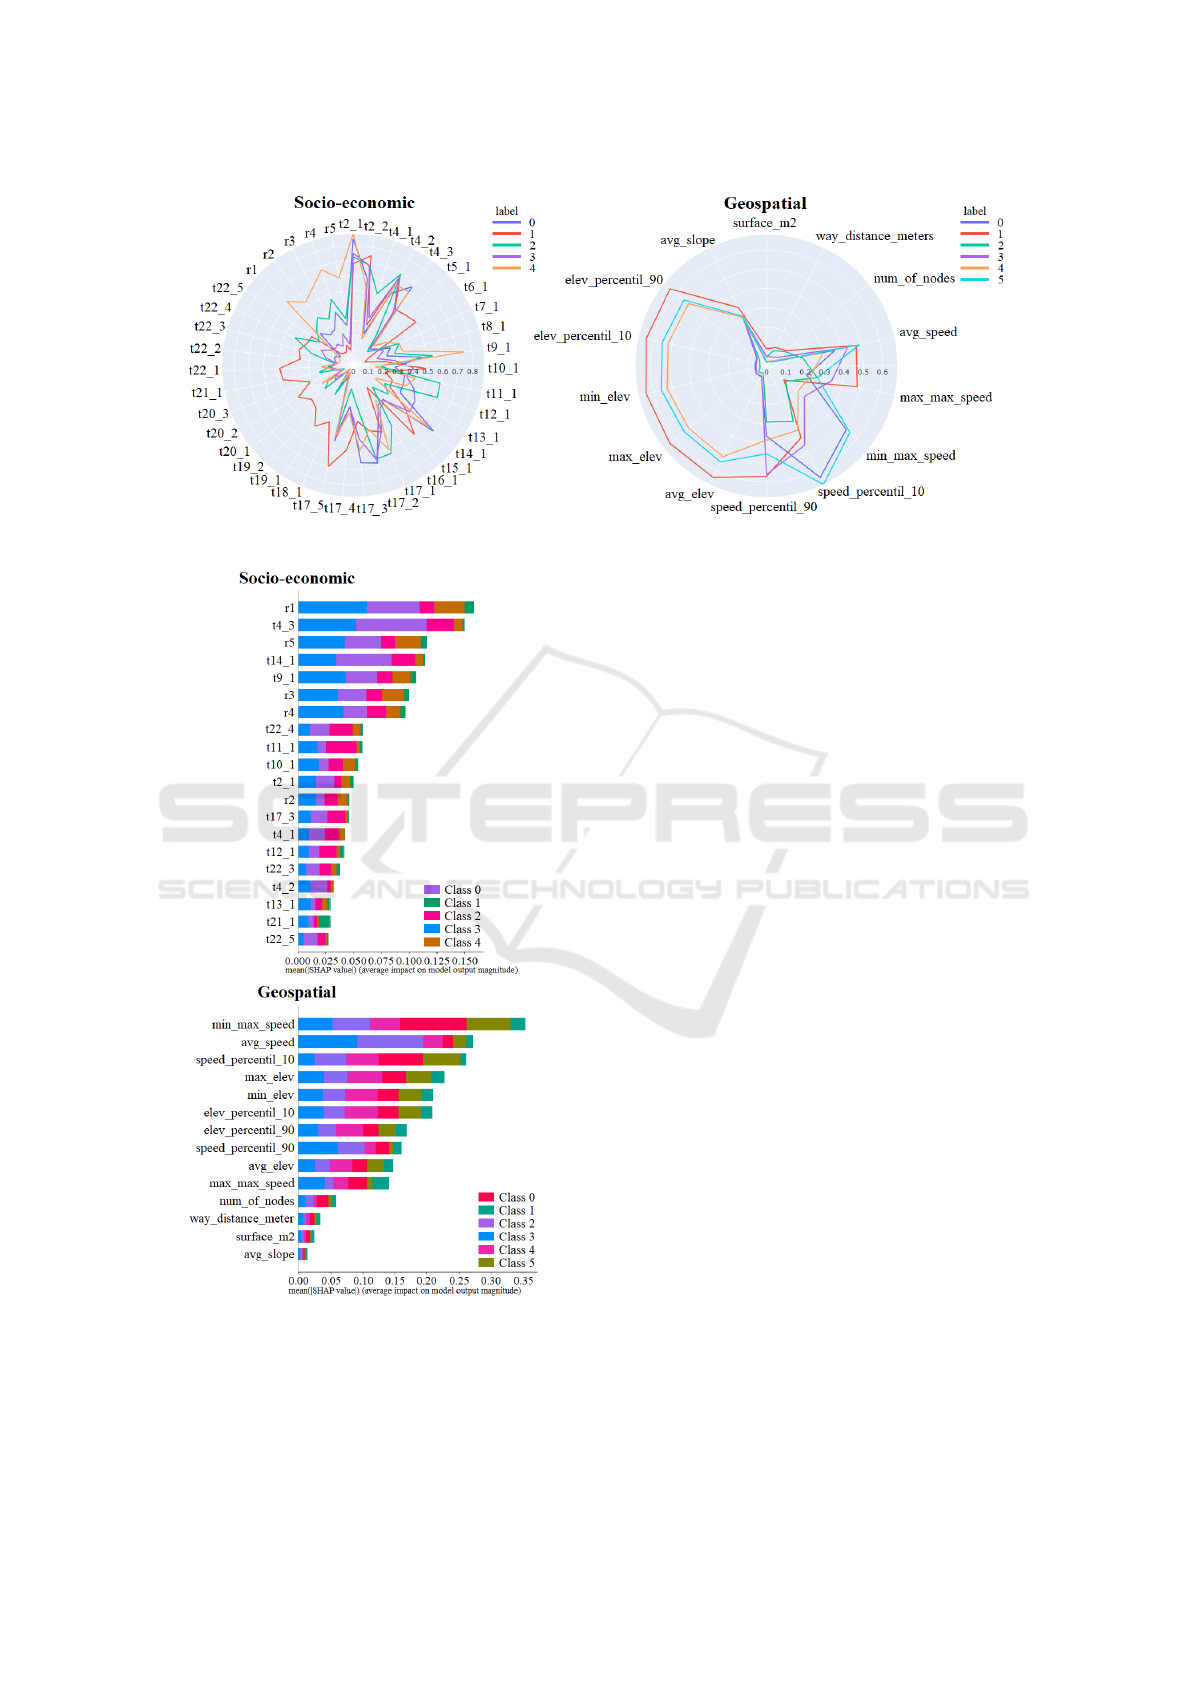
Figure 5: Food socio-economic vs network variables in clustering.
Figure 6: Food socio-economic vs network features impor-
tance.
census sections within the designed delivery area are
aggregated and serve as input for the classification
model. The model classifies the new depot within a
group, and every depot’s performance metrics of that
cluster are shown. Then, filtering can be made to keep
only the most similar services according to some spe-
cific metrics, such as depots with a similar delivery
area extension. Additionally, the average demand and
fleet performance indicators of the filtered group are
shown.
With this application, when a company designs a
new service delivery area, it will be classified into
a group of services with similar socio-economic and
geographic conditions. These similar services show
their fleet characteristics, performance, and delivery
metrics. Therefore, this information can be used as a
benchmark for decision-making regarding the sizing
needs of the new service.
5 CONCLUSIONS
In this work, we have followed a methodology to clus-
ter food and parcel delivery services from delivery
motorbikes data, based on socio-economic indicators
and geospatial metrics of the census sections where
deliveries are made. The clustering results show pat-
terns to classify these services based on how the in-
habitants are or where they live. Additionally, the
classification models show high accuracy and serve as
a tool to obtain insights into the most meaningful vari-
ables and similarities of services already tested and
working at the moment. Although the study has been
done in the context of Spain, the same methodology
can be followed in other places where service perfor-
mance metrics and socio-economic or urban charac-
teristics data could be obtained.
Opening a commerce poses several challenges and
uncertainty regarding the social scenario and deliv-
ery fleet needs. Depot’s performance metrics such as
number of motorbikes, average delivery radius, con-
Planning Delivery Services: Depot Clustering Based on Socio-Economic Indicators and Geospatial Metrics
177

sumption per km, or total number of deliveries are
crucial indicators to ease this uncertainty.
This study can be used as a benchmark for store
owners to plan and size new stores, their location, and
delivery logistics.
REFERENCES
Arregui, H., Cejudo, I., Arandia, I., Mujika, A., Eider, I.,
Laura, R., and Estibaliz, L. (2024). Last-mile deliv-
ery through electric motorbikes: Modelling consider-
ations for parcel vs. food delivery. In 10th Conference
of Transport Research Arena, TRA 2024. In press.
Dupas, R., Hsu, T., and Taniguchi, E. (2024). A clustering-
routing approach for assigning customers to depots in
last mile delivery. Transportation Research Procedia,
79:13–20.
Hu, X., Zhang, G., Shi, Y., and Yu, P. (2024). How in-
formation and communications technology affects the
micro-location choices of stores on on-demand food
delivery platforms: Evidence from xinjiekou’s central
business district in nanjing. ISPRS International Jour-
nal of Geo-Information, 13(2).
Instituto Nacional de Estad
´
ıstica (2024). Instituto Nacional
de Estad
´
ıstica. https://www.ine.es/. Retrieved Febru-
ary 5, 2024.
Kang, S. (2020). Relative logistics sprawl: Measuring
changes in the relative distribution from warehouses to
logistics businesses and the general population. Jour-
nal of Transport Geography, 83:102636.
Ko, S. Y., Sari, R. P., Makhmudov, M., and Ko, C. S. (2020).
Collaboration model for service clustering in last-mile
delivery. Sustainability, 12(14).
Ram
´
ırez-Villamil, A., Montoya-Torres, J. R., Jaegler, A.,
Cuevas-Torres, J. M., Cort
´
es-Murcia, D. L., and Guer-
rero, W. J. (2022). Integrating clustering methodolo-
gies and routing optimization algorithms for last-mile
parcel delivery. In de Armas, J., Ramalhinho, H., and
Voß, S., editors, Computational Logistics, pages 275–
287, Cham. Springer International Publishing.
Regal, A., Gonzalez-Feliu, J., and Rodriguez, M. (2023).
A spatio-functional logistics profile clustering analy-
sis method for metropolitan areas. Transportation Re-
search Part E: Logistics and Transportation Review,
179:103312.
Sarkar, M., P. A. R. . C. F. R. (2024). Optimizing marketing
strategies with rfm method and k-means clustering-
based ai customer segmentation analysis. Journal of
Business and Management Studies, 6(2):54–60.
Wangwattanakool, J. and Laesanklang, W. (2024). Delivery
zones partitioning considering workload balance us-
ing clustering algorithm. In 14th International Con-
ference on Simulation and Modeling Methodologies,
Technologies and Applications, SIMULTECH 2024,
pages 378–385. Science and Technology Publications,
Lda.
Zheng, K., Huo, X., Jasimuddin, S., Zhang, J. Z., and
Batta
¨
ıa, O. (2023). Logistics distribution opti-
mization: Fuzzy clustering analysis of e-commerce
customers’ demands. Computers in Industry,
151:103960.
GISTAM 2025 - 11th International Conference on Geographical Information Systems Theory, Applications and Management
178
