
Graph-Based Learning for Multimodal Route Recommendation
Zakariya Ghalmane
a
and Brahim Daoud
CESI LINEACT UR 7527, Strasbourg, France
Keywords:
Graph Convolutional Network, Complex Networks, Centrality Measures, Multi-Task Learning, Multimodal
Transportation, Route Recommendation.
Abstract:
Transportation recommendations are a vital feature of map services in navigation applications. Earlier trans-
portation recommendation systems have struggled to deliver a satisfactory user experience because they focus
exclusively on single-mode routes, such as cycling, taxis, or buses. In this paper, we represent the transporta-
tion network as a complex network (or graph). Modeling transportation as a network of nodes and edges has
gained attention in the literature, generating numerous studies over the years. This approach requires a clear
definition of what constitutes a node or an edge: nodes represent stops, while edges represent road segments
connecting these stops. Based on this representation, we propose a framework that generates embeddings for
each node and edge in the transportation network. These embeddings are created using GRU (Gated Recurrent
Units) and GCN (Graph Convolutional Network) models to capture spatial and temporal patterns within the
network, while incorporating centrality measures reflecting the influence of each stop. This vector represen-
tation facilitates multi-task learning for effective multi-modal transportation recommendations. The proposed
framework is applied to the transportation network of Strasbourg, France. Experimental results demonstrate
the framework’s efficiency in recommending suitable multimodal transportation routes, considering criteria
such as meteorological conditions, safety, and passenger comfort.
1 INTRODUCTION
The growing prevalence of diverse modes of trans-
portation (such as buses, cars, bike-sharing, carpool-
ing, . . . ) and the rapid expansion of transportation
networks (like bus, pedestrian or road networks, . . . .)
have offered travelers with a multitude of options to
reach their destinations. Over the past few years,
transport recommendation has emerged as a valu-
able routing service within various navigation and
carpooling applications, such as Here, Didi Chuxing
and Baidu Maps. The goal of transport recommen-
dation is to assist users in finding the most suitable
route from one location to another.As a result, pre-
cise and intelligent transport recommendations can al-
low to significantly help reduce travelers’ decision-
making costs and ultimately enhance the user experi-
ence (Song et al., 2018).
Recently, researchers devoted considerable atten-
tion to route recommendation because of its essential
component in mapping services (Wei et al., 2012).
The quality of route recommendations has been im-
proved by leveraging massive historical datasets (such
a
https://orcid.org/0000-0002-2440-2886
as mobile registration data (Shafique and Ali, 2016),
and GPS trajectory data (Yuan et al., 2010)) with
the widespread use of mobile devices and location-
based services. Existing studies on transport mode
recommendation can be grouped into three main cat-
egories. The first category focuses on finding the
shortest path within the transport network, based on a
predefined distance metric (e.g., geographic distance,
travel time). Most methods in this category extend
graph search algorithms to transport networks (e.g.,
Dijkstra, Bellman–Ford, and contraction hierarchies)
(Candra et al., 2020; Iqbal et al., 2018; Geisberger
et al., 2012). However, these approaches rely heav-
ily on a predefined metric like the distance and of-
ten overlook latent factors in the data such us mode
and route preferences in different situational con-
texts (Liu et al., 2019). The second category par-
tially addresses this limitation by inferring transport
mode preferences using supervised or unsupervised
machine learning techniques. A common approach
in such methods is to explicitly extract features (dis-
tance, estimated time of arrival (ETA)) from historical
user data, such as GPS trajectories and in-app clicks.
These methods make recommendations based on em-
Ghalmane, Z. and Daoud, B.
Graph-Based Learning for Multimodal Route Recommendation.
DOI: 10.5220/0013356300003944
Paper published under CC license (CC BY-NC-ND 4.0)
In Proceedings of the 10th International Conference on Internet of Things, Big Data and Security (IoTBDS 2025), pages 313-320
ISBN: 978-989-758-750-4; ISSN: 2184-4976
Proceedings Copyright © 2025 by SCITEPRESS – Science and Technology Publications, Lda.
313

pirically defined features, which heavily depend on
the completeness of feature engineering. More re-
cent studies have applied deep learning to transport
mode recommendation (Chen et al., 2020; Liu and
Jiang, 2022; Hopman et al., 2021). The third category
uses graph-based learning, extending Graph Neu-
ral Networks (GNNs), which are well-suited to cap-
ture spatial dependencies in graph structures (Sharma
et al., 2023; Hamilton et al., 2017; Jiang and Luo,
2022; Kipf and Welling, 2016; da Silva et al., 2023;
MOEZZI, ; Jana et al., 2023). Recently, graph-based
learning has been widely applied to many spatiotem-
poral exploration tasks, such as flow prediction and
parking availability prediction (Wang et al., 2019).
However, none of the aforementioned studies specifi-
cally address multimodal transport recommendations.
In this context, the objective of this work is to
model the multimodal transportation network using
a graph or a complex network approach. Complex
network (graph) modelization is essential for uncov-
ering hidden patterns in interconnected systems, with
applications spanning diverse domains such as biol-
ogy, social sciences, technology, and transportation
(Ding et al., 2019; Termos et al., 2024; Termos et al.,
2023; Latora et al., 2017; GHALMANE et al., 2023;
Shanmukhappa et al., 2019; Zanin and Lillo, 2013;
Ghalmane et al., 2020; Ghalmane et al., 2021; Ghal-
mane et al., 2022). To achieve this, we discretize
the multimodal transportation network into a series
of graph snapshots over time and construct a tempo-
ral graph, where each node represents a bus, metro,
tram, or bike-sharing station, and each link repre-
sents a bus/metro/tram line or road segment. This
model provides critical structural insights into the
transportation network. Based on this model, we
propose a framework comprising two main compo-
nents: a prediction module and a recommendation
module. The prediction module includes a spatiotem-
poral GNN-based model, which features a GRU layer
for capturing temporal autocorrelations across mul-
tiple graph snapshots, and a GNN layer for captur-
ing non-linear spatial autocorrelations from the trans-
portation network graph. These representation-based
models excel in capturing relationships and patterns
in graph-structured data, making them highly suitable
for transportation network modeling. In this repre-
sentation, the centrality measures (Ghalmane et al.,
2019; Ghalmane et al., 2018a) are also added to the
embedding of each node (stop) quantifying its impor-
tance in the transportation network. The prediction
module enables the forecasting of parameters for each
itinerary, such as route distance, travel duration, CO2
emission, confort and safety. These predicted param-
eters are then used to classify different itineraries, fa-
cilitating the recommendation of the best multimodal
itinerary. The recommendation process relies on an
objective function that aligns with multiple goals, in-
cluding minimizing carbon emissions, reducing travel
time, and enhancing safety and comfort. This pro-
posed framework was applied to the transportation
network of Strasbourg, France, to assist students in
navigating from their homes to their campuses. Re-
sults demonstrate that the framework accurately rec-
ommends the best multimodal itineraries for students
in Strasbourg. Furthermore, the proposed framework
can be generalized to other cities with different trans-
portation infrastructures. In this paper, we focus on
Strasbourg due to the availability of transportation
data for the city.
The remainder of this paper is organized as fol-
lows: Section 2 outlines the methodology, detailing
the graph construction, feature selection, and integra-
tion of complex network measures with the GNN and
GRU models. Section 3 presents the experimental re-
sults on Strasbourg’s transportation network data. Fi-
nally, Section 5 summarizes the contributions of the
methodology and concludes the study.
2 MATERIALS AND METHODS
In this section, we begin by providing an overview
of the proposed approach, followed by a detailed de-
scription of each step in the subsequent subsections.
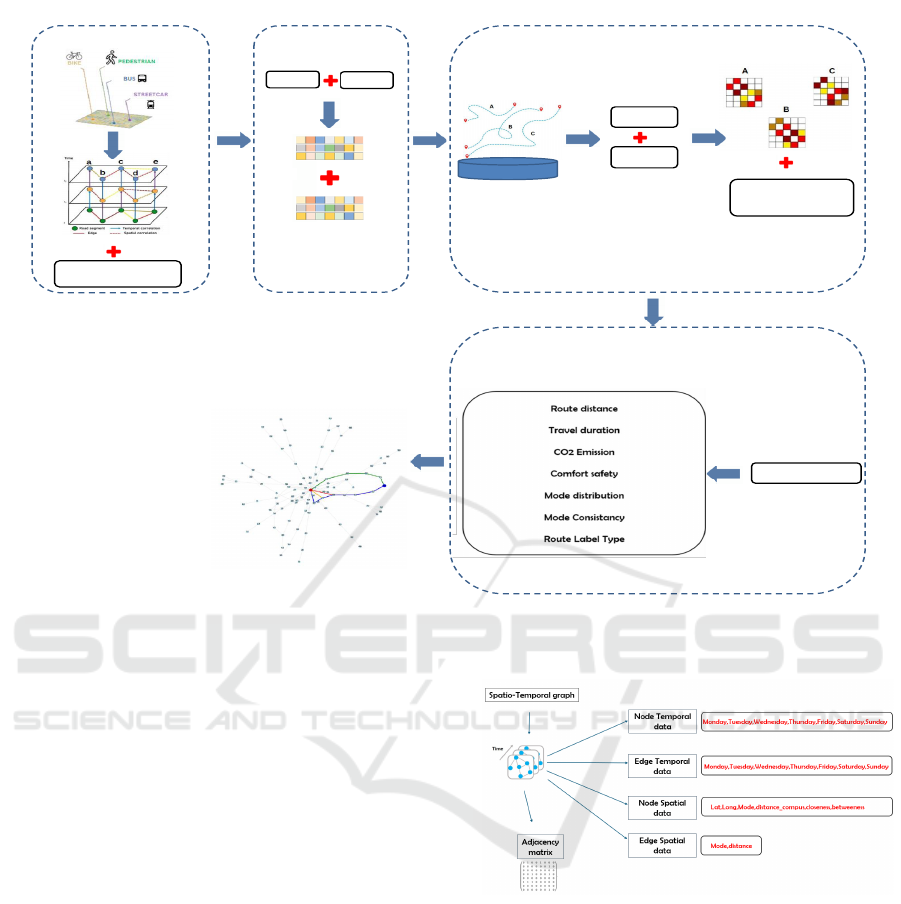
2.1 General Scheme
Here, we provide an overview of the proposed
methodology, as illustrated in Figure 1. First, a com-
plex network (or graph) is constructed based on trans-
portation data. This graph is inherently temporal,
reflecting the dynamic nature of transportation net-
works. Each node and edge in the graph is asso-
ciated with a set of features, including two central-
ity measures: Betweenness and Closeness (Ghalmane
et al., 2019; Ghalmane et al., 2018a; Ghalmane et al.,
2018b). These centrality measures offer insights into
the relative importance of nodes (stops) in connecting
different routes and regions within the transportation
network. Once the graph is constructed with these
enriched node and edge features, the prediction and
recommendation modules are applied. The first com-
ponent of the prediction module involves two mod-
els: GRU (Gated Recurrent Units) and GCN (Graph
Convolutional Network). These models generate em-
beddings for each node and edge, capturing the spa-
tial and temporal patterns within the network. Sub-
sequently, the overall embedding of a given route is
IoTBDS 2025 - 10th International Conference on Internet of Things, Big Data and Security
314
Multi-modal transportation
recommendation
GCN
GRU
Historical data
BiGRU
Attention
One Hot Encoded
Context
Temporal multimodal graph creation
Node and edge embedding
Route sequences learning
Multi-task learning
Neural Network
Centrality measures
Figure 1: General scheme of the proposed framework.
computed using a BiGRU model, leveraging the em-
beddings of the sequence of nodes and edges that con-
stitute the input route. In the second component of
the prediction module, these route embeddings are
combined with contextual data—such as safety, com-
fort, and meteorological conditions—and are fed into
a multi-layer neural network. This network performs
multiple regression and classification tasks to predict
various parameters for each route, including route dis-
tance, travel duration, CO2 emissions, comfort level,
safety, mode consistency, and route type. Finally,
the recommendation module ranks the different routes
based on these predicted parameters. This ranking is
achieved using an objective function.
2.2 Temporal Multimodal Graph
Creation
The transportation network is modeled as a multi-
modal graph representing bus, tram, and bike-sharing
systems, with nodes for stations and edges for con-
nections. Data from General Transit Feed Specifica-
tion (GTFS) and General Bikeshare Feed Specifica-
tion (GBFS) files is used to create the graph, link-
ing bus/tram stops and bike stations based on prox-
Figure 2: The spatial, temporal and network features of the
multimodal network.
imity and transfer points. Each node and edge is
enriched with spatial and temporal features, such as
geographic coordinates, centrality measures (close-
ness and betweenness), and estimated daily passen-
ger flow. Temporal data is added to capture network
dynamics, including passenger counts and route ca-
pacities throughout the day. This multimodal network
helps optimize travel routes and analyze urban trans-
portation patterns, considering both static and time-
dependent network changes.
Graph-Based Learning for Multimodal Route Recommendation
315
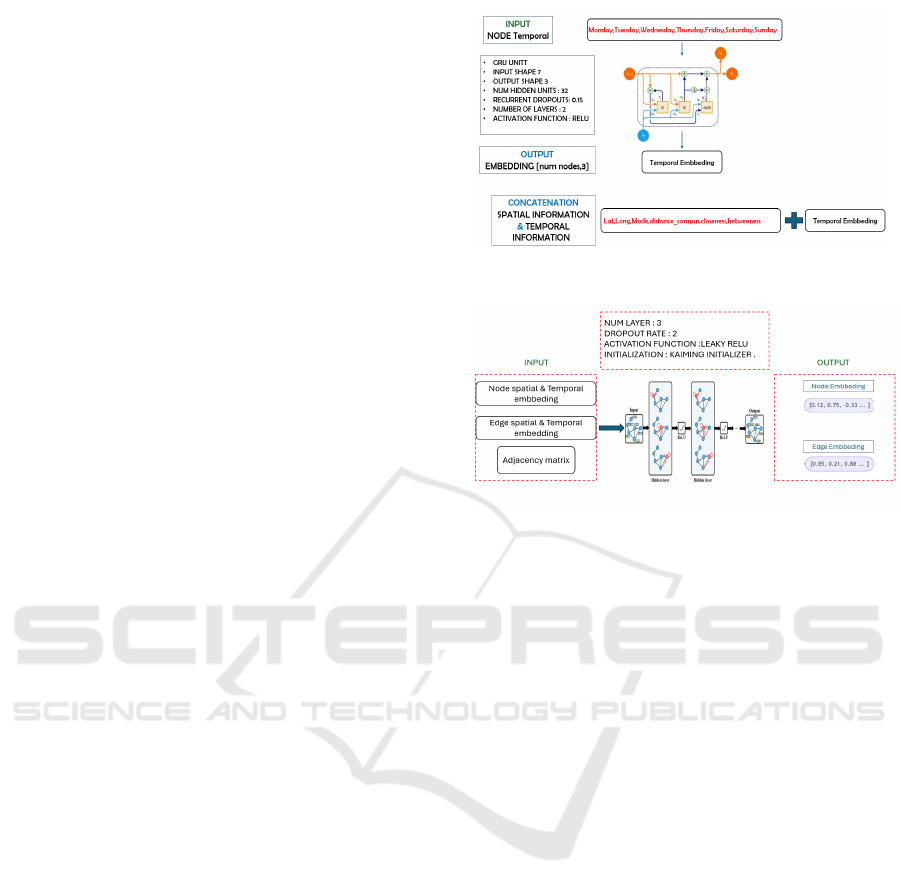
2.3 Node and Edge Embedding
2.3.1 Temporal Embedding
The temporal pattern of the multimodal network is
captured by using Gated Recurrent Unit (GRU) model
(Yu et al., 2019). The output of the GRU layer is a
temporal embedding for each node and edge. This
embedding condenses the temporal patterns captured
over the week into a lower-dimensional space, allow-
ing the model to focus on the most relevant temporal
dynamics for subsequent learning tasks. The tempo-
ral data is processed by a GRU, a common sequence
modeling layer. The GRU is configured with:
- Input Shape: 7, representing the number of days
in the week as temporal features.
- Output Shape: 3, indicating that the GRU re-
duces the temporal data into a 3-dimensional em-
bedding for each node.
- Number of Hidden Units: 32, which defines the
number of neurons in the hidden layers of the
GRU, controlling the capacity to capture tempo-
ral dependencies.
- Recurrent Dropout: 0.15, applying dropout to
prevent overfitting during the learning process.
- Number of Layers: 2, meaning that the GRU has
two layers to ensure deeper processing of sequen-
tial information.
- Activation Function: ReLU, which introduces
non-linearity in the model and helps in capturing
complex temporal interactions.
Following the generation of the temporal embedding
for nodes and edges, the temporal information is
concatenated with spatial features. The spatial
information complements the temporal embedding,
allowing the model to integrate both spatial and
temporal correlations. This combination is critical
for understanding how transportation modes and dis-
tances vary over time in the multimodal network. It is
illustrated in Figure 3 for temporal nodes embedding
(the same process is applied to edges).
2.3.2 Spatio-Temporal Embedding
In this section, we observe that the input to the GCN
(Zhang et al., 2019) consists of both node and edge
embeddings, which capture the spatial and temporal
properties of the graph. The concatenation of spatial
and temporal embeddings for both nodes and edges
provides a comprehensive representation of the trans-
portation network. Additionally, the adjacency matrix
Figure 3: Temporal node embedding.
Figure 4: Spatio-temporal correlation.
is included to encode the graph’s structure, describ-
ing the relationships between nodes (i.e., the connec-
tivity of the network). The GCN processes the input
embeddings over multiple layers to produce refined
representations. The configuration of the GCN is as
follows:
- Number of Layers: 3, providing the network
with the depth to capture higher-order neighbor-
hood information in the graph.
- Dropout Rate: 2, to prevent overfitting and en-
sure robust generalization during training.
- Activation Function: Leaky ReLU, which in-
troduces non-linearity while allowing for a small
gradient when the unit is not active.
- Initialization: Kaiming initializer, used for
weight initialization to ensure faster convergence
and prevent vanishing gradients, particularly in
deeper layers.
As depicted in Figure 4, the graph convolution
operation is applied iteratively across hidden layers.
At each layer, the GCN aggregates information from
neighboring nodes and edges, thus refining the node
and edge embeddings. The ReLU activation func-
tion is used after each convolution to introduce non-
linearity and capture more complex relationships in
the data. The final output of the GCN is a set of re-
fined embeddings for both nodes and edges. These
embeddings are used for downstream tasks, such as
prediction or classification. The node embeddings
IoTBDS 2025 - 10th International Conference on Internet of Things, Big Data and Security
316
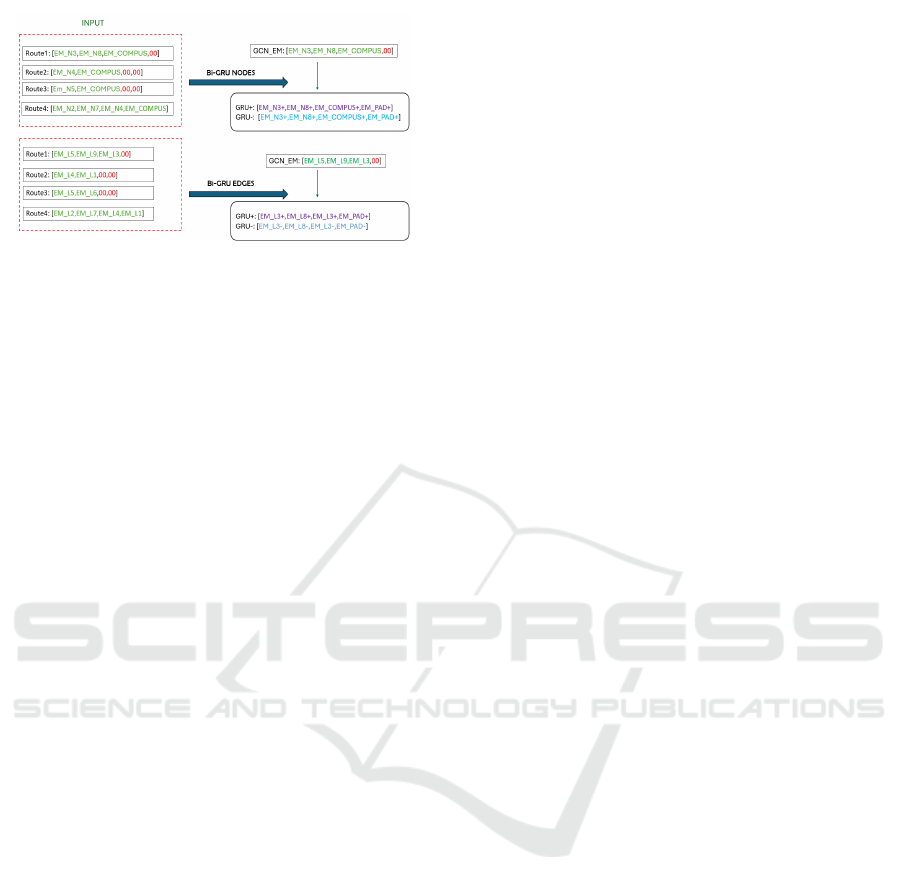
Figure 5: Route sequence learning.
capture the latent spatial and temporal features of
each location (bus/tram/bike stop), while the edge em-
beddings encode the dynamic relationships between
connected locations. The embeddings are represented
as multidimensional vectors, as illustrated in the out-
put boxes.
2.4 Route Sequences and Multi-Task
Learning
In this step, the historical routes, consisting of both
nodes and edges, are transformed into their corre-
sponding spatial and temporal embeddings. They are,
then, input into a BiGRU model to obtain an over-
all embedding for each route. These route embed-
dings as well as the contextual data (such as time du-
ration, meteorological conditions, safety and comfort
level) are fed into a neural network model designed
to predict various route-related metrics as illustrated
in Figure 5. This neural network, depicted as a fully
connected layer in the diagram, takes the input em-
beddings and processes them through several hidden
layers, resulting in a set of predictions related to the
routes. The output of the model consists of several
key metrics related to the routes. These include:
- Route Distance: The predicted distance for the
route.
- Travel Duration: The estimated time required to
travel along the route.
- CO2 Emission: An estimate of the carbon diox-
ide emissions for the route, based on the trans-
portation mode and other factors.
- Comfort Safety: A metric that evaluates the com-
fort and safety of the route.
- Mode Distribution: The distribution of trans-
portation modes used in the route.
- Mode Consistency: A measure of how con-
sistently the same transportation mode is used
throughout the route.
- Route Label Type: A classification of the route,
such as whether it is a high-speed or scenic route.
This route prediction model described in Figure 1
enables the system to predict multiple key attributes
of a route based on the node and edge embeddings.
By considering both spatial and temporal features,
the model is able to provide accurate and compre-
hensive predictions that are useful for various appli-
cations such as route optimization, environmental im-
pact assessment, and safety evaluations.
2.5 Recommendation System
The route recommendation system utilizes the pre-
dicted parameters of the routes from the historical
dataset to rank and suggest the best itinerary for pas-
sengers traveling from a given starting point. This
recommendation is based on a weighted linear func-
tion that prioritizes CO2 emissions, safety, and dis-
tance. While other parameters such as travel dura-
tion, mode distribution, mode consistency, and route
type are primarily used for training the models within
our framework, they can be integrated into the multi-
objective function if necessary. The function is de-
fined as follows:
f (e, s, d) = α · e + β · s + γ · d (1)
Here, e, s, and d represent the predicted values for
CO2 emissions, safety, and distance of a given route,
respectively. The coefficients α, β, and γ are set to 0.5,
0.3, and 0.2, respectively, to assign greater importance
to CO2 emissions, aligning with the primary goal of
this study to promote low-carbon itineraries.
The recommendation system integrates multiple
factors, including route characteristics, environmen-
tal context, and user preferences, to provide person-
alized route suggestions. This ensures that the rec-
ommended routes reflect both objective metrics (e.g.,
distance) and subjective preferences (e.g., safety and
emission reduction). The proposed multimodal route
recommendation system offers passengers a compre-
hensive framework for making well-informed deci-
sions.
3 RESULTS
This section presents the results of training our mul-
timodal route recommendation model, tested in the
city of Strasbourg, France. The model aims to rec-
ommend optimal multimodal itineraries for students
commuting to their campus while minimizing CO2
emissions. We trained the model using historical data,
which includes four potential paths from each node in
Graph-Based Learning for Multimodal Route Recommendation
317
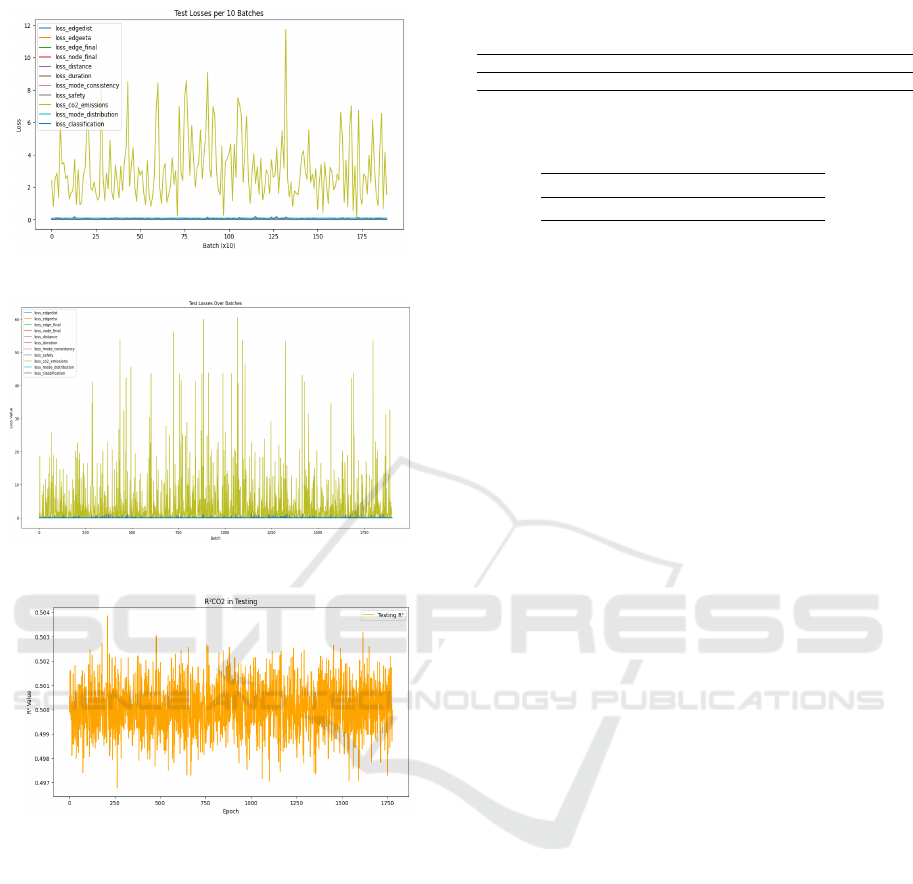
Figure 6: Loss with attention mechanism in test dataset.
Figure 7: Loss without attention mechanism in test dataset.
Figure 8: R2 CO2 in test dataset.
the network to the campus in Strasbourg. The input to
our multimodal route prediction model consists of a
combination of route embeddings (based on node and
edge embeddings) along with relevant contextual in-
formation. The model’s output includes several route-
related metrics as outlined in subsection 2.4. The
multi-task model performs regression predictions for
metrics such as distance, travel duration, CO2 emis-
sions, comfort, safety, mode distribution, and mode
consistency, as well as a classification prediction for
the route type label. The model’s optimization param-
eters are detailed in Table 1.
Figure 6 presents the loss function trends for the
various prediction metrics. Initially, the attention
mechanism is employed to help the model focus on
the most relevant parts of the node and edge se-
Table 1: Optimization parameters utilized in the frame-
work’s models.
Learning Rate Batch Size Weight Decay Gradient Clipping
0.001 4 0.0001 5
Table 2: Performance results of the classification task after
450 epochs.
Accuracy Recall Precision
0.9 0.75 0.79
quences during route embedding. The CO2 emis-
sions loss curve is the most prominent, fluctuating
significantly throughout training, with values ranging
from 0 to 12. These fluctuations indicate varying per-
formance across batches, suggesting that CO2 emis-
sions prediction remains challenging for the model
and may require further tuning to improve stability
in this area. In contrast, other loss components show
much lower values, remaining near zero throughout
the test batches. This minimal variation suggests that
the model has effectively learned these aspects, with
little contribution to the overall error. In Figure 7,
the same losses are plotted without using the atten-
tion mechanism. Here, the CO2 emissions loss curve
shows pronounced instability, with values reaching
as high as 60 and significant spikes across the en-
tire batch range. This high variability highlights the
model’s instability without the attention mechanism,
likely due to the model’s reduced ability to consis-
tently focus on the most relevant features. This under-
lines the importance of incorporating attention mech-
anisms into the proposed framework to stabilize and
enhance model performance, particularly for tasks
that demand emphasis on specific features or relation-
ships within the data.
Table 2 reports the accuracy, recall, and precision
for the classification task after 450 epochs. The clas-
sification accuracy is around 0.9, indicating that the
model is highly effective in making correct predic-
tions. Precision and recall also show high values,
demonstrating strong performance in the classifica-
tion task. For the regression tasks, the R² values are
computed across all metrics. An example of CO2
emissions is shown in Figure 8. The testing R
2
fluc-
tuates around 0.5 without a clear upward or down-
ward trend, suggesting that the model’s performance
on unseen data remains relatively consistent. Similar
behavior is observed for the other metrics. These fluc-
tuations indicate some instability in the predictions,
implying that while the model generalizes to the test
data, further refinement is necessary to improve sta-
bility and reduce variance during testing.
After training, we also tested our recommenda-
tion system based on Equation 1. The system con-
IoTBDS 2025 - 10th International Conference on Internet of Things, Big Data and Security
318

Table 3: Recommendation Results. The ranking of four itineraries when the starting point is the stop at node 51 and the
destination is the Strasbourg campus located at node 44.
Ranks
CO2
(gram/km)
Safety
Distance
(km)
Score
Duration
(min)
Mode Distribution Context
1 9.67 0.67 0.79 5.29 1.99 walk Snow, Morning
2 15.45 0.24 0.72 8.04 7.25 Bus, walk Snow, Morning
3 16.4 0.21 0.84 9.5 8.01 Bus Snow, Morning
5 16.7 0.21 0.87 9.87 8.9 Bus Snow, Morning
siders multiple factors when making route recom-
mendations, including CO2 emissions, user safety,
and distance. These parameters are integrated into
the ranking algorithm to ensure that suggested routes
not only optimize efficiency but also prioritize en-
vironmentally friendly options and user well-being.
This holistic approach allows users to make informed
choices based on their preferences for sustainability
and safety. The recommendation system results are
presented in Table 3, where weights of 0.5, 0.3, and
0.2 were assigned to CO2 emissions, safety, and dis-
tance, respectively. The results reveal that distance is
not the primary criterion for selecting the top-ranked
route; instead, CO2 emissions and safety factors are
more heavily weighted. This outcome underscores
the emphasis on environmental impact and user safety
in the recommended routes.
4 CONCLUSION
This paper presents a novel approach to multimodal
route recommendation that utilizes advanced graph-
based learning techniques, specifically GRU and
GCN models, to improve the effectiveness and rele-
vance of route suggestions in urban environments. By
modeling the transport network as a complex graph
and incorporating essential contextual factors such as
weather, safety, and passenger comfort, our method-
ology captures intricate spatial and temporal patterns
often overlooked by traditional systems. The pro-
posed recommendation system is grounded in a multi-
task model that predicts key urban metrics, includ-
ing route distance, travel duration, CO2 emissions,
comfort, safety, mode distribution, mode consistency,
and route type. Experimental results demonstrate
high classification accuracy, highlighting the model’s
strong performance in predicting route types. These
predicted factors are integrated into our system to
ensure the suggested routes prioritize environmental
sustainability and user well-being. The ranked routes
show that CO2 emissions and safety take precedence
over distance, aligning with our objective of promot-
ing eco-friendly transportation choices. Our work
contributes to the growing body of knowledge on in-
telligent transportation systems and provides a robust
framework for future research in this domain. Future
perspectives will focus on enhancing the model’s per-
formance by exploring additional graph properties.
REFERENCES
Candra, A., Budiman, M. A., and Hartanto, K. (2020). Di-
jkstra’s and a-star in finding the shortest path: A tuto-
rial. In 2020 International Conference on Data Sci-
ence, Artificial Intelligence, and Business Analytics
(DATABIA), pages 28–32. IEEE.
Chen, L., Zhang, L., Cao, S., Wu, Z., and Cao, J. (2020).
Personalized itinerary recommendation: Deep and
collaborative learning with textual information. Ex-
pert Systems with Applications, 144:113070.
da Silva, E. S., Pedrini, H., and dos Santos, A. L. (2023).
Applying graph neural networks to support decision
making on collective intelligent transportation sys-
tems. IEEE Transactions on Network and Service
Management, 20(4):4085–4096.
Ding, R., Ujang, N., Hamid, H. B., Manan, M. S. A., Li,
R., Albadareen, S. S. M., Nochian, A., and Wu, J.
(2019). Application of complex networks theory in
urban traffic network researches. Networks and Spa-
tial Economics, 19:1281–1317.
Geisberger, R., Sanders, P., Schultes, D., and Vetter, C.
(2012). Exact routing in large road networks us-
ing contraction hierarchies. Transportation Science,
46(3):388–404.
Ghalmane, Z., Brahmia, M.-E.-A., Zghal, M., and Cher-
ifi, H. (2022). A stochastic approach for extracting
community-based backbones. In International Con-
ference on Complex Networks and Their Applications,
pages 55–67. Springer.
Ghalmane, Z., Cherifi, C., Cherifi, H., and El Hassouni, M.
(2020). Exploring hubs and overlapping nodes inter-
actions in modular complex networks. IEEE Access,
8:79650–79683.
Ghalmane, Z., Cherifi, C., Cherifi, H., and El Hassouni,
M. (2021). Extracting modular-based backbones in
weighted networks. Information Sciences, 576:454–
474.
Ghalmane, Z., Cherifi, C., Cherifi, H., and Hassouni,
M. E. (2019). Centrality in complex networks with
overlapping community structure. Scientific reports,
9(1):10133.
Graph-Based Learning for Multimodal Route Recommendation
319

Ghalmane, Z., El Hassouni, M., Cherifi, C., and Cher-
ifi, H. (2018a). K-truss decomposition for modular
centrality. In 2018 9th International Symposium on
Signal, Image, Video and Communications (ISIVC),
pages 241–248. IEEE.
Ghalmane, Z., El Hassouni, M., and Cherifi, H. (2018b).
Betweenness centrality for networks with non-
overlapping community structure. In 2018 IEEE
workshop on complexity in engineering (COMPENG),
pages 1–5. IEEE.
GHALMANE, Z., Zghal, M., et al. (2023). Road networks:
A new filtering approach to extract backbones using
community structure.
Hamilton, W., Ying, Z., and Leskovec, J. (2017). Inductive
representation learning on large graphs. Advances in
neural information processing systems, 30.
Hopman, D., Koole, G., and Mei, R. V. D. (2021). A
machine learning approach to itinerary-level booking
prediction in competitive airline markets. Interna-
tional Journal of Revenue Management, 12(3-4):153–
191.
Iqbal, M., Zhang, K., Iqbal, S., and Tariq, I. (2018). A fast
and reliable dijkstra algorithm for online shortest path.
Int. J. Comput. Sci. Eng, 5(12):24–27.
Jana, D., Malama, S., Narasimhan, S., and Taciroglu, E.
(2023). Edge ranking of graphs in transportation net-
works using a graph neural network (gnn). arXiv
preprint arXiv:2303.17485.
Jiang, W. and Luo, J. (2022). Graph neural network for
traffic forecasting: A survey. Expert systems with ap-
plications, 207:117921.
Kipf, T. N. and Welling, M. (2016). Semi-supervised clas-
sification with graph convolutional networks. arXiv
preprint arXiv:1609.02907.
Latora, V., Nicosia, V., and Russo, G. (2017). Complex net-
works: principles, methods and applications. Cam-
bridge University Press.
Liu, H., Tong, Y., Zhang, P., Lu, X., Duan, J., and Xiong,
H. (2019). Hydra: A personalized and context-aware
multi-modal transportation recommendation system.
In Proceedings of the 25th ACM SIGKDD Interna-
tional Conference on Knowledge Discovery & Data
Mining, pages 2314–2324.
Liu, S. and Jiang, H. (2022). Personalized route recommen-
dation for ride-hailing with deep inverse reinforce-
ment learning and real-time traffic conditions. Trans-
portation Research Part E: Logistics and Transporta-
tion Review, 164:102780.
MOEZZI, R. Enhanced vehicle arrival time prediction with
graph neural networks (gnn) using gps data.
Shafique, S. and Ali, M. E. (2016). Recommending most
popular travel path within a region of interest from
historical trajectory data. In Proceedings of the 5th
ACM SIGSPATIAL International Workshop on Mobile
Geographic Information Systems, pages 2–11.
Shanmukhappa, T., Ho, I. W.-H., Chi, K. T., and Leung,
K. K. (2019). Recent development in public transport
network analysis from the complex network perspec-
tive. IEEE Circuits and Systems Magazine, 19(4):39–
65.
Sharma, A., Sharma, A., Nikashina, P., Gavrilenko, V., Tse-
lykh, A., Bozhenyuk, A., Masud, M., and Meshref, H.
(2023). A graph neural network (gnn)-based approach
for real-time estimation of traffic speed in sustainable
smart cities. Sustainability, 15(15):11893.
Song, C., Guan, W., and Ma, J. (2018). Potential travel
cost saving in urban public-transport networks using
smartphone guidance. Plos one, 13(5):e0197181.
Termos, M., Ghalmane, Z., Fadlallah, A., Jaber, A.,
Zghal, M., et al. (2023). Intrusion detection system
for iot based on complex networks and machine
learning. In 2023 IEEE Intl Conf on Depend-
able, Autonomic and Secure Computing, Intl Conf
on Pervasive Intelligence and Computing, Intl
Conf on Cloud and Big Data Computing, Intl
Conf on Cyber Science and Technology Congress
(DASC/PiCom/CBDCom/CyberSciTech), pages
0471–0477. IEEE.
Termos, M., Ghalmane, Z., Fadlallah, A., Jaber, A., Zghal,
M., et al. (2024). Gdlc: A new graph deep learn-
ing framework based on centrality measures for in-
trusion detection in iot networks. Internet of Things,
26:101214.
Wang, Y., Yin, H., Chen, H., Wo, T., Xu, J., and Zheng, K.
(2019). Origin-destination matrix prediction via graph
convolution: a new perspective of passenger demand
modeling. In Proceedings of the 25th ACM SIGKDD
international conference on knowledge discovery &
data mining, pages 1227–1235.
Wei, L.-Y., Zheng, Y., and Peng, W.-C. (2012). Con-
structing popular routes from uncertain trajectories. In
Proceedings of the 18th ACM SIGKDD international
conference on Knowledge discovery and data mining,
pages 195–203.
Yu, Y., Si, X., Hu, C., and Zhang, J. (2019). A review of
recurrent neural networks: Lstm cells and network ar-
chitectures. Neural computation, 31(7):1235–1270.
Yuan, J., Zheng, Y., Zhang, C., Xie, W., Xie, X., Sun, G.,
and Huang, Y. (2010). T-drive: driving directions
based on taxi trajectories. In Proceedings of the 18th
SIGSPATIAL International conference on advances in
geographic information systems, pages 99–108.
Zanin, M. and Lillo, F. (2013). Modelling the air transport
with complex networks: A short review. The Euro-
pean Physical Journal Special Topics, 215(1):5–21.
Zhang, S., Tong, H., Xu, J., and Maciejewski, R. (2019).
Graph convolutional networks: a comprehensive re-
view. Computational Social Networks, 6(1):1–23.
IoTBDS 2025 - 10th International Conference on Internet of Things, Big Data and Security
320
