
Interference-Based Reliability and Capacity Analysis for IEEE 802.11
Broadcast Ad-Hoc Networks on the Highway
Zhijuan Li
1,2 a
, Xintong Wu
1
, Xiaokun Li
1,2,3 b
and Xiaomin Ma
4
1
Department of Computer and Big Data, Heilongjiang University, Harbin 150080, China
2
Postdoctoral Program of Heilongjiang Hengxun Technology Co., Ltd. Harbin 150090, China
3
School of Computer Science and Technology, Harbin Institute of Technology, Harbin 150001, China
4
College of Science and Engineering, Oral Roberts University, Tulsa, OK 74171, U.S.A.
lizhijuan@hrbeu.edu.cn, {wuxintong, lixiaokun}@hlju.edu.cn, xma@oru.edu
Keywords:
Vehicular Ad-Hoc Network, CSMA, SINR, Reliability, Capacity.
Abstract:
Interference is a critical factor that degrades wireless network performance. In IEEE 802.11 wireless broad-
cast networks, hidden terminals and concurrent transmissions are the primary sources of interference due to
the carrier sense multiple access (CSMA) mechanism. Therefore, analyzing the signal-to-interference-plus-
noise ratio (SINR) distribution is essential for evaluating network performance, whose derivation relates to
the transmission probabilities of hidden terminals and concurrent transmissions. In this study, we utilize the
existing semi-markov process (SMP) model to calculate these transmission probabilities. Subsequently, we
employ the Laplace transform to analyze the SINR distribution in IEEE 802.11 broadcast ad-hoc networks
on highways. Based on the derived SINR distribution, we further evaluate the reliability and capacity. This
approach can be readily extended to two-dimensional (2D) or three-dimensional (3D) scenarios by employ-
ing d-dimensional (1 ≤ d ≤ 3, dD) point process. Experimental results demonstrate that the proposed model
achieves high accuracy under small to medium interference ranges. Additionally, the analysis remains highly
accurate for receivers within 70 meters, even in scenarios with large interference ranges.
1 INTRODUCTION
Vehicular ad-hoc Networks (VANETs), based on
IEEE 802.11p/bd, deliver broadcast services for
safety-related applications with strict quality of ser-
vice (QoS) requirements. IEEE 802.11p/bd defines
physical and Medium Access Control (MAC) layer
specifications, with 802.11bd enhancing physical
layer performance as 802.11p’s successor. The MAC
layer employs the distributed coordination function
(DCF), which relies on CSMA for collision avoid-
ance. However, vehicle-to-vehicle (V2V) commu-
nication using CSMA suffers from hidden terminal
and concurrent collision problems, degrading chan-
nel quality and causing packet loss (Yin et al., 2013).
Performance evaluation is thus vital for network plan-
ning and optimization (Luong et al., 2017; Li et al.,
2020). Common reliability metrics include Node-to-
Node Packet Reception Probability (PRP) and Packet
Reception Ratio (PRR), which measure the probabil-
a
https://orcid.org/0000-0002-2162-5654
b
https://orcid.org/0000-0002-6645-6890
ity that a packet is received successfully from differ-
ent aspects (Ma et al., 2012).
Researchers have built many analytical models
to derive reliability metrics of V2V communication.
Some models adopted a deterministic distance-based
method, and other models adopted the SINR-based
method. In models using deterministic distance-based
methods, a packet is considered lost if a collision hap-
pens during the transmission of the packet (Li et al.,
2022). The size of the geometric region that may
cause packet collision, such as length, area, volume,
etc. needs to be calculated (Zhao et al., 2020). In
SINR-based models, a packet transmission is consid-
ered successfully received as long as the SINR ex-
ceeds the threshold throughout the packet’s transmis-
sion, even if a collision occurs, reflecting real-world
conditions more accurately. Thus, SINR-based model
is developed as a more general and accurate model
for analyzing the performance of wireless broadcast
network compared to the deterministic distance-based
model (Li et al., 2022). The critical step in the SINR-
based method is deriving the distribution of SINR,
namely probability density function (PDF) and cumu-
520
Li, Z., Wu, X., Li, X. and Ma, X.
Interference-Based Reliability and Capacity Analysis for IEEE 802.11 Broadcast Ad-Hoc Networks on the Highway.
DOI: 10.5220/0013356400003941
Paper published under CC license (CC BY-NC-ND 4.0)
In Proceedings of the 11th International Conference on Vehicle Technology and Intelligent Transport Systems (VEHITS 2025), pages 520-528
ISBN: 978-989-758-745-0; ISSN: 2184-495X
Proceedings Copyright © 2025 by SCITEPRESS – Science and Technology Publications, Lda.

lative distribution function (CDF) of the SINR at the
receiver (Zhao et al., 2021a; Ma and Trivedi, 2021).
Stochastic geometry is a powerful tool for an-
alyzing the distribution of SINR. The application
of stochastic geometric analysis hinges on calcu-
lating the transmission probability of a node under
the CSMA mechanism. Most stochastic geometry-
based analytical models for evaluating wireless net-
work performance under CSMA use ALOHA as an
approximation. This approach has been applied to
one-dimensional (1D) VANETs (Błaszczyszyn et al.,
2013), intersection VANET (Ni et al., 2015a; Stein-
metz et al., 2015; Belmekki et al., 2020; Kimura and
Saito, 2022), and general urban road VANET (Kimura
et al., 2016). Recently, Kimura et al. (Kimura
and Saito, 2022) proposed a broadcast rate optimiza-
tion scheme for intersections using this approach, di-
viding roads into queuing and running segments to
provide closed-form approximations for key perfor-
mance metrics.
Meanwhile, other stochastic geometry-based
models directly analyze CSMA behavior to evaluate
SINR distribution and network performance. For ex-
ample, Nguyen et al. (Nguyen et al., 2007) mod-
eled CSMA using a Mat
´
ern-II-continuous process, as-
signing nodes uniformly distributed backoff counters
in [0,1]. Tong et al. (Tong et al., 2016) improved
this by developing a Mat
´
ern-II-discrete process to
better capture discrete backoff counters and analyze
packet transmission success probability in a highway
VANETs. They utilized simulation methods to esti-
mate node transmission probabilities. Unlike previ-
ous studies that approximated CSMA with ALOHA,
their work directly models the CSMA mechanism,
providing valuable insights that have inspired our re-
search.
Considering that the SMP model (Yin et al., 2013)
characterized the CSMA behavior, the steady-state
transmission probability of a node can be calculated.
Then the transmission probabilities of hidden termi-
nals and concurrent transmissions during the trans-
mission of the tagged sender can be obtained by
the SMP model. On the basis of the SMP model,
the probability derivation-based method, the effec-
tive interference distance-based method are two other
mathematical methods to analyze the SINR distribu-
tion of V2V communication in IEEE 802.11 VANET.
Zhao et al. (Zhao et al., 2021a) built the probability
derivation-based method to analyze the performance
of VANET at 1D highway by adopting order statistics
and non-homogeneous poisson point process (NHPP)
distribution and extended the approach to analyze the
case of 2D intersections. However, the probability
derivation method has high computational complex-
ity and requires parallel computing to solve the SINR
distribution, which increases the difficulty of imple-
mentation and requires a server with parallel comput-
ing power (Zhao et al., 2021a; Zhao et al., 2021b).
In recent years, Ma et al. (Ma et al., 2021; Ma
and Trivedi, 2021) introduced an efficient interference
distance-based method to evaluate reliability metrics
such as PRP and PRR by calculating the effective in-
terference range related to the SINR threshold. Build-
ing on this, Li et al. (Li et al., 2022) refined the model
by incorporating a maximum interference range con-
straint and extended it to analyze the case of 2D in-
tersection VANETs, proposing the SINR-related Ef-
fective Distance Constrained by Maximum interfer-
ence range (SED-CM) model. This model assumes
that reception fails if interference occurs within the
effective interference range, consistent with determin-
istic distance-based principles. This approach allows
for rapid computation of PRP and PRR by bypassing
complex integrals. However, determining link capac-
ity requires numerous time-consuming interpolations,
and extending the model to higher dimensions is chal-
lenging due to the complexity of computing geomet-
ric region sizes (Zhao et al., 2020).
In this paper, we propose applying stochastic ge-
ometry methods and the SMP model to compute
the SINR distribution. Specifically, we employ the
Laplace transform to analyze the SINR distribution,
accounting for the effects of hidden terminals and
concurrent transmissions. Based on the derived SINR
distribution, we further calculate reliability metrics
and network capacity. The contributions of the paper
are as follows.
1) Firstly, we adopt the stochastic geometry method
to derive the SINR distribution at the receiver
in V2V communication with CSMA mechanism.
We evaluate the interference probability of other
nodes by the SMP model which captures the full
CSMA behavior.
2) Secondly, based on the obtained SINR distribu-
tion, we further derive the reliability metrics PRP,
PRR, and link capacity.
3) Thirdly, we conduct a series of experiments to val-
idate the model with NS2 simulation.
The rest of the paper is organized as follows. Sec-
tion 2 describes the system model, including the com-
munication scenario and interference model. Section
3 gives the analysis of SINR distribution conditioned
on the receiving distance. Section 4 presents the re-
liability metrics PRP, PRR as well as link capacity.
Section 5 describes the experimental process and re-
sults. Section 6 concludes the paper.
Interference-Based Reliability and Capacity Analysis for IEEE 802.11 Broadcast Ad-Hoc Networks on the Highway
521

T
R
I
1
I
2
I
3
I
4
Area RCArea LCArea LH Area RH
1
st
,2
nd
,3
rd
,…,k
th
,… 1
st
,2
nd
,3
rd
,…,l
th
,…
𝐼
4
𝐼
2
d
𝐼
1
𝐼
3
d
r
I
Figure 1: General interfering scenario of IEEE 802.11
broadcast ad-hoc networks on the highway.
2 SYSTEM MODEL
In the paper, we consider V2V communication in a
highway scenario. As shown in Fig. 1, the high-
way scenario is abstracted to a 1D line. The num-
ber of nodes follows the 1D homogeneous poisson
point process (HPPP) with the density β (vehs/m).
Vehicles periodically broadcast/receive Basic Safety
Messages (BSMs) to/from nearby vehicles. T is the
tagged sender, R is the tagged receiver. d
S
is the dis-
tance from the sender T to the receiver R. r
E
presents
the carrier sensing range. r
I
is the interference range.
We assume signal propagation suffers from Rayleigh
fading. In this way, the receiving power P
r
at a dis-
tance d from the sender is:
P
r
(d) = P
t
ηd
−α
h (1)
where P
t
is the transmission power, η = Kd
α
0
, K is a
constant determined by the device, α is the path loss
exponent, d
0
is the reference distance, and h is a ran-
dom variable following the exponential distribution
with a mean of one. The sensing range can be com-
puted by r
E
= d
0
α
p
P
t
K/P
th
, P
th
is the carrier sensing
threshold.
During the transmission of T ’s packet, R can also
receive signals sent from other nodes except T , reduc-
ing the SINR of T ’s transmission. The expression of
SINR is:
SINR =
P
r
I
∑
+ N
0
=
P
t
ηd
−α
S
h
I
∑
+ N
0
(2)
where N
0
is the power of noise, I
∑
is the total interfer-
ence power.
Under the effect of CSMA, the interferers are clas-
sified into two classes: concurrent transmissions and
hidden terminal (Yin et al., 2013). The hidden ter-
minal area is beyond the sensing range of the tagged
sender and within the interference range. The con-
current transmission area is within the sensing range
of the tagged sender. Then, we split four interference
areas for the receiver R: Left Hidden (LH) terminal
area, Left Concurrent (LC) transmission area, Right
Concurrent (RC) transmission area, and Right Hid-
den (RH) terminal area, as shown in Fig. 1. The
tagged sender T is the origin. Area LH is within the
range of [−r
I
+ d
S
,−r
E
], area LC is within the range
of [−r
E
,d
S
], area RC is within the range of [d
S
,r
E
],
and area RH is within the range of [r
E
,r
I
+ d
S
].
I
1
(I
4
) represents the interference node in area
LH(RH). Assuming that there are l(l
′
) nodes in area
LH(RH), d
I
1
(I
1
= 1, ··· ,l)(d
I
4
(I
4
= 1, ··· ,l
′
)) denote
the distance between the receiver R and the I
1
(I
4
)-th
node within area LH(RH). We have d
S
+r
E
≤ d
I
1
≤ r
I
,
r
E
− d
S
≤ d
I
4
≤ r
I
.
In the same way, I
2
(I
3
) represents the interference
node in area LC(RC). Assuming that there are k nodes
in area LC, d
I
2
(I
2
= 1,··· ,k)(d
I
3
(I
3
= 1,··· ,k
′
))
denote the distance between the receiver R and the
I
2
(I
3
)-th node with area LC(RC). We have 0 ≤ d
I
2
≤
d
S
+ r
E
and 0 ≤ d
I
3
≤ r
E
− d
S
.
Furthermore, the proportion of nodes in differ-
ent interference regions contributing to aggregate in-
terference is denoted as: g
X
(X ∈ [LH, LC,RC,RH]).
The expression of g
X
is as follows.
g
X
=
π
0
X ∈ [LC,RC]
p
t
X ∈ [LH,RH]
(3)
where p
t
presents the hidden terminal transmission
probability during the vulnerable period. and π
0
rep-
resents the probability that a neighbor starts to trans-
mit a packet at the beginning of the same time slot
with the tagged vehicle. We calculate p
t
and π
0
by solving the steady-state probability π
XMT
that the
node is in the transmitting state in the SMP model
(Yin et al., 2013).
3 SINR CONDITIONAL
DISTRIBUTION ANALYSIS
In the section, we derive the CDF and PDF of SINR
at the receiver by utilizing the Laplace transform of
overall interference at the receiver.
3.1 The CDF and PDF of SINR at the
Receiver
As shown in Fig. 1, T is the tagged sender, R is the
receiver. d
S
is the distance between T and R. Accord-
ing to the definition of SINR in (2), the CDF of SINR
conditioned on receiving distance d
S
is:
F
SINR
(x|d
S
) = P(SINR ≤ x|d
S
)
= 1 − P(SINR > x|d
S
)
= 1 − P
P
t
ηhd
−α
S
I
LH
+ I
LC
+ I
RC
+ L
RH
+ N
0
> x
(4)
VEHITS 2025 - 11th International Conference on Vehicle Technology and Intelligent Transport Systems
522

and the PDF of SINR conditioned on receiving dis-
tance d
S
is:
f
SINR
(x|d
S
) =
dF
SINR
(x|d
S
)
dx
(5)
In (4), N
0
is the noise power. I
LH
(I
LC
,I
RC
,I
RH
)
represent the accumulated interference from area LH
(LC,RC,RH) on the receiver, which are given by
I
LH
=
∑
I
1
∈Φ
LH
P
t
ηd
I
1
h
I
1
; I
LC
=
∑
I
2
∈Φ
LC
P
t
ηd
I
2
h
I
2
(6)
I
RC
=
∑
I
3
∈Φ
RC
P
t
ηd
I
3
h
I
3
; I
RH
=
∑
I
4
∈Φ
RH
P
t
ηd
I
4
h
I
4
(7)
In this way, we can rewrite (4) as
F
SINR
(x|d
S
) =
1 − E
I
LH
,I
LC
,I
RC
,I
RH
Pr
h >
xd
α
S
P
t
η
(I
LH
+ I
LC
+ I
RC
+I
RH
+ N
0
)
(8)
Due to Rayleigh fading, h ∼ exp(1), let ∆ = xd
α
S
,
we get
F
SINR
(x|d
S
) = 1 − exp
−
∆
P
t
η
N
0
× E
I
LH
,I
LC
,I
RC
,I
RH
exp
−
∆
P
t
η
P
t
ηI
LH
exp
−
∆
P
t
η
I
LC
exp
−
∆
P
t
η
I
RC
exp
−
∆
P
t
η
I
RH
(9)
and using the independence of hidden terminal and
concurrent transmission, we finally have that
F
SINR
(x|d
S
) = 1 − exp
−
∆
P
t
η
N
0
L
I
LH
∆
P
t
η
L
I
LC
∆
P
t
η
L
I
RC
∆
P
t
η
L
I
RH
∆
P
t
η
(10)
where L
I
X
(
∆
P
t
η
) is the Laplace transform of I
X
, which
can be interpreted as follows: the Laplace transform
of I
LH
is the reduction in the probability that SINR is
greater than a given threshold due to interference from
area LH; the Laplace transform of I
LC
is the reduction
in the probability that SINR is greater than a given
threshold due to interference area LC; the Laplace
transform of I
RC
is the reduction in the probability
that SINR is greater than a given threshold due to in-
terference area RC; the Laplace transform of I
RH
is
the reduction in the probability that SINR is greater
than a given threshold due to interference area RH;
and exp
−
∆
P
t
η
N
0
can be regarded as a case without
interference.
We are now ready to determine expressions for
L
I
LC
(
∆
P
t
η
), L
I
RC
(
∆
P
t
η
), L
I
LH
(
∆
P
t
η
), and L
I
RH
(
∆
P
t
η
). We
derive L
I
LC
(
∆
P
t
η
), L
I
RC
(
∆
P
t
η
) by considering the effect
of interference from concurrent transmissions. Sim-
ilarly, we derive L
I
LH
(
∆
P
t
η
), L
I
RH
(
∆
P
t
η
) by considering
the effect of interference from hidden terminals.
3.2 Effect of Interference from
Concurrent Transmissions
1) First, considering the probability of concurrent
transmissions, the Laplace transform of the aggregate
interference originating from area LC is given by
L
I
LC
(
∆
P
t
η
) = E
exp(−
∆
P
t
η
I
LC
)
= E
∏
I
2
∈Φ
LC
exp
−
∆
P
t
η
P
t
ηd
−α
I
2
h
I
2
!
(a)
= E
Φ
LC
∏
I
2
∈Φ
LC
E
h
(exp(−∆d
−α
I
2
h
I
2
))
!
(b)
= exp
−
Z
d
S
+r
E
0
E
h
h
1 − exp(−∆d
−α
I
2
h)
i
βdd
I
2
(c)
= exp
−βg
LC
d
S
+r
E
Z
0
1 − exp(−∆d
−α
I
2
h)
dd
I
2
= exp
−βπ
0
d
S
+r
E
Z
0
1 − exp(−∆d
−α
I
2
h)
dd
I
2
(11)
where (a) holds due to the independence of the fading
parameters, (b) uses the expression of the probabil-
ity generating functional (PGFL) for a PPP. (c) holds
conditional on h.
The integral on the right-hand side of (11) is cal-
culated as
Z
d
S
+r
E
0
1 − exp(−∆d
−α
I
2
h)
dd
I
2
(e)
=
Z
(d
S
+r
E
)
α
0
1 − exp
−∆hy
−1
δy
δ−1
dy
( f )
=
Z
∞
(d
S
+r
E
)
−α
(1 − exp(−∆hx))δx
−δ−1
dx
(g)
= (exp(−∆hx) − 1)x
−δ
∞
(d
S
+r
E
)
−α
+
Z
∞
(d
S
+r
E
)
−α
x
−δ
∆hexp(−∆hx)dx
= (1 − exp(−∆h(d
S
+ r
E
)
−α
))(d
S
+ r
E
)+
(∆h)
δ
Γ(1 − δ,(d
S
+ r
E
)
−α
)
(12)
Interference-Based Reliability and Capacity Analysis for IEEE 802.11 Broadcast Ad-Hoc Networks on the Highway
523

where (e) from the substitution y ← d
α
I
2
, δ
def
= 1/α, (f)
from x ← y
−1
, and (g) from the integration by parts.
Γ(a,b) =
R
∞
b
u
a−1
e
−u
du represents the upper incom-
plete Gamma function. With the expectation over h,
we obtain
L
I
LC
(
∆
P
t
η
) = exp
−βπ
0
(1 − exp(−∆E(h)(d
S
+ r
E
)
−α
))
(d
S
+ r
E
) + ∆
δ
E(h
δ
)Γ(1 − δ, (d
S
+ r
E
)
−α
i
(13)
where h is exponential, E(h
δ
) =
R
∞
0
z
δ
e
−z
dz = Γ(1 +
δ), and E(h) =
R
∞
0
ze
−z
dz = Γ(2). After a series of
derivations,
L
I
LC
(
∆
P
t
η
) = exp
−βπ
0
(1 − A
′
)(d
S
+ r
E
)+
∆
δ
Γ(1 + δ)Γ
1 − δ,(d
S
+ r
E
)
−α
i
(14)
where A
′
= exp(−∆Γ(2)(d
S
+ r
E
)
−α
).
Substituting ∆ = xd
α
S
yields the desired result:
L
I
LC
(
xd
α
S
P
t
η
) = exp (−βπ
0
[(1 − A)(d
S
+ r
E
)+
(xd
α
S
η)
δ
Γ(1 + δ)Γ
1 − δ,(d
S
+ r
E
)
−α
i
(15)
where A = exp(−xΓ(2)(
d
S
d
S
+r
E
)
−α
).
2) Similar to the derivation of L
I
LC
(
∆
P
t
η
), I
LC
in
(11) is replaced by I
RC
, I
2
is replaced by I
3
, the upper
limit of the integral is replaced by r
E
− d
S
. After a
series of derivations, we can obtain the Laplace trans-
form of the aggregate interference from area RC as
follows.
L
I
RC
(
xd
α
S
P
t
η
) = exp (−βπ
0
[(1 − B)(r
E
− d
S
)+
(xd
α
S
η)
δ
Γ(1 + δ)Γ
1 − δ,(r
E
− d
S
)
−α
i
(16)
where B = exp(−xΓ(2)(
d
S
r
E
−d
S
)
−α
).
3.3 Effect of Interference from Hidden
Terminal
1) Similar to the derivation of L
I
LC
(
∆
P
t
η
), I
LC
in (11) is
replaced by I
LH
, I
2
is replaced by I
1
, π
0
is replaced by
p
t
. The upper limit and lower limit of the integral are
replaced by r
I
and r
E
+d
S
, respectively. After a series
of derivations, we can obtain the Laplace transform of
the aggregate interference from area LH as follows.
L
I
LH
(
xd
α
S
P
t
η
) = exp (−βp
t
[(A − 1)(d
S
+ r
E
)−
(C − 1)r
I
+ (xd
α
S
η)
δ
Γ(1 + δ)[γ(1 − δ, (d
S
+ r
E
)
−α
)−
γ(1 − δ,r
−α
I
)]
(17)
where C = exp(−xΓ(2)(
d
S
r
I
)
−α
).
2) Similar to the derivation of L
I
LC
(
∆
P
t
η
), I
LC
in
(11) is replaced by I
RH
, I
2
is replaced by I
4
, π
0
is
replaced by p
t
. The upper limit and lower limit of
the integral are replaced by r
I
and r
E
− d
S
, respec-
tively. After a series of derivations, we can obtain the
Laplace transform of the aggregate interference from
area RH as follows.
L
I
RH
(
xd
α
S
P
t
η
) = exp
−βp
t
h
(B − 1)(d
S
+ r
E
)
d
−
(C − 1)r
d
I
+ (xd
α
S
η)
δ
Γ(1 + δ)[γ(1 − δ, (d
S
+ r
E
)
−α
)−
γ(1 − δ,r
−α
I
)]
(18)
where B is the same as in (16) and C is the same as in
(17).
4 RELIABILITY AND CAPACITY
ANALYSIS
Based on the above analysis of SINR distribution con-
ditioned on the receiving distance, we give the expres-
sions of reliability metrics PRP, PRR, and link capac-
ity.
4.1 PRP
PRP refers to the probability that a node within the
transmission range of the sender successfully receives
a packet. It equals the probability that the SINR of a
tagged receiver exceeds a threshold θ, i.e.,
PRP(d
S
) = P(SINR > θ|d
S
) = 1 − F
SINR
(θ|d
S
)
(19)
Then we obtain PRP by substituting θ for x in (10).
4.2 PRR
PRR is defined as the percentage of nodes that suc-
cessfully receive a packet from the tagged transmitter
among the neighbors. PRR could be expressed as a
function of PRP, as follows:
PRR(d
S
) =
R
d
S
0
βPRP(x)dx
βd
S
=
1
d
S
Z
d
S
0
PRP(x)dx
(20)
VEHITS 2025 - 11th International Conference on Vehicle Technology and Intelligent Transport Systems
524

4.3 Link Capacity
4.3.1 Unconditional SINR Distribution
The CDF and PDF of SINR unconditioned is:
f
SINR
(x) =
Z
r
E
0
f
SINR|d
S
(x) f
d
S
(t)dt
F
SINR
(x) =
Z
x
0
f
SINR
(t)dt
(21)
where f
d
S
(x) is the receiving distance distribution.
Next we derive f
d
S
(x) using an order statistic method
similar to the derivation process in (Zhao et al.,
2021a). The difference is that (Zhao et al., 2021a)
assumes that the vehicle position follows the NHPP
distribution, while this paper assumes that it follows
the HPP distribution.
4.3.2 Receiving Distance Distribution
d
S
is the distance between T and R. Independent ran-
dom variables 0 ≤ S
1
,S
2
,·,S
l
≤ r
E
denote unordered
distances between T and the nodes in the right sens-
ing region. The cumulative probability distribution
P(S
i
≤ r) is given by Theorem 6.2 in (Trivedi, 2008):
F
S
i
(r) = P(S
i
≤ r|N(s) = 1)
=
P[N(r) = 1, N(s) − N(r) = 0]
P[N(s) = 1]
=
r
r
E
,i = 1, ...,l.
(22)
Then the PDF of S
i
is:
f
S
i
(r) =
1
r
E
.0 ≤ r ≤ r
E
,i = 1, ··· ,l
(23)
Then according to Theorem 6.2 in (Trivedi, 2008),
d
S
i
(i = 1,...,l) are the order statistics of the random
variables S
i
(i = 1,...,l). Thus, the CDF and PDF of
distance d
S
i
(0 ≤ d
S
i
≤ r
E
) can be calculated as
F
d
S
i
(τ) = P(d
S
i
≤ τ) =
l
∑
j=i
l
j
F
j
S
i
(τ)[1 − F
S
i
(τ)]
l− j
,
f
d
S
i
(τ) =
dF
d
S
i
(τ)
dτ
, 0 ≤ τ ≤ r
E
.
(24)
The probability that there are l nodes in the right
sensing area is P[l,(0,r
E
)] =
(βr
E
)
l
e
−βr
E
l!
. Then, the to-
tal d
S
’s PDF can be expressed as
f
d
S
(x) =
∞
∑
l=1
P[l,(0,r
E
)]
l
∑
i=1
f
d
S
i
(x)p
i
, (25)
where p
i
is the probability that the receiver R is the
i-th node within the right sensing area, which is eval-
uated as p
i
= 1/l(i = 1,...,l). So, the d
S
’s PDF can
be solved as follows.
f
d
S
(x) =
∞
∑
l=1
P[l,(0,r
E
)]
l
∑
i=1
f
d
S
i
(x)
1
l
= f
S
i
(x) =
1
r
E
, 0 ≤ x ≤ r
E
(26)
4.3.3 Link Capacity
The distribution and expectation of the link capacity
are given in (Ni et al., 2015b). The CDF of the link
capacity is as follows.
F
C
(x) = P{W log
2
(1+SINR) < x} = F
SINR
2
x
W
− 1
(27)
where W is the bandwidth, c is the link capacity. The
PDF of the link capacity is
f
C
(x) =
ln2
W
· 2
x
W
−1
f
SINR
(2
x
W
−1
) (28)
5 EXPERIMENT
5.1 Experiment Settings
We use Matlab programs to compute the proposed an-
alytical model in which inputs are the communication
parameters and outputs are the CDF and PDF of SINR
as well as the reliability metrics: PRP, PRR, and link
capacity. Then we conduct a series of experiments to
compare the proposed model with NS2 simulation. In
the simulation, we deploy the nodes following HPPP
on a circular lane with a length of 10 km with a den-
sity of 0.1 vehs/m. The 10 km simulation scenario
is large enough to objectively evaluate the impact of
the interference. The other communication parame-
ters are set as follows: the data rate R
d
is 24 Mbps,
the carrier frequency f is 5.9 GHz, the channel band-
width is 10 MHz, the transmission power P
t
is 26
dBm, the carrier sensing threshold P
th
is -75 dBm, the
mean receiving distance R
0
where the average receiv-
ing power equals the sensing threshold is 500 m, the
power of noise N
0
is -99 dBm, the reference distance
d
0
is 1 m, the transmit gain and the receiver gain are
both 1.0, constant η is 1.64 × 10
−5
, the size of the
competition window W is 16, the path loss exponent
α is 2, the DIFS is 58 µs, the packet length is 200
Bytes, the slot time σ is 13 µs, the packet generation
rate λ is 10 Hz.
Interference-Based Reliability and Capacity Analysis for IEEE 802.11 Broadcast Ad-Hoc Networks on the Highway
525
-10 0 30 40
SINR(dB)
0
0.01
0.02
0.03
0.04
PDF
10
20
(a)
-10 0 10 20 30 40
SINR(dB)
0
0.2
0.4
0.6
0.8
1
CDF
(b)
Figure 2: PDF and CDF of SINR conditioned on the receiving distance d
S
while r
I
equals 500 m. (a) PDF. (b) CDF.
-10 0 10 20 30 40
SINR(dB)
0
0.005
0.01
0.015
0.02
0.025
0.03
PDF
(a)
-10 0 10 20 30 40
SINR(dB)
0
0.2
0.4
0.6
0.8
1
CDF
(b)
Figure 3: PDF and CDF of SINR conditioned on the receiving distance of 150 m with different interference range r
I
. (a) PDF.
(b) CDF.
5.2 Experiment Results
5.2.1 PDF and CDF of SINR
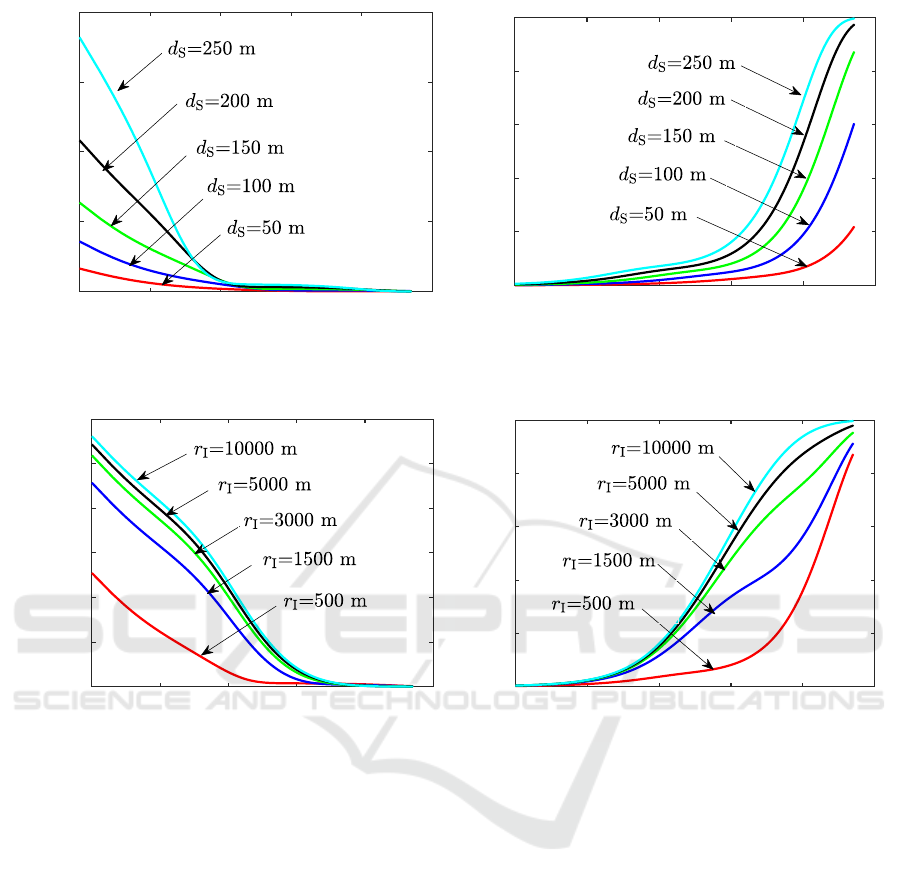
Fig. 2a and Fig. 2b present the PDF and CDF of
SINR within 37 dB when the receiving distance d
S
equals 50 m, 100 m, 150 m, 200 m, and 250 m, re-
spectively. The minimum interference power is equal
to the carrier sensing threshold. In this way, the inter-
ference range r
I
is equal to the sensing range, which
is equal to 500 m. We observe that a smaller receiving
distance d
S
corresponds to a larger mean of SINR, and
otherwise, a larger receiving distance d
S
corresponds
to a smaller average value of SINR. The reason be-
hind this phenomenon is that the smaller the receiv-
ing distance d
S
, the less power attenuation between
the sender and the receiver, resulting in larger receiv-
ing power and SINR.
Fig. 3a and Fig. 3b present the PDF and CDF
of SINR within 37 dB when the receiving distance d
S
equals 150 m, and the interference ranges r
I
are set
to be 500 m, 1500 m, 3000 m, 5000 m, and 10000
m, respectively. We witness that the greater the in-
terference range, the smaller the mean of SINR. This
is expected because more interference would reduce
the value of SINR when increasing the interference
range. At the same time, we carefully observe the gap
between different curves corresponding to r
I
and find
that the gap is getting smaller and smaller with the
increase in the interference range. The phenomenon
occurs connecting that the interference power is get-
ting smaller and smaller with the increase in the in-
terference distance due to the effect of the attenuation
and path loss of signal propagation. In this way, the
distribution of SINR would tend to be stable when the
VEHITS 2025 - 11th International Conference on Vehicle Technology and Intelligent Transport Systems
526
0 50 100 150 200 250 300
0
0.2
0.4
0.6
0.8
1
PRP
r
I
= 500 m
r
I
= 1000 m
r
I
= 1500 m
r
I
= 5000 m
SED-CM model
(a)
0 50 100 150 200 250 300
0.4
0.5
0.6
0.7
0.8
0.9
1
PRR
r
I
= 5000 m
r
I
= 1500 m
r
I
= 500 m
r
I
= 1000 m
SED-CM model
(b)
Figure 4: PRP and PRR comparisons between the proposed model, NS2 and the model in (Li et al., 2022), SINR threshold θ
= 25 dB. (a) PRPs. (b) PRRs.
interference range reaches a certain level.
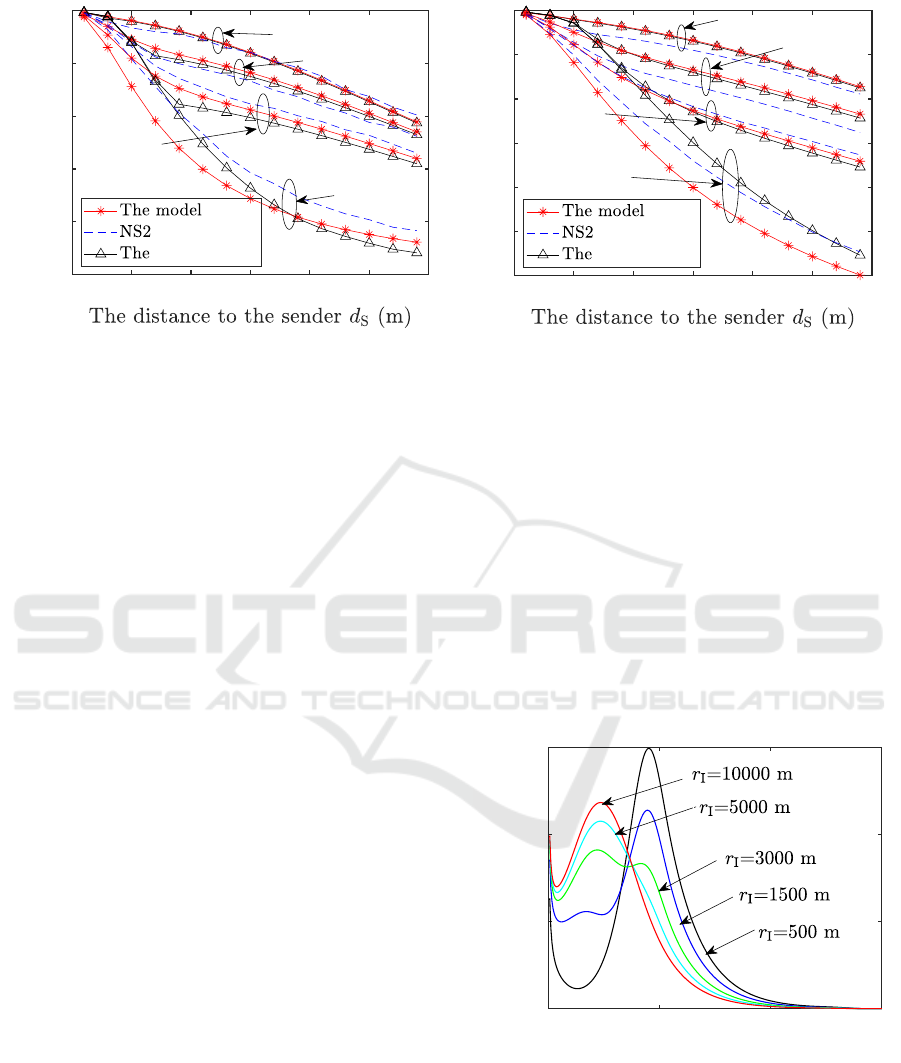
5.2.2 PRP and PRR Comparisons
We compute and compare the PRPs and PRRs of the
proposed model, NS2 simulation, and the SED-CM
model in (Li et al., 2022). PRPs and PRRs at 15 re-
ceiving distances are computed with d
S
equaling from
10 m to 290 m at an interval of 20 m. The compar-
ison results are shown in Fig. 4 when the density is
0.1 vehs/m, and the SINR threshold θ is equal to 25
dB (corresponding to 316 without dB unit). It can be
seen that PRPs and PRRs present decreasing trends
with the receiving distance increasing. Because the
greater the receiving distance, the smaller the value
of SINR, the more packets are lost. Furthermore, we
present the results under four interference ranges 500
m, 1000 m, 1500 m, and 5000 m. The results show
that the greater the interference range r
I
, the worse
the reliability.
Moreover, we find that PRPs and PRRs of the pro-
posed model are almost in line with the simulation
results and the SED-CM results when the interfer-
ence ranges are 500 m. When the interference ranges
are 1000 m and 1500 m, the results show a slight
difference in PRPs and PRRs between the proposed
model, the NS2 simulation, and the SED-CM model.
At the same time, it seems that the results obtained
by the proposed model are smoother than the SED-
CM model, and have little difference from those of
the SED-CM model.
When the interference range is set to 5000 m, the
simulation results appear more optimistic than those
evaluated by our model, with a larger gap observed
between the two. This discrepancy may arise from an
overestimation of the hidden terminal’s transmission
probability at greater distances, leading to an under-
estimation of successful transmissions. However, we
witness that the PRR of the proposed model is almost
the same as the NS2 simulation within 70 m, which is
the range of interest of emergency since closer inter-
ference dominates for close receivers.
Additionally, the SED-CM model applied to dD
IEEE 802.11 broadcast wireless networks requires
calculating the area or volume of irregular regions
(Zhao et al., 2020). In contrast, the model proposed
in this paper could be adapted to analyze dD scenes
by utilizing the dD point process. We plan to present
this work in the future.
0 100 200 300
Link capacity (Mbps)
0
0.005
0.01
0.015
PDF
Figure 5: PDF of link capacity.
5.2.3 Link Capacity
Fig. 5 presents the PDF of link capacity in different
interference ranges, 500 m, 1500 m, 3000 m, 5000 m,
and 10000 m, respectively. These curves present sim-
ilar changing trends. It could be seen that the mean of
Interference-Based Reliability and Capacity Analysis for IEEE 802.11 Broadcast Ad-Hoc Networks on the Highway
527

link capacity decreases with the increase in the inter-
ference range.
6 CONCLUSION
The proposed model in the paper uses the stochas-
tic geometry method to evaluate the distribution of
SINR, and then derives reliability metrics PRP, PRR,
and link capacity of 1D IEEE 802.11 broadcast ad-
hoc networks. The experiment results show that the
evaluation is accurate for small and medium-distance
interference ranges. At the same time, the evalu-
ation is also quite accurate in the closer receivers,
even if a larger interference range is assumed. This
model can be extended to evaluate the performance of
d (1 ≤ d ≤ 3)-dimensional (dD) IEEE 802.11 broad-
cast ad-hoc networks by utilizing a dD point pro-
cess. It is also adaptable to emerging 802.11 tech-
nologies, such as orthogonal frequency-division mul-
tiple access (OFDMA), multiple input multiple output
(MIMO), high-order quadrature amplitude modula-
tion (QAM) (1024 ∼ 4096), as well as high-frequency
and high-bandwidth applications. Future work will
focus on exploring these extensions in greater detail.
ACKNOWLEDGEMENTS
This work is supported by the Basic Scientific
Research Funds of Universities of Heilongjiang
Province (No. 2023-KYYWF-1485).
REFERENCES
Belmekki, B. E. Y., Hamza, A., and Escrig, B. (2020). On
the outage probability of vehicular communications
at intersections over nakagami-m fading channels. In
IEEE 91st VTC Spring, pages 1–5, Antwerp, Belgium.
Błaszczyszyn, B., M
¨
uhlethaler, P., and Toor, Y. (2013).
Stochastic analysis of aloha in vehicular ad hoc net-
works. Annals of telecommunications-Annales des
t
´
el
´
ecommunications, 68(1-2):95–106.
Kimura, T. and Saito, H. (2022). Theoretical broadcast
rate optimization for v2v communications at inter-
section. IEEE Transactions on Mobile Computing,
21(9):3360–3372.
Kimura, T., Saito, H., Honda, H., and Kawahara, R. (2016).
Modeling urban its communication via stochastic ge-
ometry approach. In 2016 IEEE 84th Vehicular Tech-
nology Conference (VTC-Fall), pages 1–5.
Li, W., Song, W., Lu, Q., and Yue, C. (2020). Reliable
congestion control mechanism for safety applications
in urban vanets. Ad Hoc Networks, 98:102033.
Li, Z., Wang, Y., and Zhao, J. (2022). Reliability Evalua-
tion of IEEE 802.11p Broadcast Ad Hoc Networks on
the Highway. IEEE Transactions on Vehicular Tech-
nology, 71(7):7428–7444.
Luong, H. P., Panda, M., Vu, H. L., and Vo, B. Q. (2017).
Beacon rate optimization for vehicular safety appli-
cations in highway scenarios. IEEE Transactions on
Vehicular Technology, 67(1):524–536.
Ma, X. and Trivedi, K. S. (2021). SINR-Based analysis of
IEEE 802.11p/bd broadcast vanets for safety services.
IEEE Transactions On Network And Service Manage-
ment, 18(3):2672–2686.
Ma, X., Yin, X., and Trivedi, K. S. (2012). On the reliability
of safety applications in vanets. International Journal
of Performability Engineering, 8(2).
Ma, X., Zhao, J., Wang, Y., Zhang, T., and Li, Z. (2021). A
new approach to sinr-based reliability analysis of ieee
802.11 broadcast ad hoc networks. IEEE Communi-
cations Letters, 25(2):651–655.
Nguyen, H. Q., Baccelli, F., and Kofman, D. (2007). A
stochastic geometry analysis of dense IEEE 802.11
networks. In Proc. 26th IEEE INFOCOM 2007, pages
1199–1207, Barcelona, Spain.
Ni, M., Hu, M., Wang, Z., and Zhong, Z. (2015a). Packet re-
ception probability of vanets in urban intersecton sce-
nario. In Proc. Int. Conf. on Connected Vehicles and
Expo, pages 124–125, Shenzhen, China.
Ni, M., Pan, J., Cai, L., Yu, J., Wu, H., and Zhong, Z.
(2015b). Interference-based capacity analysis for ve-
hicular ad hoc networks. IEEE Communications Let-
ters, 19(4):621–624.
Steinmetz, E., Wildemeersch, M., Quek, T. Q. S., and
Wymeersch, H. (2015). A stochastic geometry model
for vehicular communication near intersections. In
2015 IEEE Globecom Workshops (GC Wkshps), pages
1–6.
Tong, Z., Lu, H., Haenggi, M., and Poellabauer, C. (2016).
A stochastic geometry approach to the modeling of
DSRC for vehicular safety communication. IEEE
Transactions on Intelligent Transportation Systems,
17(5):1448–1458.
Trivedi, K. S. (2008). Probability & statistics with reliabil-
ity, queuing and computer science applications. John
Wiley & Sons.
Yin, X., Ma, X., and Trivedi, K. S. (2013). An interact-
ing stochastic models approach for the performance
evaluation of DSRC vehicular safety communication.
IEEE Transactions on Computers, 62(5):873–885.
Zhao, J., Li, Z., Wang, Y., Wu, Z., Ma, X., and Zhao, Y.
(2020). An analytical framework for reliability eval-
uation of d-dimensional IEEE 802.11 broadcast wire-
less networks. Wireless Networks, 26:3373–3394.
Zhao, J., Wang, Y., Lu, H., Li, Z., and Ma, X. (2021a).
Interference-based qos and capacity analysis of vanets
for safety applications. IEEE Transactions on Vehicu-
lar Technology, 70(3):2448–2464.
Zhao, J., Zhou, H., Wang, Y., Lu, H., Li, Z., and Ma, X.
(2021b). Accelerating interference-based qos analysis
of vehicular ad hoc networks for bsm safety applica-
tions: Parallel numerical solutions and simulations. In
VEHITS, pages 600–610.
VEHITS 2025 - 11th International Conference on Vehicle Technology and Intelligent Transport Systems
528
