
Advancing Airport Land Subsidence Monitoring Through
Time-Series InSAR Technology
Anuphao Aobpaet
a
, Intira Thanomsin, Chanikan Yodya
b
and Suchanpong Obnam
c
Department of Civil Engineering, Faculty of Engineering, Kasetsart University, Bangkok 10900, Thailand
Keywords: InSAR, Time-series InSAR, Land Subsidence Monitoring, Airport.
Abstract: The airport is a pivotal infrastructure project, serving as a hub for parking, transporting, and maintaining
aircraft carrying passengers, freight, and cargo. However, the substantial usage of the airport leads to the
challenge of land subsidence, necessitating ongoing monitoring and assessment. This study focuses on
monitoring land subsidence at Suvarnabhumi Airport, Thailand's premier international airport catering to
passengers and aircraft. In a lowland area with soft soil, applying advanced technology becomes imperative
for continuous monitoring and analysis of subsidence over time. Employing InSAR Time-Series technology,
researchers processed data from Sentinel-1 satellites spanning October B.E. 2017 to December 2023 to
analyse the evolving conditions at Suvarnabhumi Airport. Results reveal that the most significant subsidence
occurs in the Runway and Taxiway areas, with values ranging between -9.1 and 5.1 millimeters. per year.
This subsidence is likely attributed to the constant heavy air traffic on these surfaces. Continuous monitoring
and evaluation are crucial to planning effective maintenance. InSAR technology is valuable for monitoring
land subsidence or displacement, alleviating data constraints and streamlining operational processes.
1 INTRODUCTION
An airport is a critical infrastructure connecting air
and ground transportation systems and facilitating
links between national and global economies
(Pornpiboon, 1997; Chimtawan, 2005). Runways and
taxiways experience continuous use and are subject to
heavy loads and temperature fluctuations, leading to
wear, deformation, and subsidence, posing risks to
safety and infrastructure integrity.
Suvarnabhumi Airport, located in Samut Prakan
Province, is in a soft soil zone on the lower Chao
Phraya floodplain (Department of Mineral Resources,
2016). The area's geological structure comprises low-
density soft sedimentary soils, making them
unsuitable for supporting heavy loads. Groundwater
extraction has exacerbated subsidence, with
approximately 28–100 mm/year rates before airport
operations (Srisompong, 2008). Post-construction
monitoring indicates continued subsidence at 20–30
mm/year in the apron and runway areas. Ongoing
a
https://orcid.org/0000-0001-7638-853X
b
https://orcid.org/0009-0004-7114-7066
c
https://orcid.org/0009-0001-0548-5639
monitoring and evaluation are essential to mitigate
potential damage.
Traditional subsidence monitoring methods, such
as benchmarks and GNSS-based elevation surveys,
provide high accuracy but are limited in spatial
coverage and costly for large-scale monitoring
(Kheerinarat, 2020; Eiaurattanawadi, 2023). InSAR
technology, which uses phase differences in SAR
satellite images, offers a cost-effective and efficient
alternative for detecting land movement over large
areas (Piyamarat, 2022). Time-series InSAR further
enhances this by providing average subsidence rates
in millimeters per year using widely available satellite
imagery without requiring field installations.
This research applies time-series InSAR to
analyse Sentinel-1 satellite images (October 2017 to
December 2023) to monitor subsidence at
Suvarnabhumi Airport, Thailand's largest airport.
Subsidence is achieved through maps created in
QGIS, which provide insights into subsidence patterns
for improved infrastructure management and safety.
Aobpaet, A., Thanomsin, I., Yodya, C. and Obnam, S.
Advancing Airport Land Subsidence Monitor ing Through Time-Series InSAR Technology.
DOI: 10.5220/0013359500003935
Paper published under CC license (CC BY-NC-ND 4.0)
In Proceedings of the 11th International Conference on Geographical Information Systems Theory, Applications and Management (GISTAM 2025), pages 179-186
ISBN: 978-989-758-741-2; ISSN: 2184-500X
Proceedings Copyright © 2025 by SCITEPRESS – Science and Technology Publications, Lda.
179

1.1 Scope of the Research
1.1.1 Study Area
Samut Prakan Province is located along the Chao
Phraya River, at the river’s endpoint just above the
Gulf of Thailand, between latitudes 13-14 degrees
north and longitudes 100-101 degrees east. The
province covers an area of approximately 1,004
square kilometers, or about 627,557 rai, in central
Thailand, about 29 kilometers southeast of Bangkok.
The general landscape is predominantly lowland
plains, with the Chao Phraya River flowing through
the center, dividing the province into western and
eastern parts (Samut Prakan Province, n.d.; Office of
Project Administration, Royal Irrigation Department,
2018; Department of Mineral Resources, 2016).
Suvarnabhumi Airport (IATA: BKK, ICAO:
VTBS) is located on Debaratana Road and Burapha
Withi Expressway, approximately at kilometer 15, in
the subdistricts of Nong Prue and Racha Thewa, Bang
Phli District, Samut Prakan Province. It lies about 31
kilometers east of Bangkok and covers an area of
approximately 22,000 rai. As Thailand's largest
airport and the tenth largest globally, Suvarnabhumi
Airport opened for commercial service on September
28, 2006. It serves as Thailand’s primary airport,
featuring modern design and advanced technology,
providing excellent service across all areas (Airports
of Thailand Public Company Limited, n.d.).
Currently, Suvarnabhumi Airport has two runways,
capable of handling 68 flights per hour. A third
runway, 4,000 meters in length, is under construction
on the airport's west side to accommodate increasing
air traffic in the future and to ensure capacity during
maintenance closures of Runways 1 and 2. The third
runway will increase the airport’s capacity to 94
flights per hour. In optimal conditions with entire
runway and taxiway operations, it will support an
average of 800-1,000 flights per day (Suvarnabhumi
Airport Construction Project Management Office,
n.d.; AEC Consortium Group, 2020). Thus, the
airport is a vital infrastructure component that
influences the future of the aviation industry,
symbolising economic growth and facilitating
international business operations.
1.1.2 Duration of Implementation
This study uses Sentinel-1 satellite images from
October 2017 to December 2023 for analysis based
on Synthetic Aperture Radar (SAR) technology.
Figure 1: Suvarnabhumi Airport Layout
(Suvarnabhumi
Airport Construction Project Management Office, n.d.).
2 PRINCIPLES AND THEORY
2.1 Sentinel-1 Satellite Data
The Sentinel-1 satellite, part of the European Space
Agency’s (ESA) Copernicus program, began
operations in 2014 and includes Sentinel-1A and
Sentinel-1B satellites (Bunyapoluk, 2022). However,
Sentinel-1B cannot transmit data back to Earth due to
an issue with its power supply (Eiaurattanawadi,
2023). Sentinel-1 utilises a radar imaging system that
uses microwave signals from a satellite-based energy
source and transmits them to Earth at an oblique angle
(GISTDA, 2021). It operates in the C-band with a
frequency of 5.405 GHz, providing images with
varying spatial resolutions and swath widths, as
detailed in Table 1. For this research, the
Interferometric Wide-Swath Mode (IW) is selected,
covering a 250-kilometer swath and offering an
image resolution of 5 x 20 meters in range and
azimuth directions. Additionally, it operates in dual
polarisation mode with an incidence angle ranging
from 31 to 46 degrees (European Space Agency,
n.d.).
Figure 2: SAR Operating Mode (European Space Agency,
n.d.).
GISTAM 2025 - 11th International Conference on Geographical Information Systems Theory, Applications and Management
180
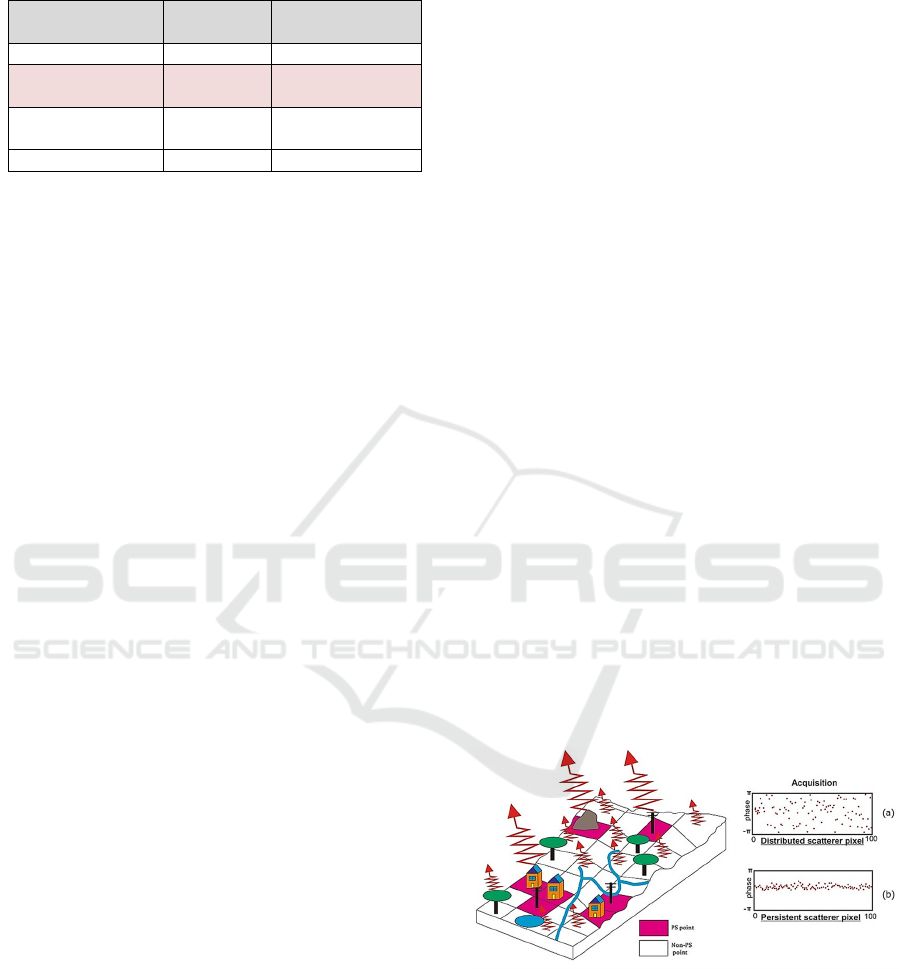
Table 1: SAR Operating Mode Under Sentinel-1 Satellite
(European Space Agency, n.d.).
Modes Swath
(
km
)
Spatial resolution
(
m
)
Stri
p
Ma
p
(
SM
)
80 5 x 5
Interferometric
Wide Swath (IW)
250 5 x 20
Extra-Wide Swath
(EW)
400 20 x 40
Wave (WV) 20 x 20 5 x 5
The Sentinel-1A satellite operates in a near-polar,
sun-synchronous orbit at 693 kilometers, with an
inclination angle of 98.18 degrees and a 12-day repeat
cycle. Equipped with a C-SAR sensor, it provides
data under all weather conditions, day and night. The
satellite requires precise orbital control to ensure
accurate InSAR measurements for land and maritime
monitoring, emergency management, and
infrastructure analysis.
2.2 Interferometric Synthetic Aperture
Radar (InSAR)
InSAR (Interferometric Synthetic Aperture Radar)
technology is an advancement of SAR technology,
which combines Synthetic Aperture Radar (SAR)
images with wave interferometry technology
(Aobpaet & Trisirisatayawong, 2012). The working
principle of InSAR involves analysing phase
differences between two or more SAR images.
Synthetic Aperture Radar is a radar system that
produces high-resolution images (Piromthong, 2015).
When images of the same area taken at different times
are compared, the resulting phase differential indicates
surface movement (Geoscience Australia, n.d.;
Chelbi, Khireddine, & Charles, 2011). The difference
due to movement creates discrepancies between the
two images. The phase difference allows the study of
deformation patterns in various forms of land changes
(Chaitawee, 2015). However, while InSAR
technology can operate in all weather conditions, both
day and night, a significant limitation is the signal
distortion caused by the atmosphere, which leads to
phase measurement errors (Lu, Kwoun, & Rykhus,
2007).
2.3 Time-Series InSAR
The analysis using Time-series InSAR provides a
sufficient density of checkpoints to resolve issues
related to sparse checkpoints. It also addresses the
limitations of using such points to monitor
displacement or subsidence. As a result, this
technique offers high accuracy and precision.
Persistent Scatterer Interferometry (PS-InSAR) is
a technique that uses phase data from Synthetic
Aperture Radar (SAR) images to analyse changes in
land displacement over time or across specific periods.
It relies on the consistent and permanent backscatter
(Permanent Scatterer, PS) of radar signals, which are
transmitted to objects and reflected to the satellite
antenna. The method generates multiple Differential
Interferogram pairs, each referenced to a master image
for image matching (Chaitawee, 2015). This study
processes time-series radar images using the Persistent
Scatterers method, another approach in the Time-
series InSAR technique.
2.
4
Persistent Scatterers InSAR
Persistent Scatterers InSAR (PSInSAR) is an
advanced remote sensing technique developed from
InSAR to address issues related to the lack of data
correlation and signal distortions caused by the
atmosphere (Piromthong, 2015). It utilises the
backscatter of microwave signals from prominent and
permanent reflectors (Permanent Scatterers, PS),
which reflect off objects and return to the signal
receiver, resulting in backscattering values for each
pixel. The amplitude and phase of each pixel are
vector sums of the backscattering from various
scatterers. Over time, any changes in these objects,
regardless of the cause, lead to changes in the
amplitude and phase of the pixel, indicating
movement, as shown in
Figure
3
(Sricharoenpramong,
2015; Hooper, Segall, & Zebker, 2007). This
technique is, therefore, suitable for monitoring
subsidence at airports.
Figure
3
: Simulation of Scattering Characteristics
a)
Distributed Scatterer Pixel
(
b) Persistent Scatterer Pixel
(Yhokha, Goswami, & Chang, 2018).
2.5 Stanford Method for Persistent
Scatterers (StaMPS)
StaMPS is a software used for InSAR processing with
the Persistent Scatterers (PS) method, developed to
Advancing Airport Land Subsidence Monitoring Through Time-Series InSAR Technology
181
work even in areas without human-made structures or
regions experiencing unstable deformation (Hooper,
Bekaert, & Spaans, 2013). The core of the PS
technique involves identifying PS pixels and using
only the values from the selected pixels for
displacement processing. In the early stages of the PS
technique, amplitude values were primarily used for
filtering, which limited its use to areas with bright
scatterers, such as regions with many structures.
Another limitation was that a model of surface
displacement had to be known beforehand, or the
surface needed to exhibit stable movement to provide
reliable results. However, StaMPS uses amplitude
and the positional correlation of phase values for PS
pixel filtering. This allows StaMPS to identify PS
pixels even in areas with few structures. It enables it
to work in regions with non-stable displacement
without prior knowledge of the surface displacement
rate (Chaitawee, 2015).
3 METHODOLOGY
3.1 Preparation of Satellite Image Data
The data used in this study consists of images from
the Sentinel-1 satellite in the ascending orbit, which
moves from south to north over the Earth's surface,
covering the area of Suvarnabhumi Airport, Samut
Prakan Province, as shown in Figure 4. The dataset to
be used includes 75 Synthetic Aperture Radar (SAR)
satellite images recorded from October 25, 2017, to
December 29, 2023, covering 7 years. These images
are captured in the ascending orbit, with L1 Single
Look Complex (SLC) data, operating in VH and VV
polarisation modes, and recorded in Interferometric
Wide (IW) mode. The coordinate system used is
WGS 1984, in Path 172 and Frame 1222, ensuring all
images overlap perfectly for subsequent analysis.
Figure 4: Scope of Ascending Orbit Satellite Images
Covering the Study Area.
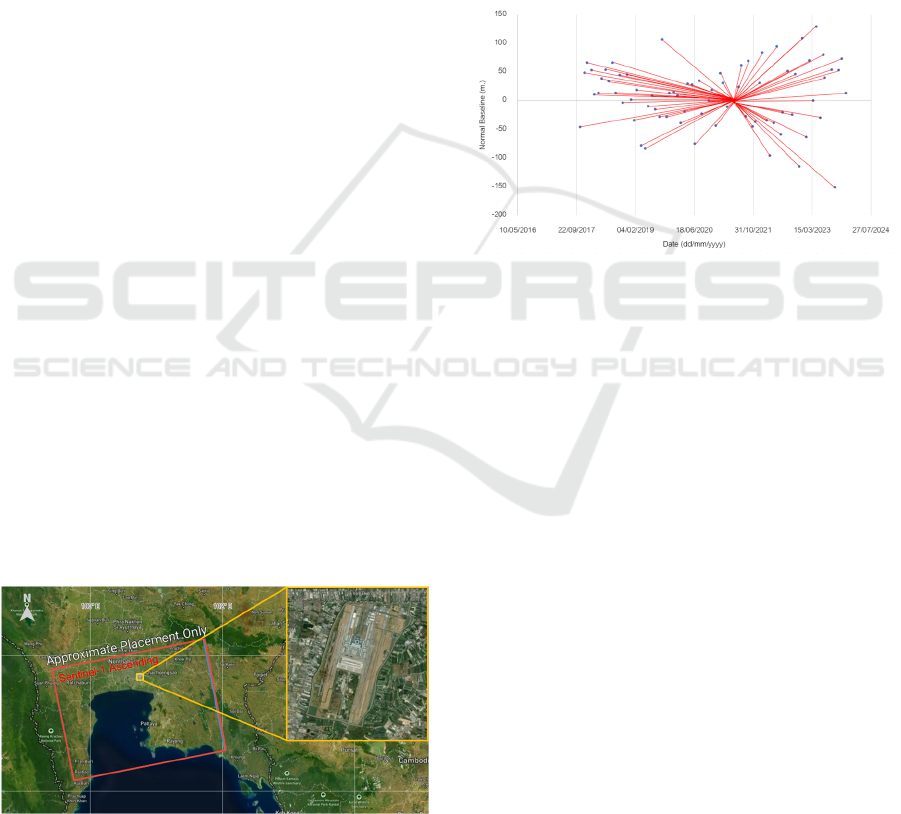
3.2 Data Processing
Interferometric processing (InSAR) relies on the
phase difference between two SAR images, referred
to as the master image and the slave image, from the
same area. Creating the interferogram uses the SNAP
software to select the master image from the 75
images available. The image from October 21, 2020
(Subswath: IW2, Polarization VV, Burst 6-8) was
chosen as the master image for reference and image
matching, as shown in Figure 5. Then, the Co-
registration algorithm aligned the sub-images from
nearby areas, ensuring their coordinates were
consistent (Laohudomchoke, 2023).
Figure 5: Image Matching of Slave Using the Master Image
as a Reference.
The algorithm for processing time-series satellite
data works as follows: first, Sentinel-1 satellite
images are downloaded. Once completed, the SNAP
software is used to read and convert the data by
performing image matching between the Master and
Slave images to create the interferogram. Then, a PS
candidate file is created (using the command
mt_prep_snap), and MATLAB is used to process the
data with the Persistent Scatterers method in StaMPS
to identify PS pixels. Phase unwrapping is performed
to obtain complete phase values, and atmospheric
noise is corrected using a linear process in TRAIN.
Finally, time series plots are generated (Ladawadee,
2022). The workflow for the algorithm to determine
subsidence rates can be illustrated in the flowchart
shown in Figure 6.
3.3 Displaying Data on the Subsidence
Map
Using MATLAB, the application of time-series
InSAR for monitoring subsidence at Suvarnabhumi
Airport allows for calculating displacement
(Deformation) and coordinates (Latitude and
longitude). The displacement data can then be
GISTAM 2025 - 11th International Conference on Geographical Information Systems Theory, Applications and Management
182
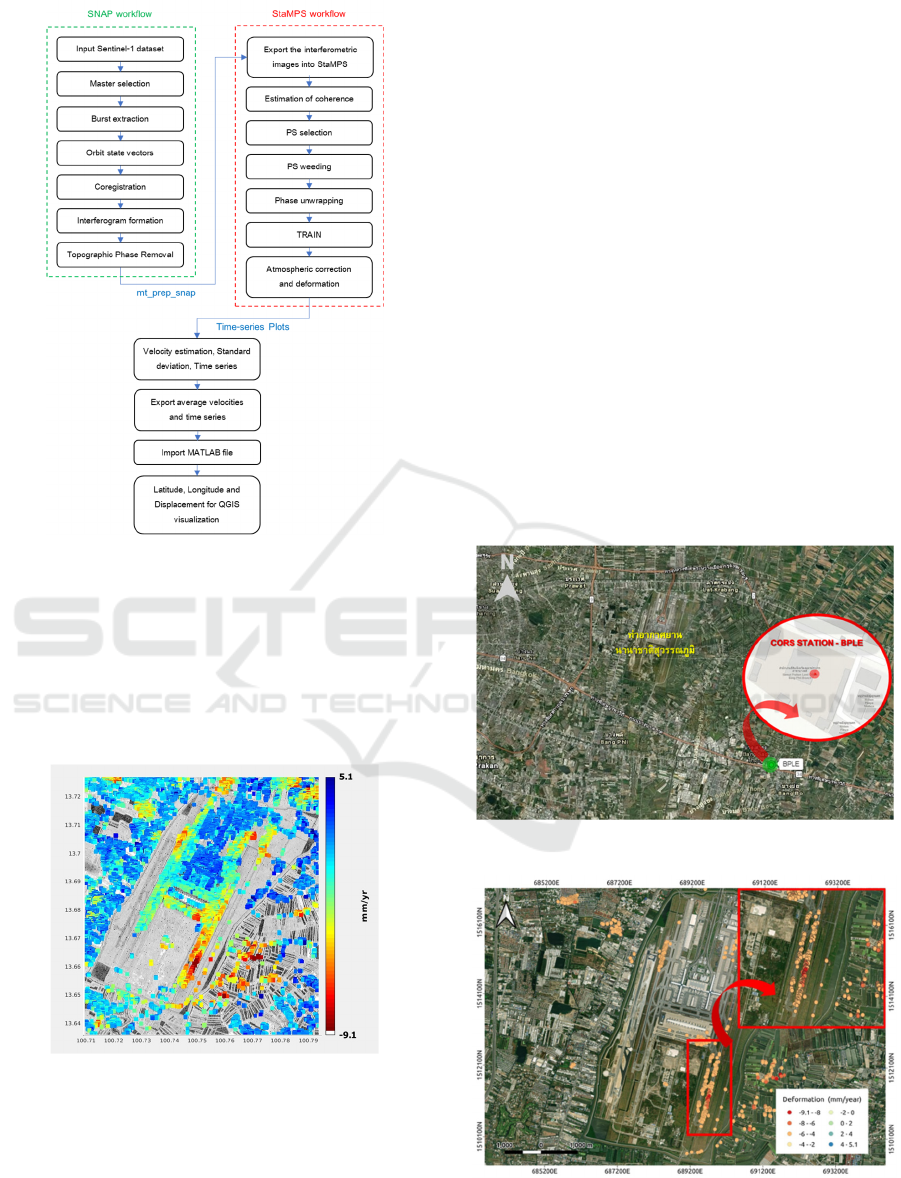
Figure 6: Flowchart of the Algorithm Workflow.
displayed on a map in QGIS, as shown in Figure 9.
This is done by creating a data layer and defining
coordinates along the axis, followed by classification
to display the frequency of the data. The resulting
data is shown as points, with varying colors
representing the different subsidence values across
the study area, as depicted in Figure 7.
Figure 7: Results of Subsidence Analysis from MATLAB.
3.4 CORS Station
This research used data from one CORS station,
BPLE, operated by the Department of Lands. This
station is located at the Samut Prakan Land Office,
Bang Phli branch, as shown in Figure 8. It provides
automatic GNSS satellite signal surveying data under
the supervision of the Royal Thai Survey Department.
The data was collected from 2021 to 2023 and
processed to display horizontal and vertical
displacement. The results are presented in positional
data (Latitude, Longitude, Height), which can be used
as a reference for comparing subsidence trends
alongside time-series InSAR analysis using Sentinel-
1 satellite images from the same period. The GNSS
data were obtained through high-precision single-
point positioning, calculated by GPS surveying using
the online AUSPOS service, developed by
Geoscience Australia, a government agency. This
service offers free online GPS data processing. The
data processing utilises MicroCosm software, using
high-precision satellite orbit and IGS high-precision
satellite clock corrections. The processing can only be
done with static survey data using dual-frequency
receivers in RINEX format (Receiver Independent
Exchange Format). The accuracy of the results may
depend on the quality of the receiver, the survey
duration, and the distance from the reference station
(Sukwimonsaree et al., 2011).
Figure 8: Position of BPLE CORS Station.
Figure 9: A subsidence rate map of Suvarnabhumi Airport,
focusing on the runways and taxiways that require special
attention, derived from time-series InSAR processing.
Advancing Airport Land Subsidence Monitoring Through Time-Series InSAR Technology
183
4 RESULTS
4.1 Checking the Subsidence Value
The study on the application of time-series InSAR for
monitoring subsidence at Suvarnabhumi Airport,
using 75 Sentinel-1 satellite images from October
2017 to December 2023, detected 44,343 PS pixels
indicating subsidence and uplift across the airport
area. The analysis of subsidence values in the
ascending satellite orbit revealed land subsidence
ranging from -9.1 mm/year (subsidence) to 5.1
mm/year (uplift), as shown in Figure 9. These
subsidence values are within the normal range for
airport design in typical lowland areas, allowing
subsidence of up to 300 to 450 mm over 10 years
without causing operational or safety issues
(Srisompong, 2008).
As shown in Figure 13, the runway and taxiway
areas have a clear difference in subsidence compared
to other areas. For example, areas marked with orange
to red indicate subsidence ranging from -9.1 to -4 mm
per year, showing more significant subsidence than
other locations. These areas should, therefore, be
closely monitored and inspected. However, time-
series InSAR provides preliminary information about
subsidence.
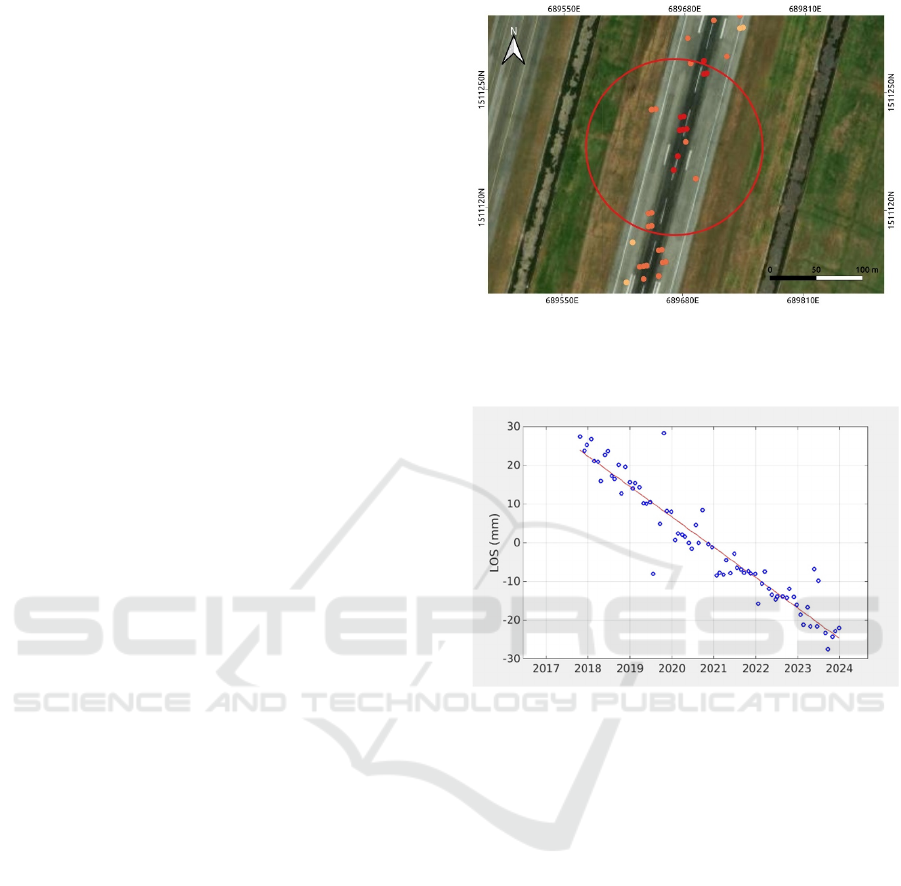
4.2 Verification of Time-Series InSAR
Technique
The processing using the Persistent Scatterer
Interferometry (PSI) time-series technique to monitor
subsidence at Suvarnabhumi Airport, specifically in
the runway and taxiway areas (Runway 2), referenced
at coordinates Lat 13.6637, Lon 100.7536, was
conducted within a 100-meter radius. As shown in
Figure 10, the airport's cumulative subsidence trend
is increasing. The graph in Figure 11 illustrates daily
cumulative subsidence values in millimeters. The
detailed time-series measurements of PS deformation
reveal a clear subsidence pattern.
4.3 Comparison of Subsidence Trends
The results obtained from processing RINEX data
from 2021 to 2023 for station BPLE, reported as
positional data including Latitude (X), Longitude (Y),
and Height (Z), reveal movement in three directions:
X, Y, and Z.
This research focuses on vertical displacement
(Z) or land subsidence. From data processing, the
height of station BPLE on January 25, 2021 (initial
date), was -18.319 meters, and on December 29, 2023
Figure 10: The points within the 100-meter inspection
radius on Runway 2, located at coordinates Lat 13.6637,
Lon 100.7536, are measured in the Line of Sight (LOS).
Figure 11: The cumulative subsidence trend from 2017 to
2023 within a 100-meter radius on Runway 2, located at
coordinates Lat 13.6637, Lon 100.7536.
(final date), it was -18.390 meters. A height
difference of 0.071 meters, equivalent to 71
millimeters, was observed from 2021 to 2023. Over
the three years of processing, this indicates a land
subsidence rate of 71 millimeters or 23.7 millimeters
per year. As shown in Figure 12, when compared to
the subsidence rates obtained using the InSAR
technique at Suvarnabhumi Airport, which range
from -9.1 to -5.1 millimeters per year, the results
demonstrate an increasing trend in land subsidence
that is consistent with the overall pattern.
The subsidence rate trends derived from InSAR
time-series processing and the permanent GNSS
station BPLE, under the Department of Lands, from
2021 to 2023, exhibit a consistent pattern. The
subsidence rate increases over time. The subsidence
in the Suvarnabhumi Airport area is lower due to soil
improvements and specialised construction
techniques designed to support massive loads. In
contrast, station BPLE, located approximately 10
GISTAM 2025 - 11th International Conference on Geographical Information Systems Theory, Applications and Management
184

Figure 12: The height statistics and subsidence trends of
station BPLE.
kilometers from the airport, shows a higher
subsidence rate despite being in a nearby area.
5 CONCLUSIONS
Time-series InSAR technology is an effective method
for monitoring airport subsidence. This study
analysed Sentinel-1 satellite data using the Persistent
Scatterer (PS) technique from October 2017 to
December 2023, utilising 75 ascending orbit SLC
images. The analysis identified 44,343 monitoring
points with subsidence rates ranging from -9.1 to 5.1
mm/year, where negative values indicate subsidence
and positive values indicate uplift. Runway and
taxiway areas exhibited significant cumulative
subsidence due to continuous air traffic use.
GNSS data from the BPLE station (10 km from
Suvarnabhumi Airport) recorded a subsidence rate of
23.7 mm/year (2021–2023), aligning with InSAR-
derived trends. Differences in subsidence values
reflect varying construction techniques and land use.
Still, both highlight Samut Prakan's susceptibility to
subsidence due to its soft soil and impacts from
urbanisation and groundwater extraction.
The findings underscore the importance of
continuous subsidence monitoring to mitigate risks.
InSAR technology proves valuable in engineering
surveys, offering preliminary insights into ground
stability, reducing fieldwork, and optimising time and
costs. Thus, it is a practical tool for infrastructure
management and hazard prevention.
ACKNOWLEDGEMENTS
The authors thank the European Space Agency (ESA)
for providing the Sentinel-1 satellite images from the
Copernicus program from 2017 to 2023, distributed
by ASF DAAC and the SNAP (Sentinel Application
Platform) software. I also thank Prof. Andy Hooper
from the School of Earth and Environment,
University of Leeds, for the StaMPS (Stanford
Method for Persistent Scatterers) software. Thanks to
MathWorks for providing MATLAB (Matrix
Laboratory) and to the software development team
behind QGIS (Quantum GIS), which was used for
processing and visualising data with the time-series
InSAR technique. I would also like to thank the Royal
Thai Survey Department (RTSD) and the Department
of Lands (DOL) for providing the RINEX Data.
Finally, I would like to thank the AUSLIG Online
GPS Processing Service (AUSPOS) for providing
free GNSS data processing software. This research
has received funding support from the NSRF via the
Program Management Unit for Human Resources &
Institutional Development, Research and Innovation
[grant number B11F670110]
REFERENCES
Pornpiboon, M. (1997). Airports. In Thai Encyclopedia for
Youth, Volume 22, Topic 9: Airports.
Chimtawan, P. (2005). Suvarnabhumi Airport and Its
Potential as an Aviation Hub of Southeast Asia.
Academic report for the Advanced Certificate in Public
Economics for Senior Executives, King Prajadhipok's
Institute.
Airports of Thailand Public Company Limited. (n.d.).
Suvarnabhumi Airport. Retrieved from
https://suvarnabhumi.airportthai.co.th/about-us
Samut Prakan Province. (n.d.). Geography and Climate.
Retrieved from https://www.samutprakan.go.th
Office of Project Administration, Royal Irrigation
Department. (2018). Master Plan Report for Basin
Development in Samut Prakan Province.
Department of Mineral Resources. (2016). Zoning for
Geological and Mineral Resource Management in
Samut Prakan Province.
Suvarnabhumi Airport Construction Project Management
Office. (n.d.). Runway 3 Construction Project,
Suvarnabhumi Airport. Retrieved from
https://www.bkk-runway3.com
AEC Consortium Group. (2020). Runway 3 Construction
Project, Suvarnabhumi Airport: Monthly Service
Report for September 2020.
LeGrand Beltran. (2021). Understanding Airport Design
and Operations. Retrieved from
https://www.scribd.com/document
GISTDA. (2021). How Radar Satellites Can Detect Ships.
Retrieved
from https://www.gistda.or.th/
news_view.php?n_id=1511&lang=EN
Bunyapoluk, T. (2022). Development of Dam Safety
Monitoring Using Time-Series InSAR Technology. In
The 27th National Civil Engineering Conference.
European Space Agency. (n.d.). Sentinel-1 Data Access and
Products. Retrieved from https://sentinels.
Advancing Airport Land Subsidence Monitoring Through Time-Series InSAR Technology
185

copernicus.eu/documents/247904/1653440/Sentinel-
1_Data_Access_and_Products
Piyamarat, N. (2022). Application of Time-Series InSAR
Technology for Monitoring the Movement of
Srinagarind Dam. In The 27th National Civil
Engineering Conference.
Geoscience Australia. (n.d.). Interferometric Synthetic
Aperture Radar. Retrieved from https://www.ga.
gov.au/scientific-topics/positioning-navigation/
geodesy/geodetic-techniques/interferometric-
synthetic-aperture-radar
Aobpaet, A., & Trisirisatayawong, I. (2012). InSAR Time
Series Analysis for Land Subsidence Monitoring in
Bangkok and Its Vicinity Area. Chulalongkorn
University.
Piromthong, P. (2015). Detection of Land Subsidence Rate
During 1996-2000 and Subsidence Trends in Bangkok
Metropolitan Region Using Time-Series InSAR
Technique. In The 20th National Civil Engineering
Conference.
Chelbi, S., Khireddine, A., & Charles, J. (2011).
Interferometry process for satellite images SAR. Paper
presented at the 2011 7th International Conference on
Electrical and Electronics Engineering (ELECO).
Chaitawee, S. (2015). Monitoring Land Subsidence in the
Eastern Bangkok Metropolitan Area Using Time-Series
InSAR Technique. In The 19th National Civil
Engineering Conference.
Lu, Z., Kwoun, O., & Rykhus, R. (2007). Interferometric
Synthetic Aperture Radar (InSAR): Past, Present and
Future. Photogrammetric Engineering & Remote
Sensing.
Hooper, A., Segall, P., & Zebker, H. (2007). Persistent
scatterer interferometric synthetic aperture radar for
crustal deformation analysis, with application to
Volcán Alcedo, Galápagos. Journal of Geophysical
Research, 112, B07407.
Hooper, A., Bekaert, D., & Spaans, K. (2013). StaMPS/MTI
Manual Version 3.3b1. School of Earth and
Environment, University of Leeds.
Ladawadee, A. (2022). Study of the Relationship between
Changes in Groundwater Pressure and Land
Subsidence Rate Using Time-Series InSAR Technique.
In The 27th National Civil Engineering Conference.
Laohudomchoke, C. (2023). Monitoring Infrastructure
Movements Using InSAR Technology: A Case Study of
the Upper Reservoir of Lam Takhong Pumped Storage
Power Plant. In The 28th National Civil Engineering
Conference.
Srisompong, S. (2008). Causes and Remedies for Runway
and Taxiway Damage at Suvarnabhumi Airport.
Journal of the Faculty of Architecture, King Mongkut's
Institute of Technology Ladkrabang.
Eiaurattanawadi, N. (2023). Monitoring Land Subsidence
in Bangkok and Vicinity During 2017-2022 Using
Time-Series InSAR Technique with MintPy Software. In
The 28th National Civil Engineering Conference.
Yhokha, A., Goswami, P.K., & Chang, C.P. (2018).
Application of Persistent Scatterer Interferometry (PSI)
in monitoring slope movements in Nainital,
Uttarakhand Lesser Himalaya, India. Journal of Earth
System Science, 127.
Kheerinarat, C. (2020). Analysis of Land Subsidence Rate
in Bangkok Using InSAR Data. In The 25th National
Civil Engineering Conference.
NCDC (National Continuous Coordinate Reference Data
Center). (n.d.). Thai CORS Stations. Retrieved from
https://ncdc.in.th
Sukwimonsaree, T., et al. (2011). Accuracy Assessment of
Online GPS Survey Data Processing Services.
Engineering Journal of Kasetsart University, 76(24),
April-June 2011.
GISTAM 2025 - 11th International Conference on Geographical Information Systems Theory, Applications and Management
186
