
The Scent of Test Effectiveness: Can Scriptless Testing Reveal Code
Smells?
Olivia Rodr
´
ıguez-Vald
´
es
1 a
, Domenico Amalfitano
2 b
, Otto Sybrandi
3 c
, Beatriz Mar
´
ın
4 d
and
Tanja Vos
1,4 e
1
Open Universiteit, Heerlen, The Netherlands
2
University of Naples Federico II, Naples, Italy
3
Marviq, The Netherlands
4
Universitat Polit
`
ecnica de Val
`
encia, Val
`
encia, Spain
fi
Keywords:
Code Smells, Random Testing, Scriptless Testing, GUI Testing, Testing Adequacy Criteria.
Abstract:
This paper presents an industrial experience applying random scriptless GUI testing to the Yoho web applica-
tion developed by Marviq. The study was motivated by several key challenges faced by the company, including
the need to optimise testing resources, explore how random testing can complement manual testing, and in-
vestigate new coverage metrics, such as “code smell coverage”, to assess software quality and maintainability.
We conducted an experiment to explore the impact of the number and length of random GUI test sequences
on traditional adequacy metrics, the complementarity of random with manual testing, and the relationship be-
tween code smell coverage and traditional code coverage. Using Testar for scriptless testing and SonarQube
code smell identification, results show that longer random test sequences yielded better test adequacy metrics
and increased code smell coverage. In addition, random testing offers promising efficiency in test coverage
and detects unique smells that manual testing might overlook. Additionally, including code smell coverage
provides valuable insights into long-term code maintainability, revealing gaps that traditional metrics may not
capture. These findings highlight the benefits of combining functional testing with metrics assessing code
quality, particularly in resource-constrained environments.
1 INTRODUCTION
The increasing reliance on complex web applications
demands robust software testing practices to pre-
vent bugs that could cause user dissatisfaction, data
breaches, and reputational harm (Bons et al., 2023).
For companies, testing at the Graphical User Interface
(GUI) level is essential, providing insights into the
customer experience (Rodr
´
ıguez-Valdes et al., 2021).
However, manually executing GUI tests is resource-
intensive and error-prone, particularly in regression
testing, prompting a shift toward automation.
Automated GUI testing approaches fall into two
categories: scripted and scriptless. Scripted test-
ing utilises predefined scripts based on specific use
a
https://orcid.org/0000-0002-7562-8199
b
https://orcid.org/0000-0002-4761-4443
c
https://orcid.org/0000-0002-7824-2320
d
https://orcid.org/0000-0001-8025-0023
e
https://orcid.org/0000-0002-6003-9113
cases, requiring extensive maintenance when the GUI
changes (Al
´
egroth et al., 2016). In contrast, script-
less testing dynamically generates test sequences by
exploring the GUI in real-time, reducing maintenance
needs but introducing challenges in action selection
and automation of oracles (Vos et al., 2021).
Synthesis of 5 case-based studies (Vos et al., 2021)
using an architectural analogy (Wieringa and Daneva,
2015) has demonstrated that scriptless GUI testing
complements traditional scripted testing techniques.
Despite these advantages, industrial adoption remains
limited (Rodr
´
ıguez-Valdes et al., 2021).
In collaboration with the private company Marviq
and under the European IVVES project, we identi-
fied several critical needs influencing the adoption of
scriptless testing in industrial settings: (1) optimisa-
tion of test session length to balance coverage and
time efficiency; (2) evaluation of random GUI test-
ing as a complement to existing manual testing pro-
cesses; (3) introduction of code smell coverage to ad-
Rodríguez-Valdés, O., Amalfitano, D., Sybrandi, O., Marín, B. and Vos, T.
The Scent of Test Effectiveness: Can Scriptless Testing Reveal Code Smells?.
DOI: 10.5220/0013360100003928
In Proceedings of the 20th International Conference on Evaluation of Novel Approaches to Software Engineering (ENASE 2025), pages 137-148
ISBN: 978-989-758-742-9; ISSN: 2184-4895
Copyright © 2025 by Paper published under CC license (CC BY-NC-ND 4.0)
137

dress maintainability and technical debt; (4) assess-
ment of correlations between code smell coverage and
traditional coverage metrics to identify testing gaps.
Addressing these needs requires considering both
the breadth of code tested and its quality. Tradi-
tional metrics (e.g., line, branch, and complexity cov-
erage) are widely used but have limitations in captur-
ing the quality of testing (Inozemtseva and Holmes,
2014)(Madeyski, 2010). High code coverage may not
guarantee thorough testing or the detection of subtle
defects, leaving critical quality aspects overlooked.
This paper explores code smells as a metric for
evaluating traditional coverage metrics within the
context of an industrial web application. Code smells
indicate potential maintainability issues and hidden
bugs (Pereira dos Reis et al., 2022). Covering these
smells during testing can reflect the ability of the test-
ing tool to detect deeper quality issues. While static
analysis identifies potential smells, dynamic testing
ensures these smells are encountered during real ap-
plication use, increasing confidence in addressing ar-
eas that may contribute to defects and boosting confi-
dence in overall software quality.
Our study uses SonarQube
1
for code smell de-
tection and the Testar tool (Vos et al., 2021) for
scriptless GUI testing to assess the impact of test se-
quence length on coverage and investigates correla-
tions between code smells and traditional coverage
metrics. Additionally, we evaluate the complemen-
tarity of scriptless testing with Marviq’s manual test-
ing process. This collaboration brings significant rel-
evance, as it adds a real-world and practical compo-
nent to our study and another industrial validation of
scriptless GUI testing needed for case study general-
isation through architectural analogy (Wieringa and
Daneva, 2015). The contribution of this paper is
threefold:
1. We conduct an empirical study to analyse the in-
fluence of test sequence length on traditional cov-
erage metrics.
2. We propose using known code smells in an in-
dustrial application to evaluate the effectiveness
of traditional coverage metrics in exploring a sys-
tem.
3. We compare random scriptless testing with Mar-
viq’s manual testing process to demonstrate their
complementarity and the potential of scriptless
testing.
This research offers insights for software testing
professionals and researchers interested in expanding
traditional coverage metrics to include maintainabil-
ity aspects. By integrating code smell detection, we
1
https://www.sonarsource.com/products/sonarqube/
contribute to developing testing techniques that ad-
dress both functionality and software quality. More-
over, new research directions open up exploring the
relationship between GUI testing and code smells.
The paper is structured as follows. Section 2
presents the state of the art in random scriptless GUI
testing, adequacy metrics and code smell analysis.
Section 3 describes the industrial context. Section 4
describes the experiments, and Section 5 shows the
results and answers to the research questions. Sec-
tion 6 discusses Marviq’s perspective of the findings,
while Section 7 addresses validity threats. Finally,
section 8 concludes the work and summarises future
research.
2 RELATED WORK
Random Scriptless GUI Testing. GUI testing is es-
sential for ensuring the reliability and functionality
of modern software. One of the key techniques in
this domain is random scriptless GUI testing, where
agents autonomously interact with the GUI by gener-
ating and executing random user interactions. While
effective at identifying faults, its success largely de-
pends on the configuration of randomisation param-
eters. Recent studies show that test outcomes are
significantly influenced by sequence length, state ab-
straction, and stopping criteria (Tramontana et al.,
2019) (Amalfitano et al., 2017).
Improving the effectiveness of random GUI test-
ing requires adapting the strategy to overcome spe-
cific challenges presented by GUI components, such
as blocking GUIs that need specific user interactions
to be unlocked. Recent work has introduced novel
techniques to enhance the ability of random agents to
navigate and test complex interfaces, thereby improv-
ing testing adequacy (Amalfitano et al., 2019).
Furthermore, a body of research compares random
testing with manual testing approaches, highlighting
their complementarity. Manual testing can cover parts
of the code that random testing might miss, while
random approaches uncover unexpected interactions
and pathways that manual testers may overlook. This
complementarity suggests that a hybrid strategy, com-
bining both methods, could enhance coverage and
fault detection (Martino et al., 2024) (Jansen et al.,
2022).
Test Adequacy Metrics. Code coverage is widely
used to evaluate testing quality by linking it to test ef-
fectiveness (Hemmati, 2015), (Kochhar et al., 2015),
(Gligoric et al., 2013), (Pradhan et al., 2019). While
coverage metrics act as surrogate measures of testing
thoroughness, studies suggest that coverage criteria
ENASE 2025 - 20th International Conference on Evaluation of Novel Approaches to Software Engineering
138
alone are a poor indicator of test quality (Staats et al.,
2012), highlighting the need for approaches beyond
code coverage (Tengeri et al., 2015).
A comprehensive comparison of Android GUI
testing tools was conducted using line of executable
code coverage (Choudhary et al., 2015). Similarly,
various automated Android testing tools were com-
pared based on method and activity coverage, and
fault detection (Wang et al., 2018). Branch cover-
age was the primary metric in a study comparing ran-
dom testing and search-based test data generation for
web applications(Alshahwan and Harman, 2011). In-
struction and branch were assessed for Java applica-
tions to evaluate effectiveness (van der Brugge et al.,
2021). Likewise, line and statement coverage were
used to propose a framework to evaluate the effective-
ness of Android GUI testing tools (Amalfitano et al.,
2017). Recently, the effectiveness of a reinforcement
learning testing approach for Android was examined
using instruction, branch, line and method coverage
in(Collins et al., 2021). An image-based GUI testing
approach was also empirically evaluated for Android
and Web applications using line coverage and branch
coverage (Yu et al., 2024).
Code coverage metrics have been noted to over-
look problematic interactions between the GUI user
events and the application, prompting the need for
new perspectives in GUI testing coverage criteria
(Memon, 2002). Subsequently, an empirical evalua-
tion analysed the impact of test suite size on fault de-
tection, showing that larger test suites identify more
seeded faults in toy projects (Memon and Xie, 2005).
This conclusion aligns with the idea that higher cov-
erage indicates deeper system exploration, improving
fault detection. However, it raises the question of
which traditional coverage metrics are the best indi-
cators of test quality in real-world projects.
Code Smells. Indicators of design flaws or issues in
source code, known as code smells (Fowler, 2018),
can reflect the ability of the testing tool to detect
deeper quality issues when identified during test-
ing. Existing research on code smells primarily fo-
cus on prioritization (Sae-Lim et al., 2018), (Fontana
et al., 2015a), (Codabux and Williams, 2016), filtra-
tion (Fontana et al., 2015b), and the code smells-faults
correlation (Rahman et al., 2023), (Olbrich et al.,
2010), (Gondra, 2008).
The relationship between code smells and test
coverage has been studied (Spadini et al., 2018),
showing that classes with smells often have lower test
coverage. In (Bavota et al., 2015), an exploration of
the link between quality metrics, the presence of code
smells, and refactoring activities reveals that only 7%
of the refactoring on smelly classes actually removed
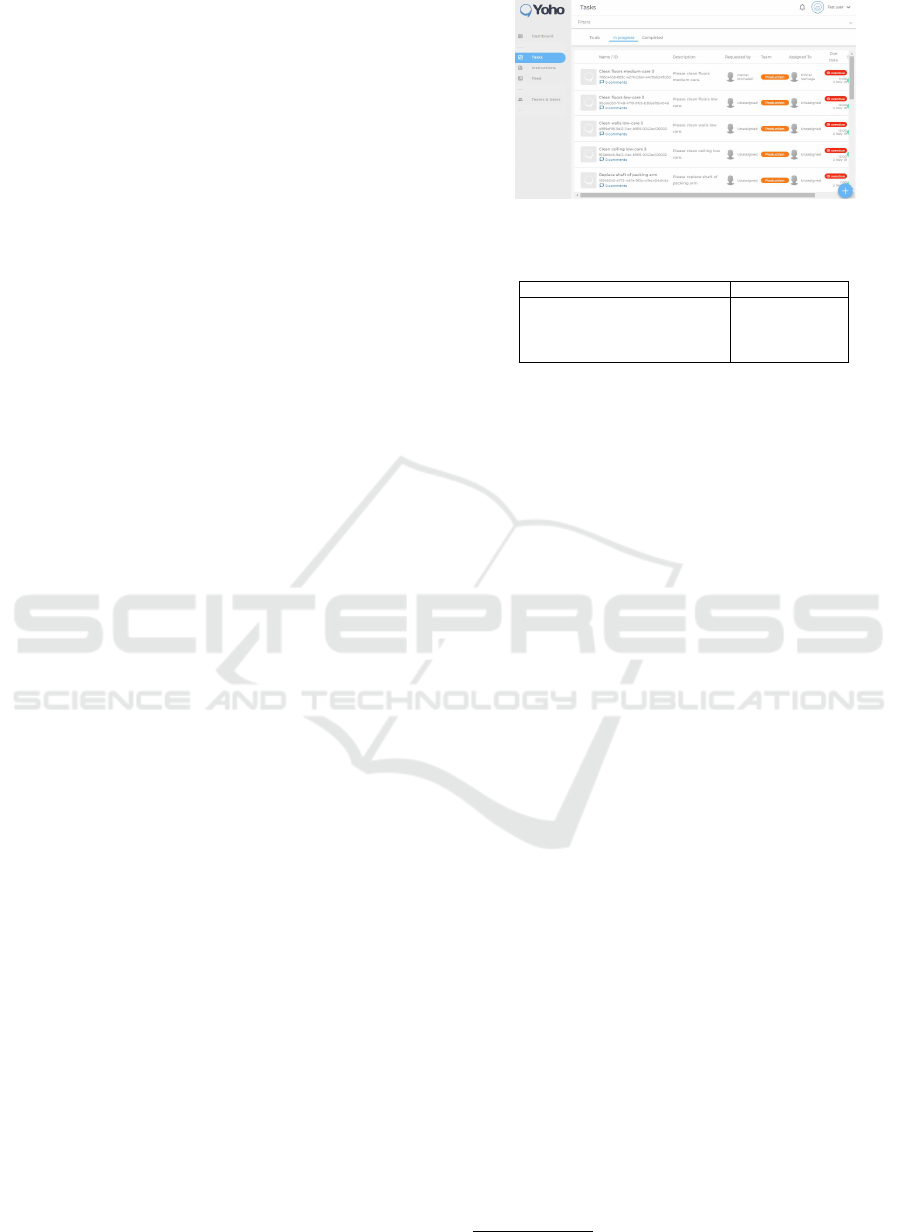
Figure 1: Excerpt of the Yoho SUT.
Table 1: Overview of the size of the Yoho SUT.
Metrics Yoho Metrics Yoho
Java Classes 569 Methods 3033
Java Classes (incl. interfaces) 709 SLOC 25099
Branches 1622 LLOC 9059
Cyclomatic Complexity 3856 Instructions 37180
the smells, suggesting developers tend to mitigate is-
sues rather than completely removing the smell.
While these studies have made important steps
in linking code smells to test quality, a gap remains
in assessing how traditional coverage metrics relate
to code smells. To the best of our knowledge, this
study is the first to assess the predictive power of
traditional coverage metrics for testing quality using
known code smells in an industrial application. We
use Testar, an open-source scriptless GUI testing tool
with proven industrial value (Bauersfeld et al., 2014),
(Pastor Ric
´
os et al., 2020), (Chahim et al., 2018),
(Pastor Ric
´
os et al., 2024). This work provides a
deeper analysis of the industrial application of script-
less testing presented in (Vos et al., 2021), contribut-
ing to the generalisation of the findings using an archi-
tectural analogy from (Wieringa and Daneva, 2015).
3 INDUSTRIAL CASE
Marviq
2
is a software development company offering
Team as a Service, Software Development as a Ser-
vice and IoT development, with a focus on integrat-
ing skilled professionals into client teams and manag-
ing entire development projects. Marviq is a small
company with 35 professionals working with agile
practices on typically eight concurrent development
projects while serving 25 clients.
As these projects are tailored to client needs, Mar-
viq applies a tailor-made Quality Assurance (QA)
process. However, QA for small companies faces
several challenges, such as unclear requirements, the
illusion that the prototype is the final product, mis-
matches between existing software and new business
processes, and insufficient time for testing (Hossain,
2
https://www.marviq.com/
The Scent of Test Effectiveness: Can Scriptless Testing Reveal Code Smells?
139

2018), (Vargas et al., 2021).
This research uses Yoho, a digital solution devel-
oped by Marviq to enhance operations and communi-
cations in industrial environments. Yoho offers fea-
tures such as alert and notification management, task
handling, work instructions, and enhanced communi-
cation tools (see Figure 1). Yoho is a software as a
service (SaaS) platform with the typical web applica-
tion functionality.
At its core, Yoho has been designed with highly
configurable options and a role-based access mech-
anism to support future requirements and customer-
specific demands. The design includes interaction
units tailored by roles, which provokes that while exe-
cuting tests, a specific role and customer would result
in a relatively low percentage of code coverage as not
all functionality would be revealed for this user.
Table 1 presents an overview of the size of Yoho.
As can be observed, the metrics presented are rep-
resentative of a real-world application. Additionally,
this SUT exposes relevant challenges, such as the dy-
namism of modern web applications (i.e., dynamic
identifiers for the GUI widgets).
Marviq currently uses SonarQube to identify code
smells in the Yoho application, providing a rich ba-
sis to evaluate the effectiveness of different coverage
metrics in testing problematic code areas.
Nevertheless, the company faces several chal-
lenges in ensuring effective software testing while
managing limited resources. To address these chal-
lenges, Marviq identified the need to explore random
and manual testing and new coverage metrics to en-
hance testing efficiency and code quality. The specific
needs driving this study are outlined below.
The Need to Conduct Random Testing with
Different Session Lengths (Need 1): To optimise
testing resources, the company aims to ensure an
effective and efficient process. Limited testing
resources make finding the optimal session length
that balances coverage and time critical. Short testing
sessions risk missing critical issues, while longer
ones may be inefficient. By experimenting with
various session lengths, the goal is to identify the best
trade-off between test coverage and resource use,
which is especially important in Agile environments
with rapid development cycles, where testing must
adapt quickly to tight time frames.
The Need for a New Coverage Metric: Code Smell
Coverage (Need 2): The company aims to ensure
not only functional correctness but also long-term
high code quality and maintainability. Traditional
metrics like code or method coverage focus on
functionality, but fail to capture maintainability and
readability aspects of the codebase. Introducing code
smell coverage addresses the need to track potential
technical debt that could accumulate unnoticed. This
metric ensures that even with high functional cov-
erage, the code remains maintainable and scalable,
reducing risks of future issues as the software evolves.
The Need to Assess Correlations between Code
Smell Coverage and Traditional Metrics (Need
3): The company seeks to determine if traditional
metrics like code and method coverage reflect overall
code quality, as high coverage does not guarantee
well-structured or maintainable code. Examining
correlations between code smell coverage and tradi-
tional metrics can identify gaps in the testing process.
Low correlation would suggest traditional metrics
may overlook maintainability concerns. This insight
can help the company develop a more holistic testing
approach that ensures both functionality and code
quality.
The Need to Compare Random Testing with Man-
ual Testing (Need 4): With limited resources for
manual testing, Marviq seeks to evaluate if random
testing can complement the existing manual testing
processes. Manual testing is labour-intensive and ex-
pensive, prompting the need for a solution that can re-
duce time and cost associated with it. Comparing the
two approaches will help determine if random testing
can detect bugs more efficiently or identify different
types of issues that manual testers may miss. The ulti-
mate goal is to enhance test coverage while reducing
the burden on manual testers, allowing them to focus
on more critical or complex scenarios.
4 EXPERIMENT DESIGN
We conducted an experiment to explore the applica-
tion of random testing on an industrial web appli-
cation to address the needs discussed in Section 3.
Specifically, the study focuses on optimising testing
resources, assessing random testing’s complementar-
ity to manual testing, and introducing innovative met-
rics like ’code smell coverage’ to monitor code qual-
ity and maintainability. We formulated the follow-
ing three research questions and their rationales to
achieve this goal.
RQ1: How do the number and length of random
scriptless GUI testing sequences impact the coverage
of testing adequacy metrics?
Rationale: This question investigates Need 1 by ex-
ploring how variations in session length affect test
coverage. The aim is to identify the optimal balance
ENASE 2025 - 20th International Conference on Evaluation of Novel Approaches to Software Engineering
140

between thoroughness and resource efficiency in Ag-
ile environments with tight testing cycles.
RQ2: How do traditional coverage metrics (e.g., code
and method coverage) relate to code smell coverage?
Rationale: This question addresses Need 2 and Need
3 by examining the relationship between traditional
and new metrics like code smell coverage. It seeks
to evaluate how well traditional metrics reflect over-
all code quality and to uncover gaps that may require
complementary approaches.
RQ3: How can random testing complement or reduce
the reliance on manual approaches?
Rationale: This question tackles Need 4, assessing
whether random testing can enhance or replace man-
ual testing. The goal is to improve test coverage while
reducing the burden on manual testing resources.
The experiment was designed following the
guidelines proposed by (Wohlin et al., 2012). More-
over, we follow a methodological framework (Vos
et al., 2012) specifically designed to evaluate testing
tools in order to encourage future secondary studies.
4.1 Variables
To address the research questions, we define the inde-
pendent and dependent variables as follows:
4.1.1 Independent Variables
The independent variables refer to the parameters we
used to configure the random scriptless GUI testing
tool. These variables include:
• Number of Random Testing Sequences: the to-
tal number of random test sequences executed.
• Number of GUI Actions per Sequence: the
number of actions executed within each test se-
quence.
• Time Delay Between Actions: the time interval
(in seconds) between two consecutive actions.
• Action Duration: the time (in seconds) taken for
each GUI action to complete.
• State Abstraction: defined by the properties of
the widgets used to represent the state of the SUT.
A concrete state encompasses all widgets and
their properties, capturing the SUT’s precise sta-
tus, which can lead to a state explosion. In con-
trast, an abstract state is a high-level representa-
tion, focusing on a relevant subset of properties.
• Initial Sequence Needed: for example, to pass a
login screen.
• Form Filling Enabled: to fill detected forms with
meaningful data.
Additionally, the parameters for detecting code
smells are treated as independent variables.
4.1.2 Dependent Variables
To answer the research questions, we measured tra-
ditional coverage metrics, such as Line Coverage
(LC), Instruction Coverage (IC), Branch Coverage
(BC), Complexity Coverage (CoC), Method Cover-
age (MC), and Class Coverage (ClC). In addition, we
defined the following variables to analyse coverage
within the state models and to quantify code smells:
• Abstract State Coverage (AbSC): The number
of abstract states covered in the state model.
• Abstract Transition Coverage (AbTC): The
number of transitions covered in the abstract state
model.
• Concrete State Coverage (CoSC): The number
of concrete states covered in the concrete state
model.
• Concrete Transition Coverage (CoTC): The
number of transitions covered in the concrete state
model.
• Code Smell Coverage (CSC): The number of
unique code smells encountered. A code smell is
considered ”covered” when the Java method con-
taining it is executed at least once during testing.
• Code Smell Occurrences (CSO): The total num-
ber of code smell instances covered during testing,
including multiple occurrences of the same smell.
4.2 Experimental Setting
To carry out the experiment, we configured Testar and
the SonarQube static analysis platform to evaluate test
coverage and code quality metrics effectively.
4.2.1 Testar Configuration
Several key configurations were implemented to op-
timise the testing of Yoho using Testar. First, we
specified the SUT by defining Yoho’s URL and estab-
lishing the necessary login procedures. This ensured
that Testar could consistently access and interact with
the application. To focus on exploring the SUT, we
applied the blocking principle (Wohlin et al., 2012),
turning off Testar’s oracles to prevent interruptions.
Testar was configured to use attributes like name,
ID, control type, and text content for widget identi-
fication. When clickable elements were defined by
CSS classes rather than standard attributes, we man-
ually configured clickability to ensure accurate test-
ing. State abstraction (SA) consisted of WebWidgetId,
The Scent of Test Effectiveness: Can Scriptless Testing Reveal Code Smells?
141

WebWidgetName, WebWidgetTextContent and Wid-
getControlType. The action abstraction followed Tes-
tar’s default configuration. Specific actions, such as
logging out or file uploads, were excluded to keep in-
teractions within the test scope.
At the start of each test run, a mandatory login se-
quence was executed using consistent credentials to
ensure a uniform starting point. Preliminary trials op-
timised time parameters, setting the action duration
to 0.5 seconds and the delay between actions to 0.8
seconds, balancing efficiency and thoroughness.
A BTrace
3
server was integrated alongside Testar
to enable real-time instrumentation of Java methods
without modifying the source code or interrupting the
normal execution of the application. Operating in a
separate environment, BTrace intercepted and logged
method calls triggered by GUI actions. Details like
method and class name, timestamp, and relevant pa-
rameters were collected to measure variables such as
CSC and CSO, as described in Section 4.1.
4.2.2 SonarQube Configuration
SonarQube (Campbell and Papapetrou, 2013) was
used to perform static analysis of the Yoho codebase,
identifying code smells and other violations. Sonar-
Qube classifies violations by severity: Blocker, Crit-
ical, Major, Minor, or Info. In our analysis, Sonar-
Qube detected 173 code smell instances, categorised
as shown in table 2 using Fowler’s (Fowler, 2018)
original classification of code smells and a more re-
cent system (Jerzyk and Madeyski, 2023).
Most detected code smells were categorised as
Object-Orientation Abusers. Conditional Complex-
ity was the most frequent, suggesting a need for bet-
ter adherence to object-oriented design patterns in the
Yoho codebase. Although only one security-related
issue was found, it was classified as Critical. This
analysis provided valuable insights, allowing us to as-
sess the prevalence and severity of code smells in re-
lation to the executed test sequences. Furthermore,
code smells in comments and dead code were ex-
cluded from the study, as they are not executable, to
ensure accurate coverage analysis and responses to
the research questions.
4.3 Experimental Procedure
We designed our experiment using three test pro-
cess configurations, each consisting of 10, 000 ac-
tions: TP100, TP500 and TP1000. Table 3 shows
the details of these configurations. Moreover, the best
configuration (TP500, as identified in the answer to
3
https://github.com/btraceio/btrace
Table 2: Code Smell Classification and Severity.
Code Smell Type Critical Major Minor
Bloaters
(26)
Data Clumps 1 0 0
Long Parameter List 0 11 0
Primitive Obsession 1 11 2
Couplers (11) Indecent Exposure 0 11 0
Dispensables
(29)
Comments 12 3 0
Dead Code 0 8 0
Lazy Class 0 0 1
Speculative Generality 0 4 1
Lex. Abusers (3) Inconsistent Naming 0 0 3
Obfuscators
(8)
Clever Code 0 1 3
Inconsistent Style 0 0 4
Object-Orientation
Abusers (95)
Conditional Complexity 0 70 0
Refused Bequest 0 3 20
Switch Statements 0 0 1
Temporary Field 0 1 0
Security (1) Vulnerability 1 0 0
Total (173) 15 123 35
Total excl. comments and dead code (150) 3 112 35
Table 3: Test Process Configurations.
Variable TP100 TP500 TP1000 TP500Forms
Test sequences 100 20 10 20
Actions per sequence 100 500 1000 500
Time delay (s) 0.8 0.8 0.8 0.8
Action duration (s) 0.5 0.5 0.5 0.5
State abstraction SA SA SA SA
Login sequence yes yes yes yes
Form filling no no no yes
RQ1 in Section 5.1) was enhanced with Testar’s ad-
vanced form filling feature to conduct the comparison
with manual testing for RQ3. Table 3 also shows the
details for this configuration (TP500Forms).
Testar’s form filling feature automatically popu-
lates forms with data. As the scriptless tool randomly
navigates through the states of the SUT, it detects
forms automatically. Upon identifying a form, Testar
generates an XML file with each key representing an
editable widget within the form, and the correspond-
ing value is an auto-generated input. The following is
an example of an automatically generated XML:
< fo rm > < da ta >
< d es c ri p ti o n > Ran dom Tex t1 < / d esc rip tio n >
< em ail > e mai l1@ e xa m ple . com < / e ma il >
< wei gh t > 50 </ wei gh t ></ d at a >
< da ta >
< em ail > e mai l2@ e xa m ple . com < / e ma il >
< wei gh t > 50 </ wei gh t ></ d at a >
</ form >
The generated input data type depends on the wid-
get type (e.g., random text for text fields or valid
email addresses for email fields). Each XML file
can define multiple weighted input sets for a form,
allowing customisation to test varied data combina-
tions. During Testar’s configuration, 23 forms with up
to six fields were automatically identified within the
SUT. Two input profiles were created per form—one
with baseline values and another with varied alterna-
tives—requiring one working day (8 hours) to edit
and test the 23 XML files. With this functionality in
ENASE 2025 - 20th International Conference on Evaluation of Novel Approaches to Software Engineering
142
TP500Forms, Testar adds a form-filling action, select-
ing an input profile based on its weight when a form
is detected.
Each experimental configuration was repeated 30
times to deal with randomness, with Testar restor-
ing the SUT’s initial state after each sequence. This
setup was used to evaluate the influence of sequence
length on coverage metrics and the relationship be-
tween code smells and traditional coverage metrics.
One experienced tester with prior knowledge of Yoho
conducted manual testing, thoroughly exploring the
system during a one-day session.
5 RESULTS
This section presents the results obtained to under-
stand the influence of sequence length on traditional
test adequacy metrics, the relationship between code
smells and traditional coverage metrics, and the com-
parison of random with manual testing.
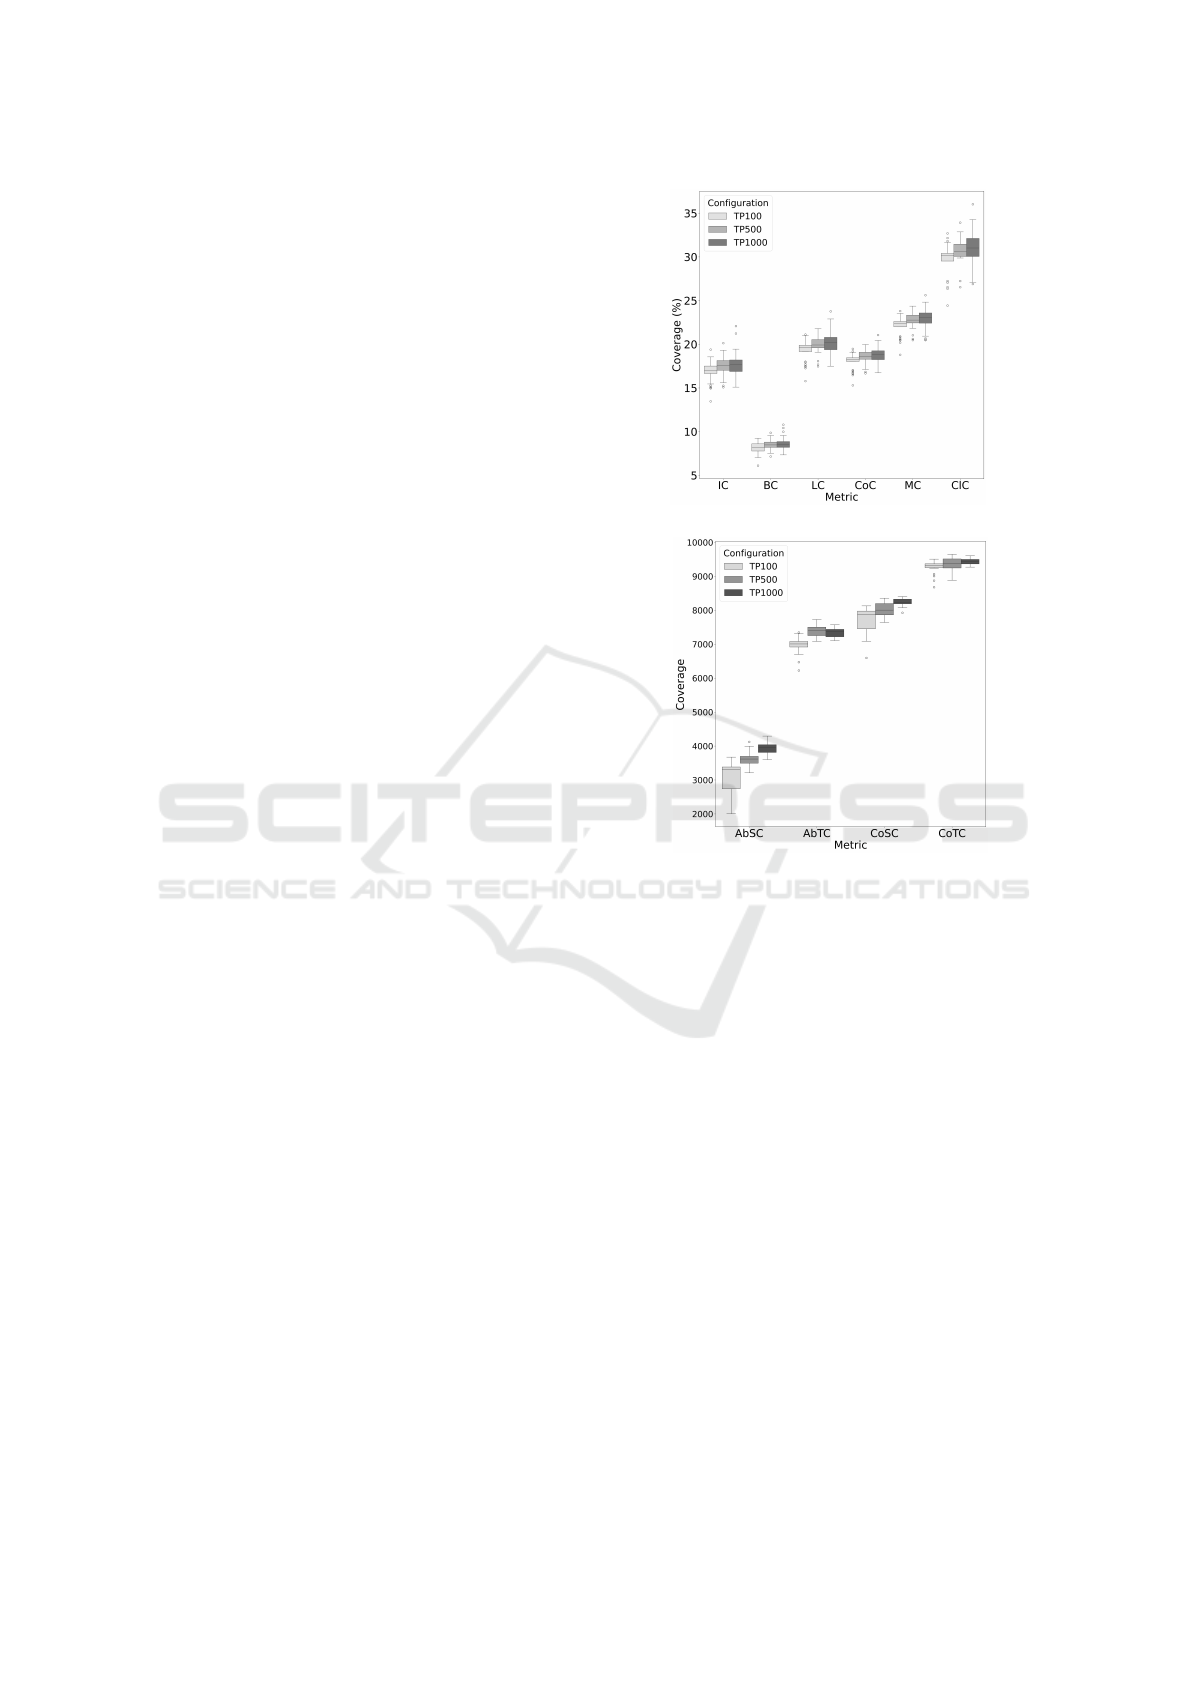
5.1 RQ1:Number and Length of Test
Sequences
Figure 2a shows box plots comparing the tradi-
tional coverage metrics across the three test runs.
The graphs reveal a consistent trend across metrics,
with coverage generally increasing from TP100 to
TP1000, though the magnitude varies by metric. In-
struction Coverage (IC) and Branch Coverage (BC)
show lower percentages with minimal variation across
test processes. Line Coverage (LC) and Complex-
ity Coverage (CoC) show moderate coverage with
slightly more variability, while Method Coverage
(MC) and Class Coverage (ClC) show the highest
coverage levels and the most noticeable differences
across configurations. TP1000 consistently achieves
higher median coverage and often larger variability,
particularly for MC and ClC. Several metrics, es-
pecially ClC, show outliers, indicating exceptionally
high or low coverage in some test runs.
For the state coverage metrics, Figure 2b illus-
trates how test runs with longer sequences lead to sig-
nificantly better coverage of both abstract and con-
crete states and transitions.
Figure 3 shows the distribution of unique code
smells covered by each configuration. Similarly, the
data suggest a trend towards higher code smell cov-
erage with test processes featuring longer sequences.
A detailed analysis revealed that 40 code smells were
covered by at least one run in each test process. Al-
though TP1000 covered more code smells on aver-
age, three smells were never covered by this test pro-
(a) Code Coverage
(b) State Model Coverage
Figure 2: Distribution of coverage metrics.
cess. TP100 and TP500 uniquely covered a smell re-
lated to the Delete Post functionality, while TP500
uniquely covered two smells associated with Delete
User. The three aforementioned code smells are clas-
sified as Major severity and fall under the Condition-
als Complexity subcategory.
Figure 4 shows the distribution and density of
code smell occurrences across test processes. Occur-
rences refer to the total number of times code with ex-
isting code smells is executed during testing. TP100
shows the lowest total of occurrences, with a nar-
row distribution centred around 7500 occurrences per
run. In contrast, TP500 and TP1000 configurations
present broader distributions with longer upper tails,
suggesting these configurations occasionally produce
runs with more interactions with smelly code.
Statistical analysis was done to test whether the
observed differences in metrics across the test con-
figurations (TP100, TP500, and TP1000) are mean-
ingful or likely due to random variation. As shown
in Table 4, we used the Kruskal-Wallis test to deter-
mine whether there was at least one significant dif-
The Scent of Test Effectiveness: Can Scriptless Testing Reveal Code Smells?
143
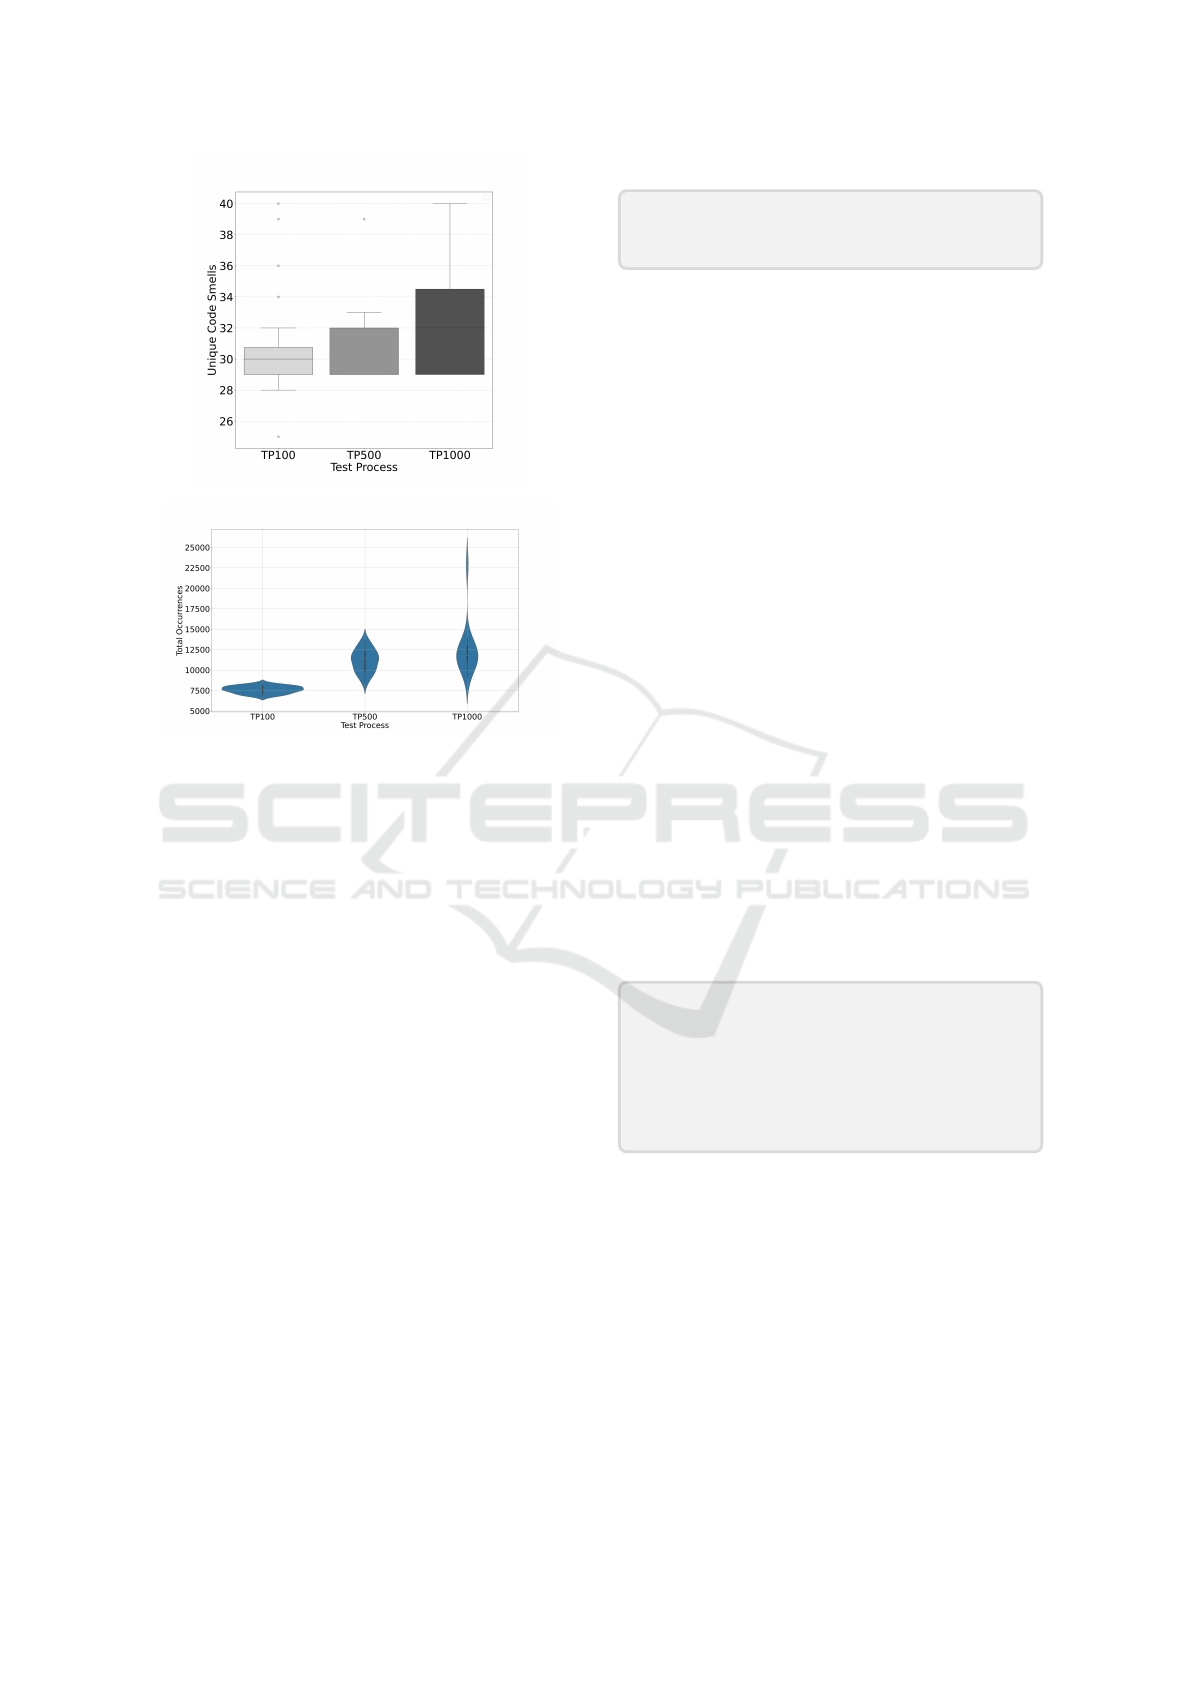
Figure 3: Distribution of code smell coverage.
Figure 4: Distribution of code smells occurrences.
ference among the test configurations for each met-
ric without assuming normal distributions. We fol-
lowed up with Mann-Whitney U tests for pairwise
comparisons, while Dunn’s test further confirmed sig-
nificance across multiple comparisons.
Code coverage metrics across the three configura-
tions revealed significant differences in several met-
rics. TP100 showed significantly lower coverage
across all metrics (except IC and BC) than TP1000
and TP500, with moderate effect sizes (0.31 to 0.38),
indicating practically meaningful differences. No sig-
nificant differences were found between TP1000 and
TP500 for traditional metrics. Regarding state met-
rics, Kruskal-Wallis tests indicated significant differ-
ences across all metrics (p < 0.001). Post-hoc analy-
sis revealed that TP100 resulted in significantly lower
coverage than TP500 and TP1000 for both AbSC and
AbTC, with large effect sizes highlighting the sub-
stantial impacts of shorter sequences on coverage lev-
els. Kruskal-Wallis and Dunn’s tests confirm signifi-
cant differences in code smell occurrences among the
configurations, with large effect sizes in comparisons
between TP100 and the other test processes.
Our results show that longer test sequences signif-
icantly improve traditional coverage metrics and in-
crease code smell occurrences. Additionally, the dis-
tribution pattern suggests that longer sequences en-
hance code smell coverage.
RQ1 Answer: longer random test sequences im-
prove traditional coverage metrics and code smell
coverage metrics.
5.2 RQ2: Relationship Between Code
Coverage Metrics
To investigate the relationship between coverage met-
rics, we calculated Spearman’s rank correlation coef-
ficients between code smell coverage and each tradi-
tional adequacy metric for all configurations. Spear-
man’s correlation is chosen due to the data’s non-
normal distribution. Results are shown in Table 5.
All correlation coefficients between code smell
coverage and traditional code metrics are statistically
significant (Table 5a), mostly indicating a moderate
correlation. The correlation with state metrics (Table
5b) is generally weak and not statistically significant.
This finding suggests that traditional coverage metrics
alone might not adequately capture a test suite’s effec-
tiveness at uncovering deeper issues like code smells,
highlighting the need for complementary metrics or
deeper analysis beyond basic coverage percentages.
Testers should consider these correlations when
designing test suites and possibly combine traditional
metrics with newer, more code-quality-focused met-
rics. Among traditional metrics, Method and Com-
plexity Coverage show the highest correlations with
Code Smell Coverage across all test processes, indi-
cating they are more reliable for exposing quality is-
sues like code smells. However, widely used metrics
like Instruction and Branch Coverage appear less re-
liable as standalone indicators of test quality.
RQ2 Answer: traditional metrics are useful, but
not sufficient alone at reflecting the ability of the
test suite to detect deeper quality issues, such as
code smells. Code Smell Coverage can be a valu-
able metric to be considered along with the tradi-
tional coverage metrics to obtain a more holistic
view of software quality and test effectiveness
5.3 RQ3: Comparison of Random with
Manual Testing
Following the analysis of RQ1 (see Section 5.1),
TP500 covered all code smells reached by TP1000
and additional ones while reaching similar code smell
coverage in most test runs with fewer resources than
TP1000. Therefore, we enhanced TP500 with the
form-filling feature to compare it with manual testing.
Figure 5 compares the scriptless testing processes,
including the enhanced test process (TP500Forms),
ENASE 2025 - 20th International Conference on Evaluation of Novel Approaches to Software Engineering
144
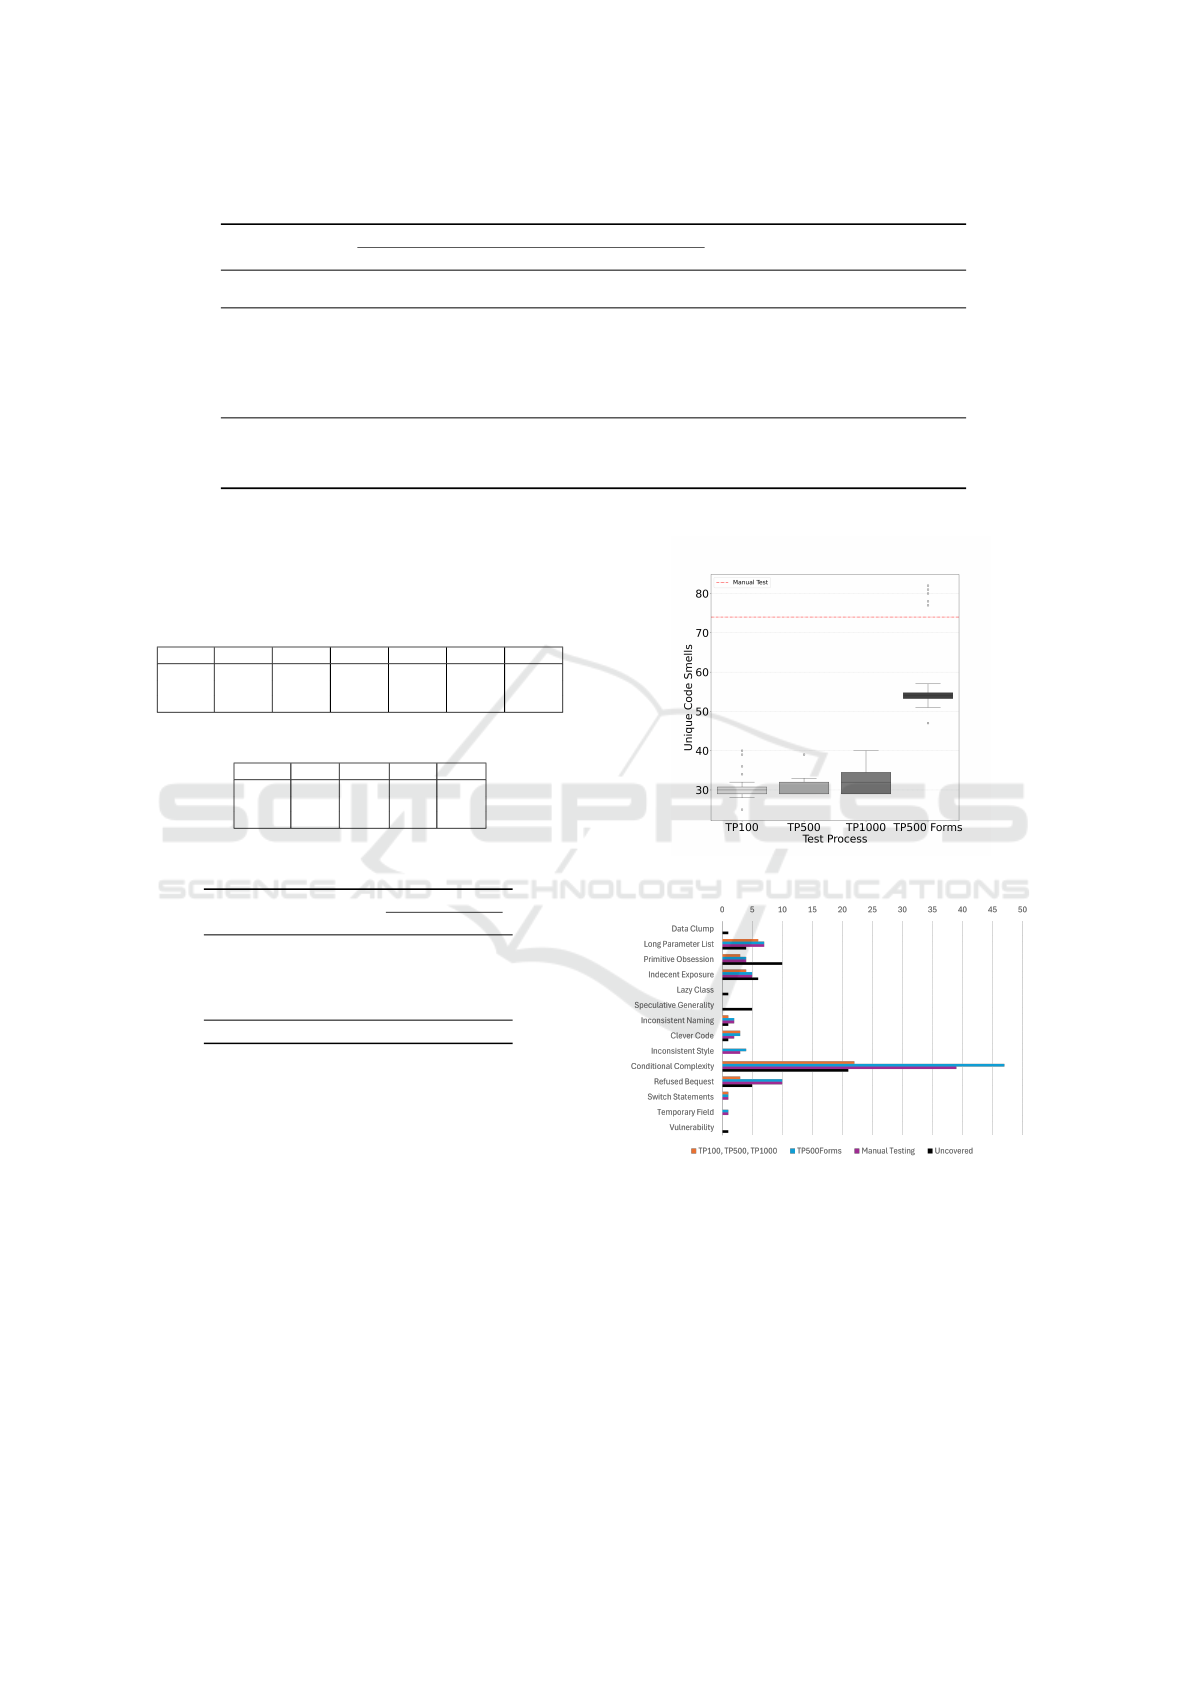
Table 4: Statistical Analysis of Code Coverage Metrics.
Metric KW
a
Mann-Whitney U (Effect Size) Significant Pairs
p-value TP1000 vs TP500 TP1000 vs TP100 TP500 vs TP100 (M-W U / Dunn’s test)
CSC 0.28 0.71 (0.05) 0.13 (0.22) 0.22 (0.18) -
CSO 0.001 0.08 (0.27) 0.001 (1) 0.001 (1) TP1000 vs TP100
b,c
, TP500 vs TP100
b,c
LC 0.049 0.77 (0.04) 0.04 (0.31) 0.03 (0.33) TP1000 vs TP100
b
, TP500 vs TP100
b
IC 0.13 0.89 (0.02) 0.09 (0.26) 0.08 (0.27) -
BC 0.09 0.71 (0.06) 0.051 (0.29) 0.07 (0.27) -
CoC 0.02 0.65 (0.07) 0.02 (0.36) 0.01 (0.38) TP1000 vs TP100
b,c
, TP500 vs TP100
b
MC 0.01 0.70 (0.06) 0.01 (0.37) 0.01 (0.38) TP1000 vs TP100
b,c
,
TP500 vs TP100
b,c
ClC 0.03 0.65 (0.07) 0.02 (0.35) 0.03 (0.34) TP1000 vs TP100
b,c
, TP500 vs TP100
b
AbSC 0.001 0.001 (0.74) 0.001 (0.99) 0.001 (0.78) all pairs
b,c
CoSC 0.001 0.28 (0.16) 0.001 (0.88) 0.001 (0.89) TP1000 vs TP100
b,c
, TP500 vs TP100
b,c
AbTC 0.001 0.001 (0.64) 0.001 (0.94) 0.001 (0.45) all pairs
b,c
CoTC 0.001 0.25 (0.18) 0.001 (0.68) 0.04 (0.31) TP1000 vs TP100
b,c
, TP500 vs TP100
b,c
a
KW: Kruskal-Wallis test
b
Significant according to Mann-Whitney U test (p < 0.05)
c
Significant according to Dunn’s test with Bonferroni correction ( p < 0.05)
Note: Bold values indicate statistical significance (p < 0.05). Effect sizes (Cliff’s delta) are shown in parentheses.
Table 5: Spearman’s Correlation: Code Smell Coverage vs
Traditional Metrics.
(a) Code Coverage Metrics
Conf. IC BC LC CoC MC ClC
TP100 .459* .393* .508** .611*** .664*** .578***
TP1000 .597*** .627*** .597*** .586*** .585*** .590***
TP500 .401* .536** .433* .451* .435* .455**
* p < 0.05, ** p < 0.01, *** p < 0.001
(b) State Coverage Metrics
Conf. AbSC AbTC CoSC CoTC
TP100 -.049 .043 -.050 -.048
TP1000 .078 -.097 -.256 -.224
TP500 .150 .212 .302 .243
Table 6: Manual Testing Coverage Results.
Metric Manual Testing
TP500Forms
Average Max
IC 43.03% 43.21% 54.50%
BC 20.53% 17.42% 21.95%
LC 49.48% 47.76% 60.01%
CC 42.09% 39.20% 49.22%
MC 51.47% 48.00% 60.27%
ClC 57.47% 72.28% 82.95%
CSC 74 57.9 82
and the manual testing results, regarding Code Smell
Coverage. TP500Forms significantly outperformed
the original TP500 test process, closing the gap with
the 74 code smells detected by manual testing. Some
runs of TP500Forms even detected up to 82 unique
code smells, surpassing the manual testing results.
The coverage metrics in Table 6 provide further
insight. While manual testing achieved slightly higher
or similar code coverage, TP500Forms exhibited
broader class exploration. Furthermore, TP500Forms
discovered more unique code smells (101) than man-
ual testing (88), suggesting that the enhanced ap-
proach can match the thoroughness of manual testing
in terms of traditional adequacy metrics and surpass it
for code smell coverage.
We analysed the types of code smells covered
(or not) by random or manual testing, as shown
Figure 5: Distribution of code smell coverage.
Figure 6: Coverage of Code Smell types.
in Figure 6. Scriptless approaches (TP100, TP500,
TP1000, and TP500Forms) covered 12 code smells
that were not reached during manual testing. Two
code smells were of Minor severity, categorised as
Clever Code and Inconsistent Style, while the re-
maining ten were classified as Conditional Complex-
ity with Major severity. These smells were associated
with two specific application functionalities (deleting
feed and task commenting), whose user stories were
not covered in manual testing.
The Scent of Test Effectiveness: Can Scriptless Testing Reveal Code Smells?
145

Despite not consistently outperforming manual
testing in individual runs, the TP500Forms configu-
ration, when considered in aggregate across all runs,
covered three additional code smells that were not
reached during manual testing or by the other ran-
dom test processes. Two of these code smells were
classified as Major. One of the new covered smells
was reached due to a random input combination of
a filtering functionality within the SUT. This was the
only newly reached code smell that did not result from
the predefined form field values. Notably, every code
smell covered by manual testing was also covered by
at least one test run of TP500Forms.
In summary, random testing identified code smells
missed by manual testing, demonstrating (again (Vos
et al., 2021; Jansen et al., 2022)) its potential as a
complementary approach. However, random testing
struggled with forms requiring specific inputs, which
manual testing handled better. The enhanced form-
based approach demonstrated comparable and even
surpassed manual testing by covering all manually
reached smells and additional ones.
RQ3 Answer: the findings suggest that random
testing offers promising complementary effective-
ness in test coverage and identifies unique smells
that manual testing might overlook.
6 DISCUSSION
To understand the impact of adopting random test-
ing and introducing the code smell coverage metric
on Marviq’s QA process, we held two one-hour fo-
cus groups with three test engineers. Marviq shared
that these additions significantly enhanced their work-
flow. While manual testing leverages testers’ domain
expertise, random testing complements it by uncov-
ering unexpected navigation paths, providing a bal-
anced approach that strengthens quality control.
The team further emphasised the value of script-
less testing as a complementary tool within their es-
tablished QA practices. Running these scriptless
tests overnight and integrating them into the CI/CD
pipeline enables a continuous and efficient testing cy-
cle. This not only enhances software robustness but
also supports the move toward continuous delivery,
reducing the need for separate acceptance testing and
optimising both time and effort per release.
Marviq also observed that once configured for
a specific project—as demonstrated with the Yoho
project (Section 4.2.1), the testing setup can be easily
adapted for other projects using similar technologies,
making it a scalable and reusable solution.
Finally, Marviq noted that monitoring coverage
metrics linked to code smells is an effective early
warning system. This proactive approach helps the
team address quality concerns early in development,
supporting the delivery of more robust software.
7 THREATS TO VALIDITY
We discuss the threats to the validity of our study fol-
lowing (Wohlin et al., 2012) and the mitigation ac-
tions taken to control them within our possibilities.
Internal Validity. The scriptless GUI testing pro-
cess’s randomness poses a potential threat. The spe-
cific sequence of actions generated during the testing
process may influence the coverage of code smells,
with different executions yielding different levels of
coverage. To mitigate this threat, we ran multiple
testing sessions with varied configurations to observe
trends and reduce the impact of randomness.
External Validity. A limitation of this study is the
use of a single SUT, selected for its role as a core sys-
tem for the company with functionalities commonly
used in web applications. While we advocate that the
selected SUT is representative of other industrial web
applications, the results may not generalise to other
applications, such as mobile or desktop software. Ad-
ditionally, reliance on SonarQube for code smell de-
tection and Testar for GUI testing may limit gener-
alisation, as other tools might yield different results.
Future research should replicate this approach with
diverse applications and testing tools to validate the
generalisation of our findings.
Construct Validity. This study uses code smells as a
proxy for software quality and testing effectiveness.
Although widely recognised as indicators of main-
tainability and quality issues, code smells may not
always directly correlate with system defects. Addi-
tionally, we rely on SonarQube for code smell detec-
tion, which may not capture all relevant issues. To ad-
dress this, we ensured that detected smells were rep-
resentative of common issues, but the limitations of
the tools should be acknowledged.
Conclusion Validity. One potential threat is the sam-
ple size of the testing actions and configurations. Al-
though we executed 10,000 actions, this may be in-
sufficient to generalise findings across all possible
scenarios in the application. Moreover, the impact
of configuration settings on code smell coverage re-
quires cautious interpretation, as some configurations
may favour certain types of code smells. To mitigate
this, we conducted experiments with varied configu-
rations, but future work should explore a wider range
of parameters to draw more robust conclusions.
ENASE 2025 - 20th International Conference on Evaluation of Novel Approaches to Software Engineering
146

8 CONCLUSIONS
This study explored the potential of random script-
less GUI testing as a complementary approach to tra-
ditional testing in an industrial setting, focusing on
Marviq’s Yoho web application. Our results indicate
that increasing the length of random test sequences
enhances both traditional coverage metrics and code
smell coverage significantly, suggesting that longer
test sequences can lead to more thorough and effec-
tive testing even within resource constraints.
The findings further suggest that while traditional
coverage metrics offer valuable insights into testing
adequacy, they are insufficient to capture the full
scope of quality issues, particularly code maintain-
ability. By integrating code smell detection with tra-
ditional metrics, we gain a more comprehensive per-
spective on software quality, addressing areas of tech-
nical debt and maintainability that may be overlooked
with conventional coverage alone.
Moreover, random GUI testing also demonstrated
a unique strength in identifying code smells missed
by manual testing, including some critical ones.
While manual testing benefits from the tester’s do-
main knowledge, random testing offers the poten-
tial of unexpected navigation paths. Therefore, the
study highlights the complementary role of random
testing alongside manual testing, as random testing
effectively identifies unique code smells that man-
ual efforts might miss. This synergy between testing
methods enhances overall test coverage, potentially
reducing reliance on manual testing and enabling a
more resource-efficient approach to quality assurance
in software development.
In conclusion, combining functional coverage
metrics with maintainability-focused analyses, such
as code smell detection, provides a robust and effi-
cient testing framework that better aligns with indus-
trial needs. This approach offers a deeper and more
accurate assessment of software quality, covering as-
pects of both functionality and maintainability.
Future work will extend our experimentation
across a broader range of web applications and soft-
ware platforms and different industrial contexts with
varying resources, system configurations, and mainte-
nance requirements. This expansion will help to im-
prove the generalizability and reliability of our find-
ings beyond the specific conditions of this study. Ad-
ditionally, we aim to develop an AI-driven agent that
guides GUI exploration by targeting areas of broad
smell coverage, potentially increasing the precision
and effectiveness of code smell detection. This AI-
guided approach could pave the way for more efficient
and quality-focused testing methodologies.
ACKNOWLEDGMENTS
The authors thank the Marviq and Testar developers.
The following projects have funded this research: Au-
tolink, Enactest
4
, IVVES
5
REFERENCES
Al
´
egroth, E., Feldt, R., and Kolstr
¨
om, P. (2016). Mainte-
nance of automated test suites in industry: An em-
pirical study on visual gui testing. Information and
Software Technology, 73:66–80.
Alshahwan, N. and Harman, M. (2011). Automated web
application testing using search based software engi-
neering. In 26th ASE, pages 3–12. IEEE.
Amalfitano, D., Amatucci, N., Memon, A., Tramontana,
P., and Fasolino, A. (2017). A general framework
for comparing automatic testing techniques of android
mobile apps. Journal of Systems and Software, 125.
Amalfitano, D., Riccio, V., Amatucci, N., Simone, V. D.,
and Fasolino, A. (2019). Combining automated gui
exploration of android apps with capture and replay
through machine learning. Information and Software
Technology, 105:95–116.
Bauersfeld, S., Vos, T., Condori-Fern
´
andez, N., Bagnato,
A., and Brosse, E. (2014). Evaluating the testar tool
in an industrial case study. In 8th ACM/IEEE ESEM.
Bavota, G., De Lucia, A., Di Penta, M., Oliveto, R., and
Palomba, F. (2015). An experimental investigation on
the innate relationship between quality and refactor-
ing. Journal of Systems and Software, 107:1–14.
Bons, A., Mar
´
ın, B., Aho, P., and Vos, T. (2023). Scripted
and scriptless gui testing for web applications: An in-
dustrial case. Information and Software Technology.
Campbell, G. A. and Papapetrou, P. P. (2013). SonarQube
in action. Manning Publications Co.
Chahim, H., Duran, M., and Vos, T. (2018). Challenging
testar in an industrial setting: the rail sector. Informa-
tion Systems Development: Designing Digitalization.
Choudhary, S., Gorla, A., and Orso, A. (2015). Automated
test input generation for android: Are we there yet?(e).
In 30th ASE, pages 429–440. IEEE.
Codabux, Z. and Williams, B. J. (2016). Technical debt pri-
oritization using predictive analytics. In Proceedings
of the 38th International Conference on Software En-
gineering Companion, pages 704–706.
Collins, E., Neto, A., Vincenzi, A., and Maldonado, J.
(2021). Deep reinforcement learning based android
application gui testing. In XXXV Brazilian Symposium
on Software Engineering, pages 186–194.
Fontana, F., Ferme, V., Zanoni, M., and Roveda, R. (2015a).
Towards a prioritization of code debt: A code smell in-
tensity index. In 7th International Workshop on Man-
aging Technical Debt (MTD), pages 16–24. IEEE.
4
https://enactest-project.eu/
5
https://www.ivves.eu
The Scent of Test Effectiveness: Can Scriptless Testing Reveal Code Smells?
147

Fontana, F., Ferme, V., Zanoni, M., and Yamashita, A.
(2015b). Automatic metric thresholds derivation for
code smell detection. In 6th Int. Workshop on Emerg-
ing Trends in Software Metrics, pages 44–53. IEEE.
Fowler, M. (2018). Refactoring: improving the design of
existing code. Addison-Wesley Professional.
Gligoric, M., Groce, A., Zhang, C., Sharma, R., Alipour,
M., and Marinov, D. (2013). Comparing non-adequate
test suites using coverage criteria. In Int. Symposium
on Software Testing and Analysis, pages 302–313.
Gondra, I. (2008). Applying machine learning to software
fault-proneness prediction. Journal of Systems and
Software, 81(2):186–195.
Hemmati, H. (2015). How effective are code coverage crite-
ria? In International Conference on Software Quality,
Reliability and Security, pages 151–156. IEEE.
Hossain, M. (2018). Challenges of software quality assur-
ance and testing. International Journal of Software
Engineering and Computer Systems, 4(1):133–144.
Inozemtseva, L. and Holmes, R. (2014). Coverage is not
strongly correlated with test suite effectiveness. In
36th ICSE, pages 435–445. ACM.
Jansen, T., Pastor Ric
´
os, F., Luo, Y., van der Vlist, K., van
Dalen, R., Aho, P., and Vos, T. (2022). Scriptless gui
testing on mobile applications. In IEEE QRS.
Jerzyk, M. and Madeyski, L. (2023). Code smells: A com-
prehensive online catalog and taxonomy. In Devel-
opments in Information and Knowledge Management
Systems for Business Applications. Springer.
Kochhar, P., Thung, F., and Lo, D. (2015). Code coverage
and test suite effectiveness: Empirical study with real
bugs in large systems. In 22nd SANER. IEEE.
Madeyski, L. (2010). The impact of test-first programming
on branch coverage and mutation score indicator of
unit tests: An experiment. Information and Software
Technology, 52(2):169–184.
Martino, S., Fasolino, A., Starace, L., and Tramontana, P.
(2024). GUI testing of android applications: Investi-
gating the impact of the number of testers on different
exploratory testing strategies. J. Softw. Evol. Process.
Memon, A. (2002). Gui testing: Pitfalls and process. Com-
puter, 35(08):87–88.
Memon, A. and Xie, Q. (2005). Studying the fault-detection
effectiveness of gui test cases for rapidly evolving
software. IEEE transactions on software engineering.
Olbrich, S., Cruzes, D., and Sjøberg, D. (2010). Are all
code smells harmful? a study of god classes and brain
classes in the evolution of three open source systems.
In Int. conf. on software maintenance. IEEE.
Pastor Ric
´
os, F., Aho, P., Vos, T., Torres, I., Cal
´
as, E., and
Mart
´
ınez, H. (2020). Deploying testar to enable re-
mote testing in an industrial ci pipeline: a case-based
evaluation. In 9th ISoLA, pages 543–557. Springer.
Pastor Ric
´
os, F., Mar
´
ın, B., Prasetya, I., Vos, T., Davidson,
J., and Hovorka, K. (2024). An industrial experience
leveraging the iv4xr framework for bdd testing of a 3d
sandbox game. In 18th RCIS. Springer.
Pereira dos Reis, J., Brito e Abreu, F.,
de Figueiredo Carneiro, G., and Anslow, C. (2022).
Code smells detection and visualization: a systematic
literature review. Archives of Computational Methods
in Engineering, 29(1):47–94.
Pradhan, S., Ray, M., and Patnaik, S. (2019). Coverage cri-
teria for state-based testing: A systematic review. In-
ternational Journal of Information Technology Project
Management (IJITPM), 10(1):1–20.
Rahman, M., Ahammed, T., Joarder, M., and Sakib, K.
(2023). Does code smell frequency have a relationship
with fault-proneness? In 27th EASE, pages 261–262.
Rodr
´
ıguez-Valdes, O., Vos, T., Aho, P., and Mar
´
ın, B.
(2021). 30 years of automated gui testing: a biblio-
metric analysis. In QUATIC, pages 473–488. Springer.
Sae-Lim, N., Hayashi, S., and Saeki, M. (2018). Context-
based approach to prioritize code smells for prefactor-
ing. Journal of Software: Evolution and Process.
Spadini, D., Palomba, F., Zaidman, A., Bruntink, M., and
Bacchelli, A. (2018). On the relation of test smells to
software code quality. In 34th ICSME. IEEE.
Staats, M., Gay, G., Whalen, M., and Heimdahl, M. (2012).
On the danger of coverage directed test case genera-
tion. In 15th FASE, pages 409–424. Springer.
Tengeri, D., Besz
´
edes,
´
A., Gergely, T., Vid
´
acs, L., Havas,
D., and Gyim
´
othy, T. (2015). Beyond code cover-
age—an approach for test suite assessment and im-
provement. In 8th ICST Workshops, pages 1–7. IEEE.
Tramontana, P., Amalfitano, D., Amatucci, N., Memon, A.,
and Fasolino, A. (2019). Developing and evaluating
objective termination criteria for random testing. ACM
Trans. Softw. Eng. Methodol., 28(3).
van der Brugge, A., Pastor-Ric
´
os, F., Aho, P., Mar
´
ın, B.,
and Vos, T. (2021). Evaluating testar’s effectiveness
through code coverage. XXV Jornadas de Ingenier
´
ıa
del Software y Bases de Datos (JISBD), pages 1–14.
Vargas, N., Mar
´
ın, B., and Giachetti, G. (2021). A list of
risks and mitigation strategies in agile projects. In
40th Int. Conf. SCCC, pages 1–8. IEEE.
Vos, T., Aho, P., Pastor Ricos, F., Rodriguez-Valdes, O.,
and Mulders, A. (2021). TESTAR – scriptless test-
ing through graphical user interface. Software Testing,
Verification and Reliability, 31(3).
Vos, T., Mar
´
ın, B., Escalona, M., and Marchetto, A. (2012).
A methodological framework for evaluating software
testing techniques and tools. In 12th int. conference
on quality software, pages 230–239. IEEE.
Wang, W., Li, D., Yang, W., Cao, Y., Zhang, Z., Deng, Y.,
and Xie, T. (2018). An empirical study of android test
generation tools in industrial cases. In 33rd ASE.
Wieringa, R. and Daneva, M. (2015). Six strategies for
generalizing software engineering theories. Science
of computer programming, 101:136–152.
Wohlin, C., Runeson, P., H
¨
ost, M., Ohlsson, M., Regnell,
B., and Wessl
´
en, A. (2012). Experimentation in soft-
ware engineering. Springer.
Yu, S., Fang, C., Li, X., Ling, Y., Chen, Z., and Su,
Z. (2024). Effective, platform-independent gui test-
ing via image embedding and reinforcement learn-
ing. ACM Transactions on Software Engineering and
Methodology, 33(7).
ENASE 2025 - 20th International Conference on Evaluation of Novel Approaches to Software Engineering
148
