
Impact of Fleet Electrification and Charging Infrastructure on
Free-Floating Car Sharing in Milan
Sofia Borgosano
1 a
, Alessandro Nocera
2
, Michela Longo
1 b
and Wahiba Yaici
3 c
1
Department of Energy, Politecnico di Milano, Via Lambruschini 6, Milano, Italy
2
Politecnico di Milano, Via Lambruschini 6, Milano, Italy
3
CanmetENERGY Research Centre, Natural Resources Canada, Ottawa, Canada
fi
Keywords:
Electric Vehicles, Electric Car Sharing, Public Transportation, Charging Methods.
Abstract:
The automotive industry’s transition toward sustainability has prioritized Electric Vehicles (EVs) due to their
potential to reduce pollution and improve energy efficiency. This evolution is particularly critical in urban
contexts such as Milan, where free-floating car sharing services present unique challenges and opportunities
for electrification. The integration of EVs into car sharing fleets demands careful consideration of battery
autonomy, charging times, and the distribution of charging infrastructure to meet high vehicle utilization rates.
This study evaluates the feasibility of transitioning Milan’s internal combustion car-sharing fleet to an electric
model, analyzing technical and operational challenges through a scenario-based simulation approach.
1 INTRODUCTION
Urbanization is rapidly reshaping global mobility. By
2050, an estimated 6.3 billion people will reside in
urban areas, posing significant challenges for urban
mobility systems (Moss, 2012). Transportation net-
works, essential for the movement of people and
goods within and between cities, will need to evolve
to address growing demand, congestion, and environ-
mental concerns (Colombo et al., 2023). This con-
text underscores the necessity of rethinking mobil-
ity strategies to achieve more efficient and sustain-
able urban transport systems. Traditional car sharing
has gained prominence as an effective solution to re-
duce private car ownership, optimize vehicle utiliza-
tion, and reduce the environmental impact of urban
transportation (Hensher, 2018) (Weibin et al., 2018).
Car sharing is experiencing rapid global growth, with
user bases and fleets expanding significantly. For ex-
ample, from 2022 to 2027, the number of car shar-
ing users is expected to increase at a Compound An-
nual Growth Rate (CAGR) of 16. 9% (Cederqvist,
2023). However, reliance on Internal Combustion En-
gine (ICE) vehicles in many traditional car sharing
services limits their overall environmental benefits.
a
https://orcid.org/0009-0005-6334-4630
b
https://orcid.org/0000-0002-3780-4980
c
https://orcid.org/0000-0002-6142-9180
Although car sharing reduces the total number of ve-
hicles on the road, ICE-powered fleets still contribute
to urban air pollution and greenhouse gas emissions.
To overcome these limitations, the industry is increas-
ingly turning to Electric Car Sharing (ECS), which
integrates the operational advantages of car sharing
with the environmental benefits of battery electric ve-
hicles (BEVs) (Perboli et al., 2018). Electric car shar-
ing offers significant potential to amplify the envi-
ronmental benefits of shared mobility by incorporat-
ing zero-emission vehicles into fleets. BEVs produce
no tailpipe emissions, reducing air pollution and con-
tributing to cleaner urban environments. In addition,
they support the transition to more sustainable energy
systems, particularly when charged using renewable
energy sources. As a result, ECS has become a grow-
ing focus in the shared mobility sector, with an in-
creasing number of operators adopting Electric Ve-
hicles (EVs). In 2019, 66% of the global car shar-
ing services included electric vehicles in their fleets,
demonstrating the trend towards cleaner transporta-
tion solutions (Nicholas and Bernard, 2021). De-
spite its potential, the feasibility of ECS largely de-
pends on the availability, efficiency, and distribution
of charging infrastructure. Charging stations differ
in speed, with some enabling fast charging within
minutes, while others require several hours for a full
charge. This variability can be challenging for EV
Borgosano, S., Nocera, A., Longo, M. and Yaici, W.
Impact of Fleet Electrification and Charging Infrastructure on Free-Floating Car Sharing in Milan.
DOI: 10.5220/0013360300003941
In Proceedings of the 11th International Conference on Vehicle Technology and Intelligent Transport Systems (VEHITS 2025), pages 537-542
ISBN: 978-989-758-745-0; ISSN: 2184-495X
Copyright © 2025 by Paper published under CC license (CC BY-NC-ND 4.0)
537

users, who must plan charging around station avail-
ability while accounting for potential queuing times
(Rauf et al., 2023).
The effectiveness of electric car-sharing depends
on overcoming critical challenges such as charging
point accessibility, system interoperability, and com-
patibility with vehicle usage patterns (Liao and Cor-
reia, 2021). Various studies have proposed models
to simulate vehicle charging and assess its impact on
the power grid (Hammerschmitt et al., 2024), as well
as simulate energy consumption (Genikomsakis and
Mitrentsis, 2017; Gerossier et al., 2019). However,
for vehicles used in car-sharing, predicting routes and
driving styles is difficult due to the fact that they
can be rented by different individuals for a variety
of purposes. This variability significantly impacts the
charging needs.
This study aims to tackle a critical issue for the
city of Milan, focusing on facilitating the widespread
adoption and effectiveness of an all-electric car-
sharing solution. It achieves this by analyzing real-
world demand and evaluating various charging tech-
nologies, such as conventional charging stations,
wireless charging systems, and battery swapping so-
lutions. The study assesses whether transitioning the
fleet to EVs can be sustainable and evaluates which
charging methods are best suited to meet the system’s
needs.
2 METHODOLOGIES
This section outlines the methodologies adopted to
simulate the feasibility of transitioning a car shar-
ing service from an ICE fleet to a BEV fleet, taking
into account the compatibility with the autonomy of
the BEV and the distribution and performance of the
charging infrastructure.
2.1 Scope and Simulation Algorithm
The simulation aims to verify whether the car shar-
ing demand observed with ICE vehicles can be effec-
tively met using BEVs. The system must ensure that
each BEV chosen by a user has sufficient energy to
complete the rental. Modeling car sharing demand is
particularly complex due to the interdependence be-
tween vehicle availability and the number of trips, es-
pecially in free-floating services where vehicles can
be left in any parking space within the service area.
This creates uncertainty regarding vehicle availabil-
ity for subsequent users. To address this, the simu-
lation focuses on representing vehicle availability at
a local level and tracking individual trips with high
spatial and temporal resolution. In addition to ana-
lyzing origin-destination flows, it also estimates en-
ergy consumption and kilometers traveled per rental.
Since two rentals with the same start and end points
may involve different routes, statistical models of mo-
bility demand would be imprecise for calculating en-
ergy consumption. Therefore, a data-driven approach
is employed, relying on existing usage data. Despite
its limitations, this approach aligns with the goal of
comparing BEV and charging infrastructure scenar-
ios, rather than planning operational details of the
car sharing service. Key simplifying assumptions in-
clude:
• Users must recharge BEVs only when the State
of Charge (SOC) falls below a scenario-defined
threshold, potentially requiring them to detour to
the nearest charging station.
• No staff assistance for vehicle recharging is con-
sidered.
• The existing charging infrastructure in Milan is
assumed to have uniform characteristics and com-
patibility with all BEVs in the scenarios.
• BEV range, charging times, and management are
not assumed to impact the demand trends ob-
served with ICE vehicles.
The simulation comprises the following steps:
1. Energy Consumption Calculation (E): The energy
consumption for each trip was calculated based
on the real consumption of the diesel car on that
specific route, using Equation 1. In this equation,
G represents the liters of gasoline used per trip,
c
gas
denotes the fuel consumption rate of an inter-
nal combustion engine (ICE) vehicle, expressed in
liters per kilometer (L/km) and c
el
represents the
specific energy consumption of the selected EV.
E =
G
c
gas
· c
el
[kW h]
(1)
2. SOC Calculation: The initial and final SOC for
each trip are computed. If the SOC after a trip
falls below the threshold, recharging is simulated.
The SOC for the next rental depends on the energy
recharged between rentals.
3. Charging Management: Charging is simulated to
stop either when the SOC reaches 100% or a
minimum of 20%. Charging during a trip as-
sumes sufficient time to reach a charging station
and continue the journey. The percentage of bat-
tery recharge (SOC
rec
) over a time interval (∆t)
depends on the power provided by the charging
method (P) and the battery capacity of the se-
lected vehicle (C
batt
) as reported in Eq. 2.
VEHITS 2025 - 11th International Conference on Vehicle Technology and Intelligent Transport Systems
538

SOC
rec
=
∆t · P
C
batt
· 100
(2)
Figure 1 visually represents the algorithmic flow
for managing the SOC in an electric car sharing sce-
nario.
Figure 1: Recharging algorithm.
It outlines how vehicle energy levels are calcu-
lated and adjusted throughout a rental process, as well
as during transitions between rentals. The starting
point of the algorithm calculates the SOC at the begin-
ning of a rental, then based on the kilometers driven
and vehicle consumption rate, the energy used during
the rental is determined. The final SOC is updated
by subtracting the consumed energy from the initial
SOC. If the SOC falls below a specified threshold,
the algorithm incorporates a recharging event, either
mid-rental or at the end of the trip. When a recharge
occurs, the SOC is adjusted to reflect the additional
energy gained, constrained by battery capacity. If the
final SOC of one rental is sufficient for the next user,
the car is made available; otherwise, it is assumed to
undergo recharging.
2.2 Performance Metrics
The algorithm is applied to various scenarios, each us-
ing a single type of BEV and charging infrastructure.
The performance of each scenario is assessed using
several key metrics that provide insight into the oper-
ational feasibility and efficiency of transitioning to a
BEV-based car sharing system.
One important metric is the number of unfeasible
rentals. These represent instances where a rental can-
not be completed because the vehicle’s battery charge,
or SOC, is insufficient to meet the energy demands
of the trip. Such cases highlight the limitations of
BEV autonomy under specific conditions or charg-
ing infrastructure availability. Another critical mea-
sure is charging during rentals. This metric reflects
how often users would need to interrupt their trips to
recharge the vehicle mid-journey. It provides an indi-
cation of the practicality of the BEV fleet, especially
in scenarios with longer rental distances or sparse
charging infrastructure. Similarly, charging at rental
end is evaluated, referring to the number of rentals
that require a recharge at the conclusion of the trip
due to the SOC falling below the minimum threshold.
This metric captures the impact of low battery levels
on subsequent vehicle availability for the next user.
The analysis also considers the average distance to
charging points, which represents the typical detour a
user would need to make to reach the nearest charging
station when recharging is necessary. A longer detour
can increase inconvenience for users and potentially
deter them from adopting the service. Finally, the
number of feasible rentals is examined. This metric
indicates how many rentals can be completed without
the need for mid-trip recharging or disruptions due
to SOC limitations. A higher proportion of feasible
rentals suggests better alignment between BEV capa-
bilities, user demand, and the charging infrastructure.
These metrics collectively provide a comprehen-
sive evaluation of the system’s performance, helping
to identify strengths, weaknesses, and areas for im-
provement in different scenarios.
3 CASE STUDY
The dataset was compiled from car-sharing records,
focusing on ICE vehicles. Vehicle availability was
tracked at regular intervals, capturing essential details
such as location, timestamp, and fuel level. Although
the data does not allow for full route reconstruction, it
provides valuable insights into mobility patterns by
identifying trip start and end points, duration, and
fuel consumption. This information serves as a basis
for analyzing vehicle utilization and operational effi-
ciency. Trip duration was inferred by examining the
time elapsed between consecutive stops for each vehi-
cle. However, only key trip attributes—such as depar-
ture and arrival locations, travel time, and fuel level
variations—are available, while the exact routes taken
remain unknown. The subsequent analysis focuses on
Impact of Fleet Electrification and Charging Infrastructure on Free-Floating Car Sharing in Milan
539

the spatial distribution of stops, vehicle availability
trends, trip and stop durations, refueling patterns, and
fuel consumption.
Table 1 outlines the vehicle categories considered
in this study, organized by battery capacity and en-
ergy consumption. It includes several types of small
vehicles, emphasizing their versatility and appropri-
ateness for urban settings.
Table 1: Vehicles characteristics.
Category C
batt
e
cons
[kWh] [kWh/km]
Small A 17.6 0.175
Small B 42 0.146
Small C 10.3 0.075
Medium 57.5 0.143
Large 90 0.208
The analysis considers three main charging meth-
ods, with varying power capacities, commonly used
in Milan for both quick and fast charging. The lo-
cation of all the charging infrastructure has been as-
sessed based on the existing positions of public charg-
ers, as shown in Figure 2 (Electromaps, 2024).
Figure 2: Actual distribution of charging station in Milan.
A total of 143 charging stations have been added
in the last six months, and 304 in the last 12 months.
This data provides valuable insight into the rapid pace
at which charging stations are being installed across
the city. There are currently 2,643 connectors, with
the majority being of type 2. The following charging
infrastructures has been analyzed:
• Conductive Charging: This method involves fixed
charging points at specific locations throughout
all scenarios. The power capacities for these
points are 7 kW, 22 kW, and 110 kW, catering to
different charging speed needs.
• Wireless Charging: This technology allows for a
more convenient charging process, as it doesn’t
require physical connection to the vehicle. It is
assumed that the wireless system will be available
for vehicles with a SOC below 40%. The power
levels considered for wireless charging are 3 kW,
7 kW, and 11 kW.
• Battery Swap: This method resembles tradi-
tional refueling, where the vehicle’s battery is ex-
changed for a fully charged one in just a few min-
utes. For vehicles in category Big, it is assumed
that the infrastructure consists of automated Bat-
tery Swapping Stations, enabling a quick and
seamless transition. In contrast, for vehicles in
category Small C, the process requires operator
intervention to perform the battery swap.
3.1 Analysis of the Results
Figure 3 provides a comprehensive summary of the
simulation results across all scenarios, with data aver-
aged on a daily basis. Each row corresponds to a sce-
nario derived from a combination of a specific BEV
model and charging infrastructure, while the columns
contain key performance indicators used to evaluate
the scenario.
The study revealed significant variability in the
feasibility and efficiency of electric carsharing trips
based on the combination of charging methods and
BEV models. Across all scenarios, the percent-
age of feasible trips—those completed without re-
quiring user behavior changes—ranged from 55% to
92%. Scenarios utilizing Battery Swap and high-
power conductive charging (110kW) performed the
best, with feasible trip percentages exceeding 90% in
most cases. Conversely, Inductive charging at 3kW
showed the poorest performance, with feasible trips
dropping to as low as 55% for smaller battery vehi-
cles, like the ForTwo. A key priority for improving
carsharing systems is the reduction of unfeasible trips,
as shown in Figure 4, which ranks the 32 scenarios
based on the Unfeasible Rentals metric. In all the
cases the percentage reminas below the 16% across
all scenarios with values dropping to less than 1% in
favorable scenarios (e.g., Battery Swap and 110kW
conductive charging). Battery Swap and Conductive
110kW consistently rank as the top-performing meth-
ods, recording unfeasible trip rates of approximately
1%, regardless of the vehicle type. However, in sub-
sequent scenarios, vehicles like the XEV YOYO and
the Tesla Model 3 emerge as strong performers. When
paired with Conductive 22kW, Inductive 11kW, or In-
ductive 7kW charging, these models maintain unfea-
sible trip rates of around 3%, showcasing their adapt-
ability to mid-tier charging solutions.
VEHITS 2025 - 11th International Conference on Vehicle Technology and Intelligent Transport Systems
540
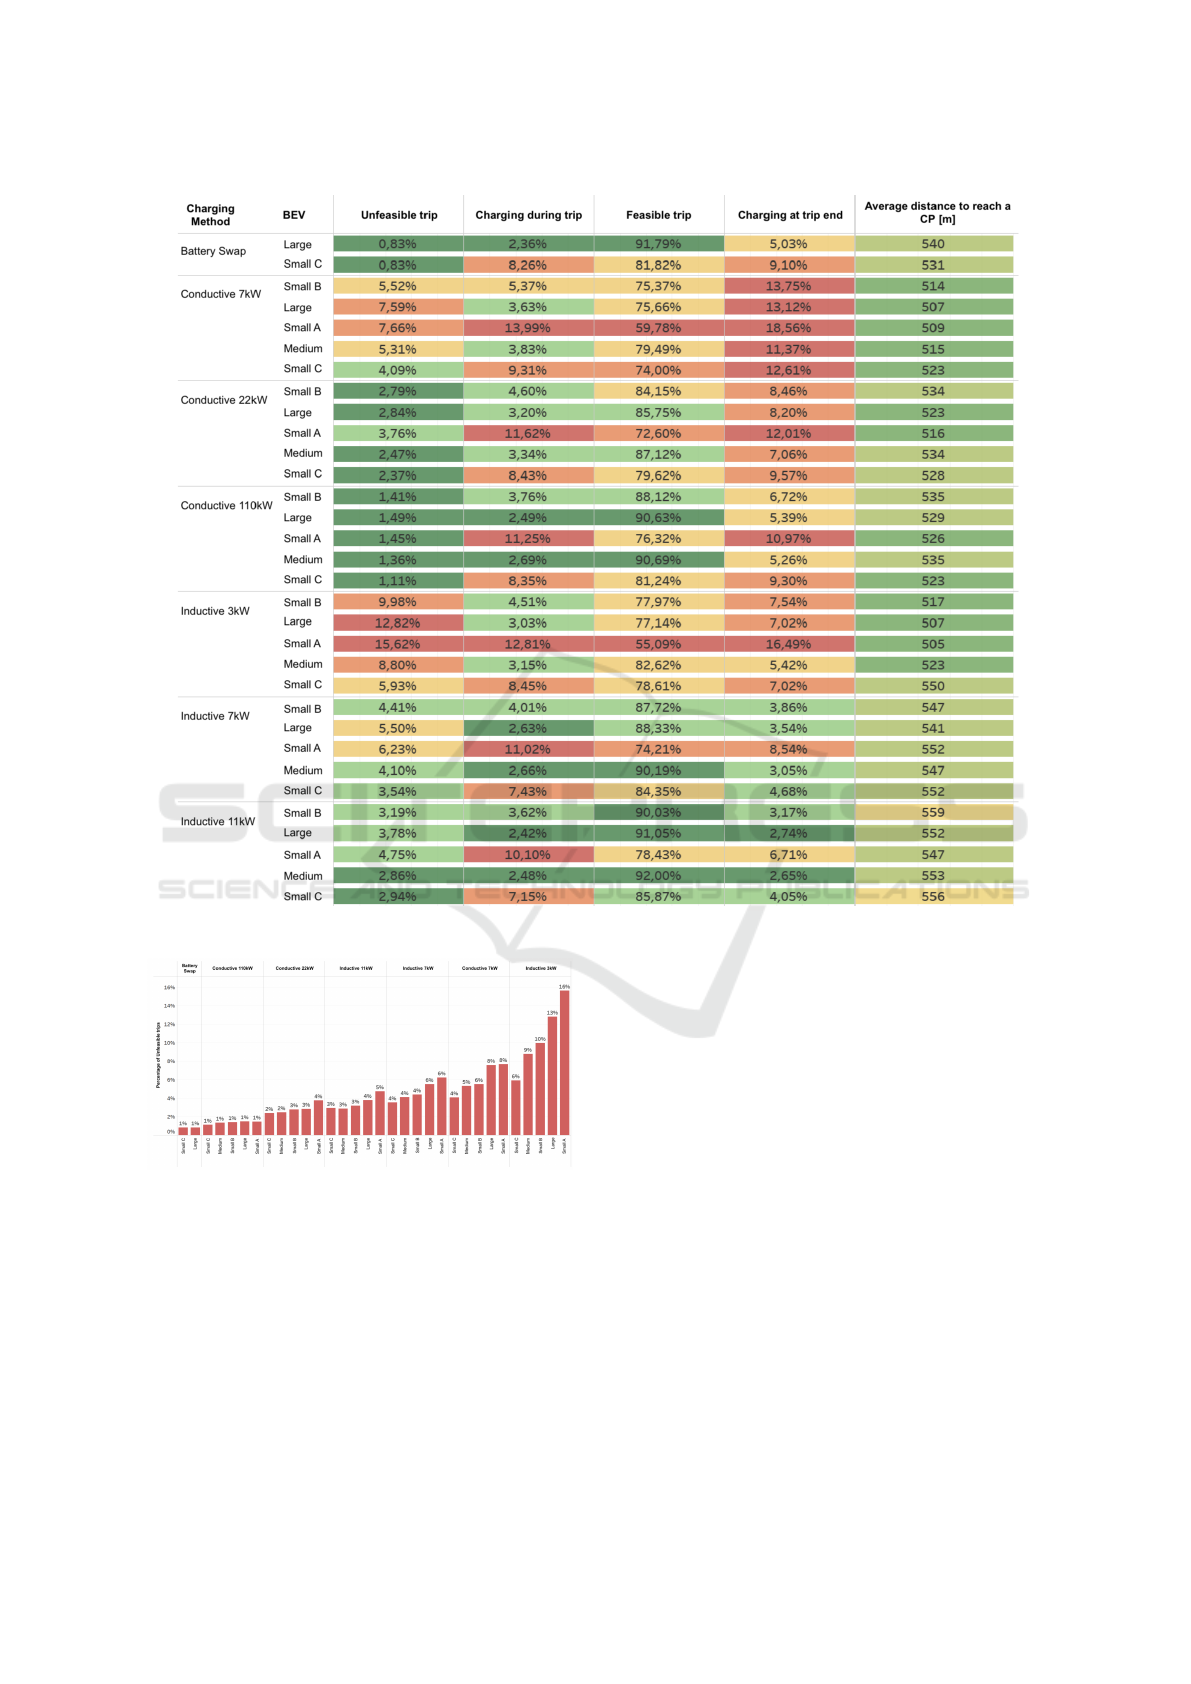
Figure 3: KPI analysis for each vehicle.
Figure 4: Unfeasible trips scenario comparison.
While BSS and Conductive 110kW charging are
clearly superior in terms of performance, their imple-
mentation poses significant challenges. These include
high costs, extensive infrastructure requirements, and
compatibility issues, especially with existing electric
vehicle models and networks. To maximize their po-
tential, careful planning, targeted investments, and a
phased deployment strategy will be critical. Mid-tier
solutions like Conductive 22kW and Inductive 11kW
provide a compelling compromise, especially for ve-
hicles with moderate to large batteries such as the
Tesla Model 3. These options strike a balance be-
tween performance and practicality, delivering rela-
tively low unfeasible trip rates while being more af-
fordable and easier to deploy at scale. This rein-
forces the need for a tiered approach to charging in-
frastructure, where high-power solutions are reserved
for high-demand locations, and mid-power solutions
are implemented more broadly to ensure accessibil-
ity and efficiency. Lastly, it is important to highlight
that the average distance between end-of-rental points
requiring charging and the nearest charging station re-
mains relatively stable across both the days analyzed
and the simulated charging scenarios. These distances
are well within the 500-meter threshold that users are
typically willing to walk to access a vehicle (Her-
rmann et al., 2014).
Impact of Fleet Electrification and Charging Infrastructure on Free-Floating Car Sharing in Milan
541

4 CONCLUSIONS
This study analyzed the feasibility of transitioning
Milan’s free-floating car-sharing fleet from ICEVs to
BEVs. Through a scenario-based simulation, it con-
sidered the interplay between vehicle energy auton-
omy, charging infrastructure distribution, and user de-
mand.
The results demonstrate that the integration of
BEVs into car-sharing services is achievable, pro-
vided that charging infrastructure is strategically
planned. Battery swapping and high-power conduc-
tive charging (110 kW) emerged as the most effec-
tive solutions for ensuring high operational perfor-
mance, with feasible rental percentages exceeding
90%. However, these solutions also face significant
implementation challenges, including infrastructure
costs and compatibility issues.
Mid-tier options, such as 22 kW conductive and
11 kW inductive charging, present a balanced com-
promise, offering acceptable performance with lower
costs and scalability. Moreover, the study under-
scores the importance of maintaining short distances
between rental endpoints requiring charging and the
nearest charging stations, ensuring alignment with
user convenience thresholds.
Ultimately, the findings highlight the need for a
tiered and phased deployment strategy for charging
infrastructure to support the successful electrification
of car-sharing fleets. This approach can maximize en-
vironmental benefits while ensuring operational feasi-
bility, positioning Milan as a model city for sustain-
able urban mobility.
ACKNOWLEDGEMENTS
This study was carried out within the MOST –
Sustainable Mobility Center and received funding
from the European Union Next-GenerationEU (PI-
ANO NAZIONALE DI RIPRESA E RESILIENZA
(PNRR) – MISSIONE 4 COMPONENTE 2, IN-
VESTIMENTO 1.4 – D.D. 1033 17/06/2022,
CN00000023). This manuscript reflects only the
authors’ views and opinions, neither the European
Union nor the European Commission can be consid-
ered responsible for them.
REFERENCES
Cederqvist, M. (2023). The carsharing telematics market.
Technical report, Berg Insight AB.
Colombo, C. G., Borghetti, F., Longo, M., and Foiadelli,
F. (2023). Electrification of motorway network: A
methodological approach to define location of charg-
ing infrastructure for ev. Sustainability, 15(23).
Electromaps (2024). https://www.electromaps.com/it.
Genikomsakis, K. N. and Mitrentsis, G. (2017). A computa-
tionally efficient simulation model for estimating en-
ergy consumption of electric vehicles in the context of
route planning applications. Transportation Research
Part D: Transport and Environment, 50:98–118.
Gerossier, A., Girard, R., and Kariniotakis, G. (2019).
Modeling and forecasting electric vehicle consump-
tion profiles. Energies, 12(7).
Hammerschmitt, B. K., Unsihuay-Vila, C., Sausen, J. P.,
Capeletti, M. B., Aoki, A. R., Teixeira, M. D., Bar-
riquello, C. H., and Abaide, A. d. R. (2024). Adaptive
charging simulation model for different electric vehi-
cles and mobility patterns. Energies, 17(16).
Hensher, D. A. (2018). Tackling road congestion – what
might it look like in the future under a collaborative
and connected mobility model? Transport Policy,
66:A1–A8.
Herrmann, S., Schulte, F., and Voß, S. (2014). Increas-
ing acceptance of free-floating car sharing systems us-
ing smart relocation strategies: A survey based study
of car2go hamburg. In Gonz
´
alez-Ram
´
ırez, R. G.,
Schulte, F., Voß, S., and Ceroni D
´
ıaz, J. A., edi-
tors, Computational Logistics, pages 151–162, Cham.
Springer International Publishing.
Liao, F. and Correia, G. (2021). Electric carsharing and
micromobility: A literature review on their usage pat-
tern, demand, and potential impacts. International
Journal of Sustainable Transportation, 16(3):269–
286.
Moss, M. L. (2012). Urban mobility in the 21st century.
Technical report, NYU Rudin Center for Transporta-
tion Policy.
Nicholas, M. and Bernard, M. R. (2021). Success factors
for electric carsharing. Technical report, INTERNA-
TIONAL COUNCIL ON CLEAN TRANSPORTA-
TION.
Perboli, G., Ferrero, F., Musso, S., and Vesco, A. (2018).
Business models and tariff simulation in car-sharing
services. Transportation Research Part A: Policy and
Practice, 115:32–48.
Rauf, H., Zehra Zaidi, S. S., Naveed, H., Mehmood, D.,
Jabeen, F., and Malik, A. W. (2023). Urbanevsim:
Open-source electric vehicle mobility and charging
simulation platform. In 2023 International Confer-
ence on Frontiers of Information Technology (FIT),
pages 79–84.
Weibin, Z., Yuhang, S., Yong, Q., Qianmu, L., and Minglei,
S. (2018). Traveler behavior analysis based on car2go
sharing operation data. In nternational Conference
on Transportation and Development 2018: Planning,
Sustainability, and Infrastructure Systems.
VEHITS 2025 - 11th International Conference on Vehicle Technology and Intelligent Transport Systems
542
