
Robotic Visual Attention Architecture for ADAS in Critical Embedded
Systems for Smart Vehicles
Diego Renan Bruno
1 a
, William D’Abruzzo Martins
1 b
, Rafael Alceste Berri
2 c
and Fernando Santos Os
´
orio
3 d
1
Sao Paulo State University (UNESP), Brazil
2
Federal University of Rio Grande (FURG), Brazil
3
University of Sao Paulo (USP), Brazil
Keywords:
ADAS, Computer Vision, Autonomous Vehicles, Driver Assistance, Machine Learning.
Abstract:
This paper presents the development of a perception architecture for Advanced Driver Assistance Systems
(ADAS) capable of integrating (a) external and (b) internal vehicle perception to evaluate obstacles, traffic
signs, pedestrians, navigable areas, potholes and deformations in road, as well as monitor driver behavior,
respectively. For external perception, in previous works we used advanced sensors, such as the Velodyne
LIDAR-64, the Bumblebee 3D camera for object depth analysis, but in this work, focusing on reducing hard-
ware, processing and time costs, we apply 2D cameras with depth estimation generated by the Depth-Anything
V2 network model. Internal perception is performed using the Kinect v2 and the Jetson Nano in conjunction
with a SVM (Support Vector Machine) model, allowing the identification of driver posture characteristics and
the detection of signs of drunkenness, drowsiness or disrespect for traffic laws. The motivation for this system
lies in the fact that more than 90% of traffic accidents in Brazil are caused by human error, while only 1%
are detected by surveillance means. The proposed system offers an innovative solution to reduce these rates,
integrating cutting-edge technologies to provide advanced road safety. This perception architecture for ADAS
offers a solution for road safety, alerting the driver and allowing corrective actions to prevent accidents. The
tests carried out demonstrated an accuracy of more than 92% for external and internal perception, validating
the effectiveness of the proposed approach.
1 INTRODUCTION
Road safety is a major global concern, especially con-
sidering the significant impact of vehicle accidents on
society. Data from the World Health Organization
(WHO) indicate that more than 1.3 million people die
annually in traffic accidents, while millions suffer se-
rious injuries. In Brazil, approximately 90% of these
incidents are attributed to human error, such as inat-
tention, drunk driving and disregard for traffic laws,
reflecting the importance of technological strategies
to mitigate these risks (Berri et al., 2022).
Behavioral factors, such as drowsiness and drunk
driving, as well as errors in decision-making in crit-
ical situations, are among the main causes of acci-
a
https://orcid.org/0000-0001-6905-6422
b
https://orcid.org/0009-0003-6781-8595
c
https://orcid.org/0000-0002-5125-2756
d
https://orcid.org/0000-0002-6620-2794
dents. Traditional approaches, such as radar monitor-
ing and policing, are limited, detecting less than 1%
of violations committed. This highlights the need for
proactive solutions that can act continuously to pre-
vent accidents, rather than simply reacting to viola-
tions that have already occurred (Berri et al., 2022).
The expansion of technology has driven the de-
velopment of Advanced Driver Assistance Systems
(ADAS). These systems combine sensors and intel-
ligent algorithms to monitor both the external envi-
ronment, such as obstacles and traffic signs, and the
driver’s internal behavior. By integrating the analy-
sis of multiple data sources, such as 3D sensors and
high-resolution cameras, these technologies have the
potential to prevent accidents and correct human er-
rors in real time, increasing road safety.
In this work, we developed an ADAS architecture
focused on assessing traffic (obstacles, pedestrians,
potholes, route deviations not mapped on GPS, ver-
tical traffic signs) integrated with driver behavior, al-
Bruno, D. R., Martins, W. D., Berri, R. A. and Osório, F. S.
Robotic Visual Attention Architecture for ADAS in Critical Embedded Systems for Smart Vehicles.
DOI: 10.5220/0013362600003912
Paper published under CC license (CC BY-NC-ND 4.0)
In Proceedings of the 20th International Joint Conference on Computer Vision, Imaging and Computer Graphics Theory and Applications (VISIGRAPP 2025) - Volume 2: VISAPP, pages
871-878
ISBN: 978-989-758-728-3; ISSN: 2184-4321
Proceedings Copyright © 2025 by SCITEPRESS – Science and Technology Publications, Lda.
871
lowing for warning signals to the driver, corrections
in lane guidance and even automatic routines that can
take control of the vehicle.
In this research we present a complete visual per-
ception and attention architecture, based on computer
vision and intelligent sensors, capable of contributing
to the reduction of traffic accidents through a com-
plete ADAS system.
2 RELATED WORKS
2.1 Detection Objects
In traffic environments, it is common to detect several
obstacles at the same time to make the best decision
to avoid them. Multiple Object Tracking (MOT) is
a computer vision task that aims to locate multiple
objects in videos and assign them unique identities.
Over the years, several MOT methods have been pro-
posed and widely used in various applications such as
autonomous driving (Wu et al., 2015) and object col-
lision avoidance. However, the performance of MOT
can be compromised by configuration issues in multi-
object environments, lack of depth awareness, as well
as partial or complete object occlusions, which may
limit its effectiveness in such scenarios.
A Deep Learning networks make great contri-
butions to the detection of multiple objects in 2D
images (Figure 1). There are two main struc-
tures for detecting objects in images: (1)Three-stage
detectors: (detection, classification and instantia-
tion): RCNN (Girshick, 2015), Fast R-CNN (Ren
et al., 2017) and Faster R-CNN (Gavrilescu et al.,
2018),(2)Two-stage: detectors (detection and clas-
sification): YOLO (You Only Look Once) (Red-
mon et al., 2016), SSD (Chen et al., 2019) and
YOLO9000 (Redmon and Farhadi, 2017). Through
Figure 1, the operating stages of the system can be
observed: (a) Sensing, (b) Detection, (c) Recogni-
tion and (d) Tracking.
Figure 1: Steps for the system developed in this work (Ca-
mara et al., 2020).
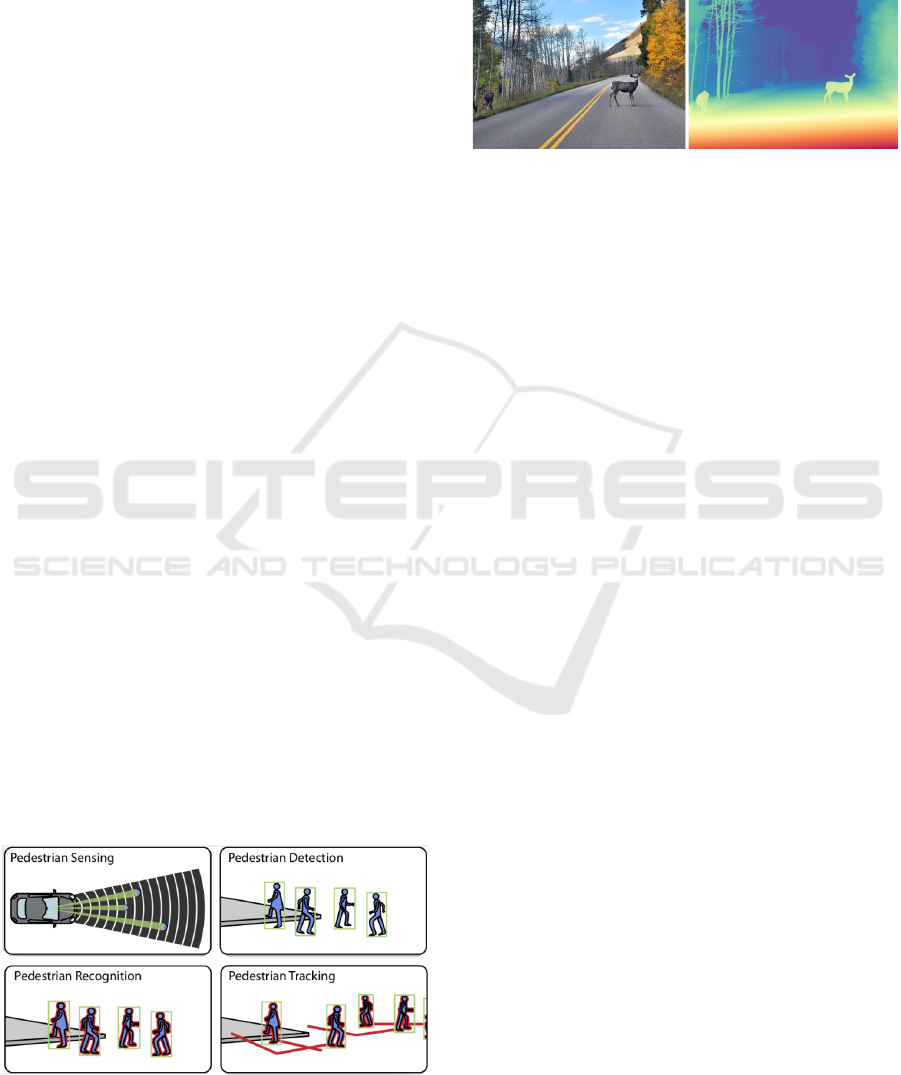
In Figure 2, a scene can be observed where an an-
imal is detected on the road with its depth estimate,
and the notion of depth is quite important for a ve-
hicle to be able to make the best possible decision to
avoid the obstacle.
Figure 2: Depth-Anything V2: Obstacle detection on the
road (Yang et al., 2024).
In addition to analyzing obstacles and pedestrians,
there is a need for greater robustness in the evaluation
of vertical traffic signs, analyzing not only their infor-
mation but also their position in relation to the road,
ensuring that the vehicle respects the correct signage.
Previous research worked with 2D and 3D data fusion
to make this possible, however, with high hardware
costs for sensors and processing, and suffering from
accuracy at long distances (greater than 30 meters, 3D
cameras have major problems with the point cloud).
A complete overview of our work in 3D Robotic
Computer Vision can be seen in the following work:
CARINA project (Bruno et al., 2023).
In a work done by Timofte and Zimmermann
(Timofte et al., 2014), a system was developed ca-
pable of detecting traffic signs using 3D data. In this
work, a method based on the Minimum Description
Length Principle (MDL) was applied. This was one
of the first works to use 3D images in favor of the
analysis of traffic signs (Timofte et al., 2014).
In the work of Zhou and Deng (Zhou and Deng,
2014), a system based on LIDAR (Light Detection
and Ranging) and classification algorithms for the
analysis of signaling plates images was used, using
3D data to improve the robustness of the task of de-
tecting traffic signs. Through 3D point cloud data
(color and spot clustering), the signboard in question
was analyzed using Support Vector Machine (MVS)
for classification of the traffic signs(Zhou and Deng,
2014).
Another work, that also uses 3D data, was devel-
oped by Soil
´
an et al. (Soil
´
an et al., 2016), each traffic
sign was detected using the LIDAR sensing with clas-
sifiers based on semantic algorithms.
In the work of Wu et al. (Wu et al., 2015), a system
that also uses LIDAR has been applied. This system
does all the analysis through the 3D perception sys-
tem. To make this possible, it uses landmarks to aid
in the detection of signaling plates. (Wu et al., 2015).
VISAPP 2025 - 20th International Conference on Computer Vision Theory and Applications
872

2.2 Detection Routes not Mapped
The main goal of road analysis is to detect emergency
hotspots, such as new routes not mapped by GPS, un-
conventional and unmapped road signs, and dynamic
obstacles, in an integrated manner to analyze how the
driver is reacting to these new situations.
A large number of mapping methods propose grid
maps based on the 3D LiDAR sensor (Bruno et al.,
2023). A 3D grid is created and in each grid block
more detailed information about the points in that re-
gion is stored. With this approach, we can reduce the
amount of data stored and maintain the information
about the points in each grid block, making it possi-
ble to identify the traversable area.
Our current research also evaluates auxiliary
routes and horizontal flow control lanes using Deep
Learning networks, where we are currently applying
the Depth-Anything V2 network (Yang et al., 2024) in
conjunction with Segnet (Bruno et al., 2023) to eval-
uate the navigable area and relate it to obstacles and
traffic signs, making it possible to aggregate informa-
tion to the GPS route.
2.3 Advanced Driver Assistance System
This section shows some other works of driver mon-
itoring and driving qualification related to the pro-
posed system for detection of cell phone usage,
drunkenness, and dangerous driving recognition.
Some works (Akrout and Mahdi, 2013) allow
monitoring the driver using RGB cameras, but they
rely on lighting, furthermore, they depend on certain
consistency and homogeneity of lighting to detect and
segment the driver correctly. The segmentation accu-
racy of the driver can be impaired by internal parts
of the vehicle or other objects in-vehicle with colors
close to human skin color. In a real situation, the in-
cidence of illumination may vary which makes this a
relevant problem. For example, in the vehicle’s re-
gions where the sunlight reaches, the pixels of the
acquired image from the camera saturates, in other
words, they tend to have a bright color. The vehicle
movement causes yet the displacement of the regions
reached by the sunshine. All these problems hamper
the usage of driver monitoring based RGB cameras in
a real environment.
Cameras can acquire 2D information about the
scene, without considering the depth related to the
pixels captured by the camera. Using an active 3D
sensor with its own lighting that is not visible (in-
frared) and tolerant to the incidence of the sun is inter-
esting for driver monitoring. Thus, with 3D data, we
can be able to track the driver movement in-vehicle,
without color and light intensity influence of the pas-
sive devices. Craye and Karray (Craye and Kar-
ray, 2015) propose a method that uses a 3D Sensor
(Kinect), but it uses a fusion of sensors (with RGB
cameras), and then, depends on RGB data and is sus-
ceptible to sunlight reaches.
Avoiding intrusive systems (Bruno et al., 2023),
that use for example electrodes, is a good way to
improve the comfort of driving. In an intrusive sys-
tem, the driver must participate directly in the driving
risk qualification system putting electrodes or other
equipment on his/her body before using the system.
In other non-intrusive methods (Dai et al., 2010), the
driver needs to participate actively to detect the risk.
It is interesting that the driver does not participate in
any activity of the process of driving risk detection,
so the driver can forget that he/she is being monitored
and act a natural way.
In our current work, the proposal was to work with
Kinect together with 3D features and SVM-based
classifiers for greater robustness to the problems pre-
sented with lighting and driver posture.
3 VISUAL ATTENTION
ARCHITECTURE FOR ADAS
The proposed architecture for an Advanced Driver
Assistance System (ADAS) integrates internal and
external perception analysis for smart vehicles, aim-
ing to ensure safety and efficiency in real-time nav-
igation. The system is designed to monitor both the
vehicle’s external environment and the driver’s condi-
tion, correlating these factors with driving behavior to
detect and correct faults. For data internal to the ve-
hicle, we create our own database, while for external
data, we apply public datasets.
3.1 External Perception
In our previous works (Bruno and Os
´
orio, 2023), for
external perception, a 3D stereoscopic camera and
a 2D monocular camera were used to collect accu-
rate information about the external environment. The
3D camera was responsible for obtaining depth data,
enabling the identification of potholes, uneven sur-
faces and obstacles in real time. The monocular
camera, in turn, captured high-resolution images to
recognize traffic signs, intersections, navigable areas
and unmapped areas, especially those with new sig-
nage. Currently, we have replaced the application of
3D cameras (of the Bumblebee type) and LIDAR in
our architecture with 2D cameras in conjunction with
Robotic Visual Attention Architecture for ADAS in Critical Embedded Systems for Smart Vehicles
873
Deep Learning depth estimation algorithms (Depth-
Anything V2), enabling a lower hardware cost, a
lower processing cost and a lower time for the ma-
nipulation of the generated 3D data.
3.1.1 2D Analysis: Depth-Anything-V2
Monocular depth perception is a crucial component
of 3D computer vision that allows for the estimation
of three-dimensional structures from a single two-
dimensional image. Unlike stereoscopic methods that
use multiple perspectives to determine depth, monoc-
ular depth perception algorithms rely on various vi-
sual features in the image, such as texture gradients,
object sizes, shading, and perspective, to extract depth
information. The primary challenge is converting
these inherently ambiguous visual cues into precise
depth maps, a task that has seen considerable progress
with the introduction of deep learning techniques.
The Depth-Anything V2 (Yang et al., 2024) model
represents a major advancement in monocular depth
estimation, prioritizing accuracy and computational
efficiency. The model’s core innovation lies in the
use of synthetic images for training, replacing the pre-
viously standard labeled real images in deep learn-
ing tasks, which introduces consistency and allows
for more controlled training. In addition, Depth-
Anything V2 uses a high-throughput learning model
whose function is to generate large-scale pseudo-
labels to train models, expanding the model’s poten-
tial without increasing its computational complexity.
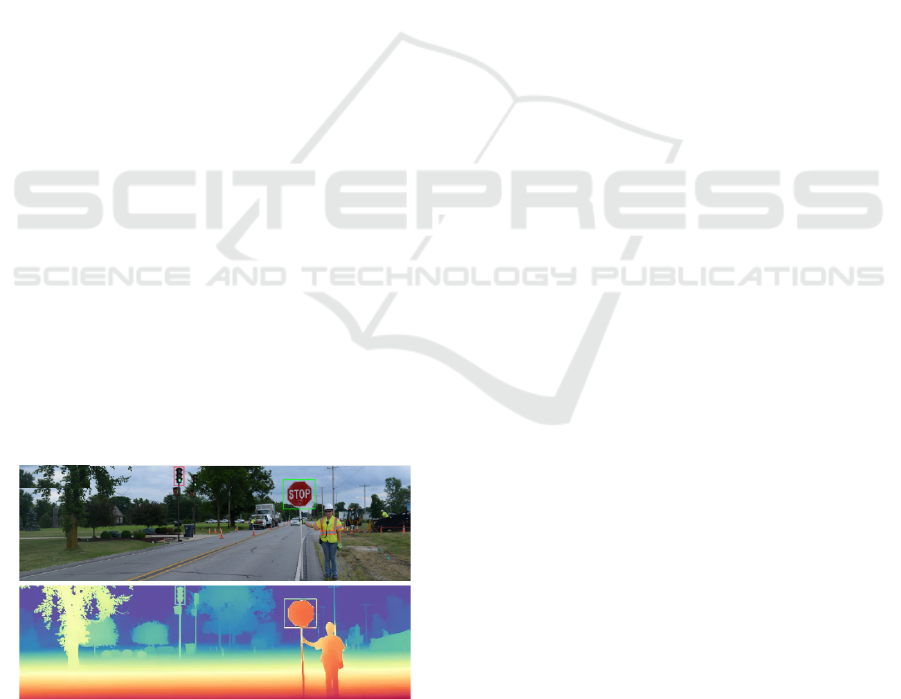
By means Figure 3 shows an emergency situation
on the road, where a traffic officer is introducing a
new traffic rule. The notion of depth in situations like
this allows the vehicle to detect information of greater
relevance with the notion of depth. In this case, for
example, the stop sign has greater priority in relation
to the green traffic light that is further behind.
Figure 3: Depth-Anything V2: Obstacle detection on the
road (Yang et al., 2024).
Our traffic sign detection algorithm uses a region
of possible locations where signs can usually be found
in the environment. In an urban traffic environment,
a traffic sign is not always placed on an individual
pole; in some situations, it can be found on a pole
shared with other types of information (e.g., street
signs, light signals.
An Artificial Neural Network (ANN) - Multilayer
Perceptron (MLP) with binary output was trained
with these various cases where signs (signals) and
other elements can be found. The ANN was applied
to solve this problem of classification and detection of
traffic signs. To make this possible, each type of case
was modeled based on data from the Deep Learning
Depth network and its point cloud generated by depth
estimation.
In case of the neural network algorithm informs
the system that a board (traffic sign candidate) has
been detected in the environment, then a second clas-
sifier based on Deep Learning YOLOv11 is activated
to classify the type of traffic sign that was detected in
image RGB-D (red, green, blue + Depth): maximum
speed, cones for route deviation, stop, preferential,
pedestrian or also other types of traffic signs (Redmon
et al., 2016).
3.1.2 2D Analysis: YOLO V11
The YOLOv11 network is being applied to detect
road surface irregularities such as potholes and defor-
mations (Figure 3). This object detection architecture
is widely recognized for its high accuracy and effi-
ciency, capable of identifying these irregularities ro-
bustly and with low latency, contributing to vehicle
safety by enabling preventive decision-making.
3.2 Internal Perception
Internal perception involves analyzing the driver’s
condition using sensors such as Kinectand a Jetson
Nano, capable of making inferences in real time. This
module evaluates aspects such as attention, drowsi-
ness and indicators of risky behavior, such as drunk-
enness, cell phone use or lack of attention. This data
is processed to identify anomalies in the driver’s inter-
action with the vehicle and with traffic using Machine
Learning and Computer Vision techniques.
Collecting real data in research on driver distrac-
tions and disturbances involves risks to participants
and to potential bystanders, so a simulated environ-
ment can be used to avoid exposing participants to
risks (Calonder et al., 2012). To obtain the data
for this research, the Simulator for Distracted Driv-
ing Research (SDDR) was created, which consists of:
a front projection screen (and projector); a cockpit to
accommodate the driver; a G27 Racing Wheel with
accelerator and brake pedals, with manual gear shift;
VISAPP 2025 - 20th International Conference on Computer Vision Theory and Applications
874

a Kinect v2 and the simulation and simulation control
software.
3.3 Decision-Making System
The central decision-making system is implemented
in an FPGA, providing high real-time processing ca-
pacity. The FPGA executes fuzzy logic algorithms
(TOPSIS + MADM) to analyze internal and external
perception information, evaluating the context and the
need for driving corrections. This module is capable
of identifying deviations from the driver’s ideal be-
havior based on the captured data, either to alert the
driver or to make automatic corrective decisions.
3.3.1 Analytic Hierarchical
In the Analytic Hierarchical Process (AHP) tech-
nique, a hierarchical structure is created, thus mak-
ing it possible to relate the components of the deci-
sion problem. With this feature of decomposition, the
decision maker can make a comparison between the
elements and classifies them into their priority level
(Pach
ˆ
eco Gomes et al., 2018). The step by step of
this process can be followed in the work of Pachego
and Bruno (Pach
ˆ
eco Gomes et al., 2018).
3.3.2 Fuzzy Regions of Interest: Multiple
Attribute
A Fuzzy set is used with Multiple Making Attribute
Decision Making (MADM) methods to model uncer-
tainty and subjectivity in decision analysis. Chen and
Hwang (1992) (Chen et al., 2014) described some
approaches to MADM steps. In this work we use
fuzzy sets to represent problem areas in vehicle driv-
ing, such as: disrespect for traffic laws, cell phone
use, drunkenness, etc.
As we are working on the fuzzy linguistic model,
the method will be applied by the two steps described
below:
3.3.3 Technique for Order Preference by
Similarity to Ideal Solution
To rank the ideal solution, we use the algorithm based
on Technique for Order Preference by Similarity to
Ideal Solution (TOPSIS) with the central concept
that this approach is able to find the best alternative
through the closest Euclidean distance to the ideal
solution (Chen et al., 2014) (Pach
ˆ
eco Gomes et al.,
2018).
The integration of fuzzy logic and analytical
methods such as AHP and TOPSIS results in a sys-
tem that can respond to dynamic situations with high
accuracy and reliability for ADAS.
4 RESULTS
4.1 Internal Perception: ADAS
In this work, we use the Naturalistic Driver Behav-
ior Dataset (NDBD) (Berri and Os
´
orio, 2018), which
includes data of driver behaviors from both synchro-
nized 3D positions of the driver and car telemetry con-
sidering mobile distraction, drunk driving, and regu-
lar driving were used in all experiments and tests on
the Safety System (Section 3). The experiments de-
scribed here use data from 14 participants (7 for train-
ing and 7 for validating) in two kinds of recorded tests
from the NDBD, the regular driving and distracted.
We used 9-fold cross-validation (Kohavi, 1995) in all
classifiers’ training for statistical analysis.
Using all data, we could be obtained the ϕ (see
Section 3) for each feature. The ϕ adopted was the
minimum value of all frames and participants, using
the absolute value for f eature
v
, f eature
n
equal 1 and
the driver shoulder length (shoulder
l
) obtained from
the initial frame. Table 1 shows the ϕ of each driving
monitoring.
Using Linear SVM (Cortes and Vapnik, 1995) for
finding the maximum-margin hyperplane for “risk”
and “no risk” classes, NDBD in periods between 5
and 300 frames, combinations of all the 68 candidate
features (34 averages and 34 standard deviations), and
Findex
5
(Findex
5
=
26×PR
25×P+R
, where, P is Precision
and R is Recall of normal situations predictions), we
could obtain some group of the features and frequency
(nST and nLT ) that avoids false risk alarms. In each
period, the test was started by with 1 feature until the
64 features are included, being included one feature
by each step, searching for the set of features that
makes Findex
5
better (higher). Figure 4 shows the
best test for each period length and quantity of fea-
ture.
Using the NDBD training frames, Multilayer Per-
ceptron (MLP) (Jain et al., 1996) as the classification
technique, and Rprop (Riedmiller and Braun, 1992)
for training the network, we obtained the classifiers.
Two options of activation functions were used, Gaus-
sian (f (x) =
β(1−e
−αx
)
(1+e
−αx
)
) and Sigmoid (f (x) = βe
−αx
2
).
A binary coded Genetic Algorithm
1
(GA) with 10
individuals and 400 generations, with a crossover rate
of 80%, the mutation rate of 5%, and tournament se-
lection (empirically defined) were used for finding
training and network parameters. The GA chromo-
some code adopted has a length of 66 bits. The GA
equation of the fitness is f itness = κFindex
5
+ (1 −
1
The library GALib version 2.4.7 is used (available in
http://lancet.mit.edu/ga).
Robotic Visual Attention Architecture for ADAS in Critical Embedded Systems for Smart Vehicles
875
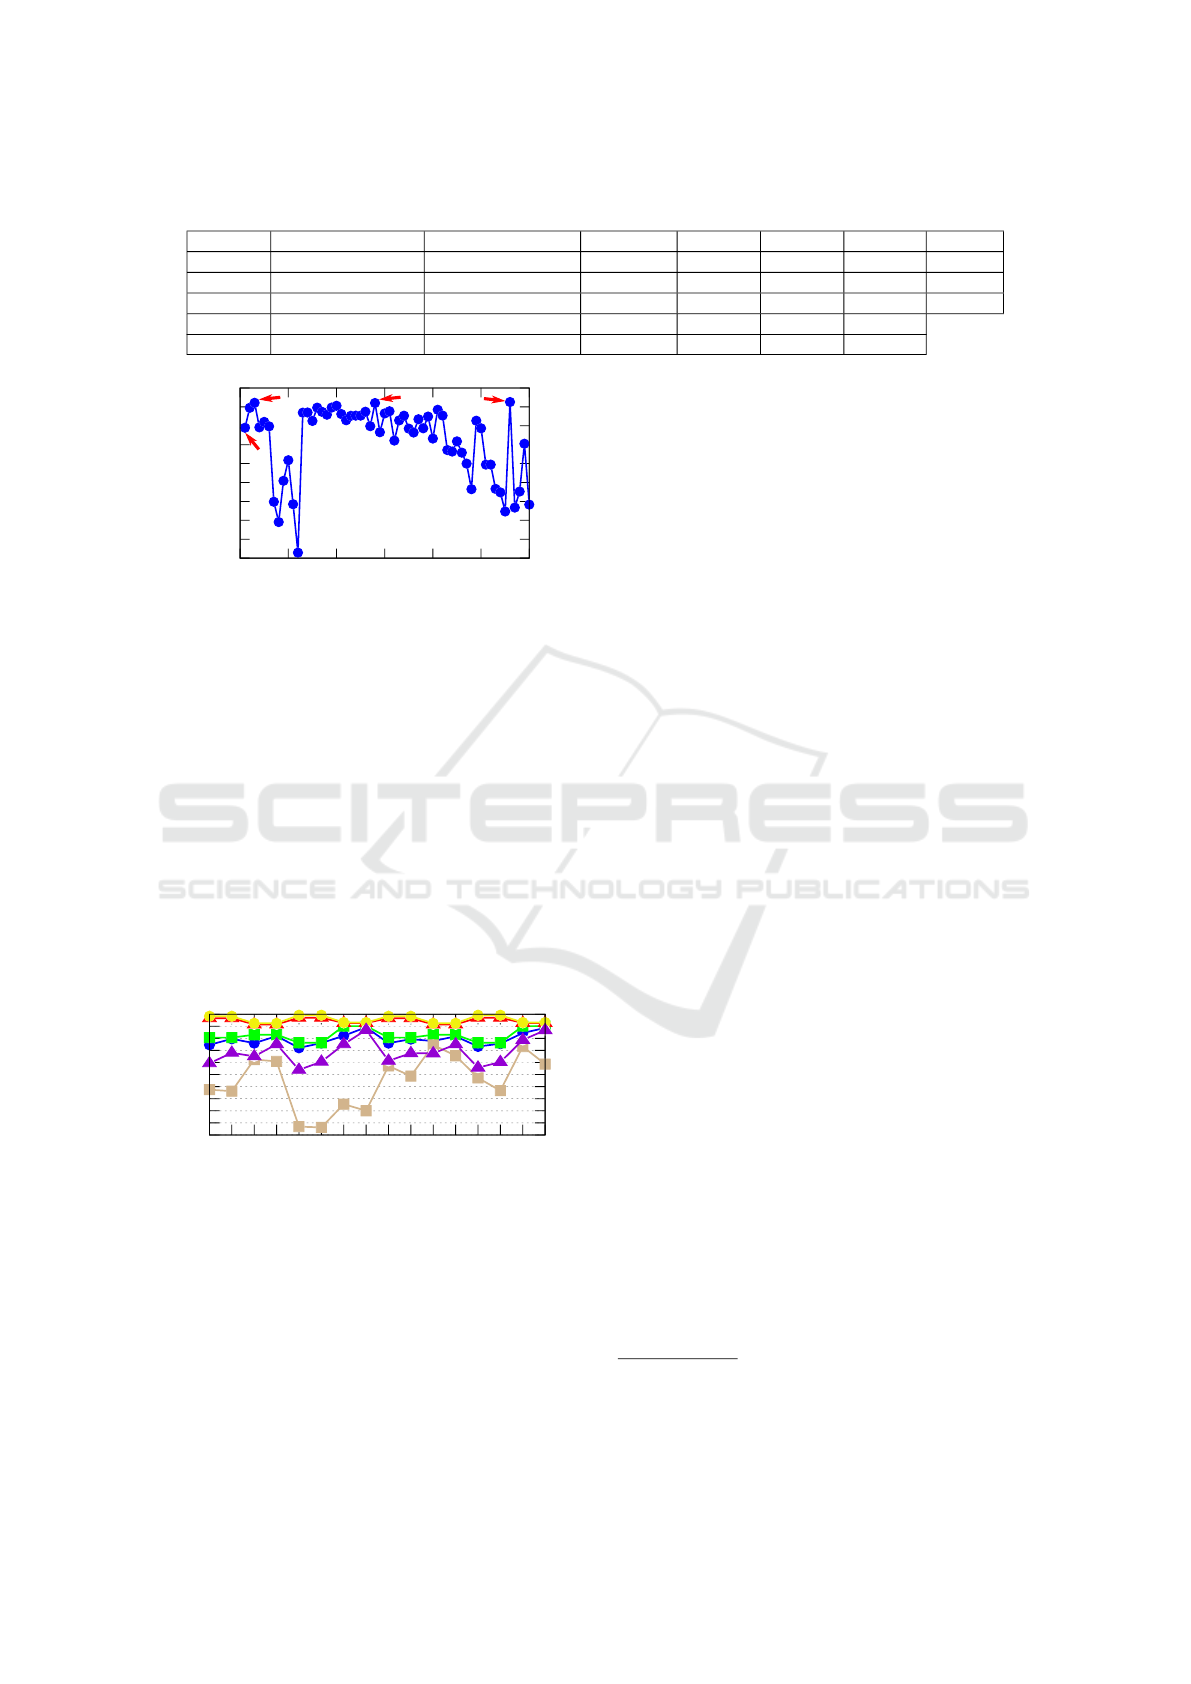
Table 1: ϕ adopted for each feature of driver monitoring.
Feature minDistHands
SW
maxDistHands
SW
distLH
SW
xLH
SW
yLH
SW
zRH
SW
xRH
SW
ϕ 1.69 1.62 1.66 8.11 4.09 1.72 4.94
Feature minDistHands
DH
maxDistHands
DH
distRH
SW
yRH
SW
zRH
SW
xLH
DH
yLH
DH
ϕ 2.86 2.62 1.61 5.35 1.68 7.89 3.32
Feature distLH
DH
distRH
DH
zLH
DH
xMD
CM
yMD
CM
zMD
CM
ϕ 2.62 2.75 2.76 5.12 3.32 2.97
0.91
0.915
0.92
0.925
0.93
0.935
0.94
0.945
0.95
0.955
0 50 100 150 200 250 300
Findex
Period length (frames)
140
5
15
280
Figure 4: Graph of the best Findex
5
obtained in each period
length.
κ)A, where, A is the classifier accuracy, and κ is 0.6
for ST classifiers (5 and 15) and 0.9 for LT (140 and
280 frames).
The classi f ierST determines Findex
5
(it is just for
“no risk” situations) because ST system is responsi-
ble for indicating a “risk” or “no risk” situation and
LT system indicates the level of alarm. The high-
est Findex
5
were 0.97 the systems with sg15, which
in sg15#ls140 reached 76.08% of alarm accuracy, on
the other hand, ss15#ls140 reached the highest alarm
accuracy of 89.15% but with 0.92 of Findex
5
. For
sg15#ls140 just 0.81% was wrong prediction of risk
for normal situation, otherwise, for ss15#ls140 was
predicted 6.83% of normal situation as a risk.
0
0.1
0.2
0.3
0.4
0.5
0.6
0.7
0.8
0.9
1
sg5#lg140
sg5#ls140
ss5#lg140
ss5#ls140
sg15#lg140
sg15#ls140
ss15#lg140
ss15#ls140
sg5#lg280
sg5#ls280
ss5#lg280
ss5#ls280
sg15#lg280
sg15#ls280
ss15#lg280
ss15#ls280
Figure 5: Results of Safe Systems, where, the red line is the
Findex
5
, the blue is the system alert accuracy, green is the
accuracy for risk detection (lowest and highest alarm), yel-
low is the accuracy for alarm off, brown is the accuracy for
lowest alarm, and purple is the accuracy for highest alarm.
4.2 External Perception
4.2.1 Detection of Traffic Signs Using 3D Data
Given the results of the 3D estimated with Depth-
Anything V2, object classification obtained by the
ANN with binary output, it was possible to state
whether the detected object is a traffic object or not.
If the object is a traffic light or a traffic sign, the
Deep Learning-based system is enabled to evaluate
the 2D image. We obtained an accuracy rate of ap-
proximately 87% for the detection task and 98.8% for
the recognition of the different traffic sign images.
4.2.2 2D Analyses
In this section we present our results related to pedes-
trian, traffic signs and obstacles detection and track-
ing in 2D data. The values presented come from the
accuracy and time for these tasks in computer vision
for vehicles.
4.3 Detection and Tracking: Pedestrian
and Obstacles
Obstacle (pedestrian, traffic signs, etc) detection and
tracking showed good results, taking into account
real-time processing in a low-cost embedded system.
The main metric for evaluating the 2D image detec-
tion system is based on the results of the Intersection
over Union (Intersection over Union - IoU), where the
detection is directly compared to ground truth.
Computer Vision System Accuracy: By means of
the Table 3, the training results of the network of Deep
Learning YOLOv11 can be observed as a function of
the number of epochs and, also taking into account the
following parameters: Avg Loss, mAP
2
and IoU
3
.
2
maP: Average precision value over all values of recall.
3
IoU: Metric for evaluating object detectors based
on Deep Learning capable of measuring the overlap rate
between ground truth and detection.
VISAPP 2025 - 20th International Conference on Computer Vision Theory and Applications
876
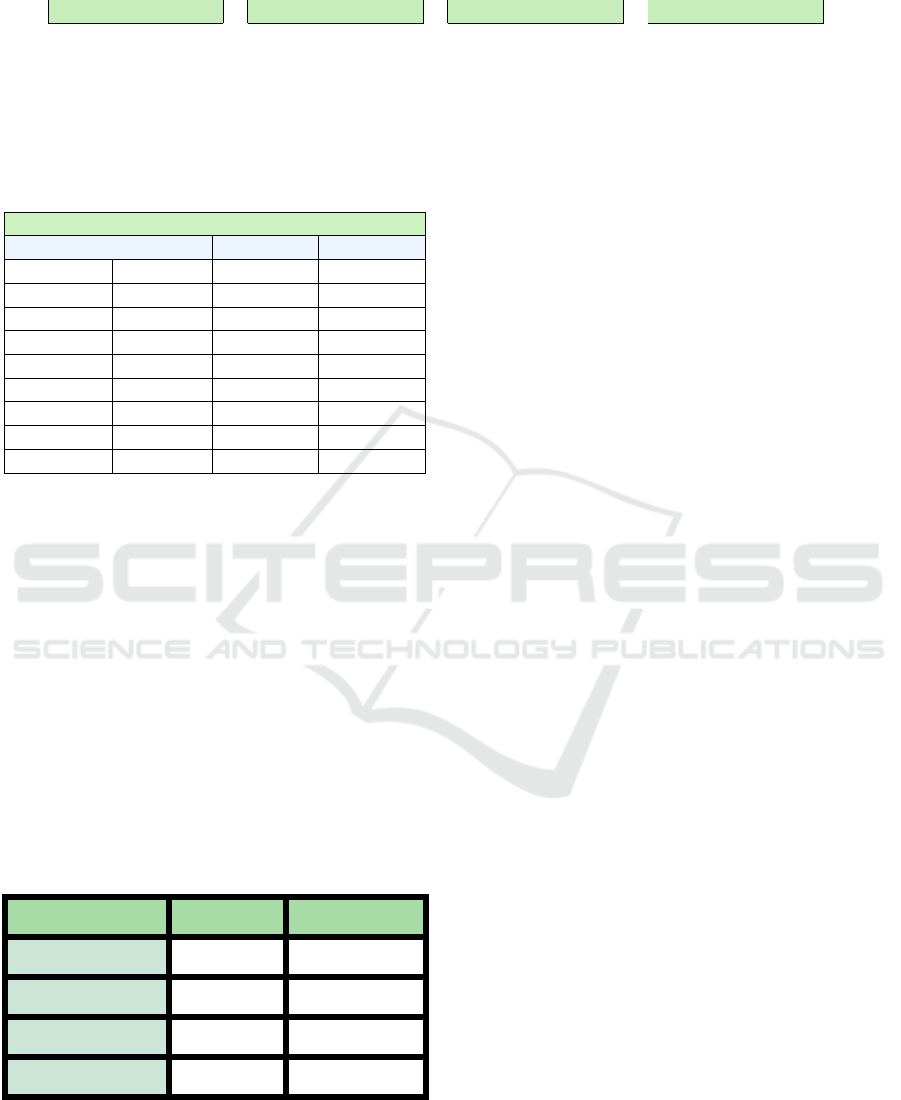
Table 2: Resulting confusion matrices for detection and tracking tests - Relation of the confusion matrix: Pedestrians, Vertical
traffic signs, traffic lights and cars.
Test 1 Test 2 Test 3 Test 4
88 2 1 3 87 2 1 2 92 2 2 3 88 0 1 2
2 15 0 0 3 13 1 0 0 14 0 0 1 17 0 0
6 1 12 1 5 1 13 0 2 0 13 1 5 0 13 2
4 0 2 16 5 2 0 18 6 2 0 16 6 1 1 14
Table 3: Comparison of training as a function of the number
of iterations.
Comparison for the number of training epochs
Iterations Avg Loss mAP (%) IoU (%)
1000 0.2933 36.26 25.31
2000 0.2722 44.35 31.74
3000 0.2601 55.96 38.33
4000 0.2057 65.81 45.56
5000 0.1549 80.57 53.91
10000 0.1045 86.43 62.41
15000 0.0497 89.01 72.55
20000 0.0431 92.95 79.21
25000 0.0519 90.39 77.61
4.4 Detection and Tracking: Potholes
and Deformities in the Road
In this work, we perform a performance compari-
son between the YOLOv11n and Faster R-CNN mod-
els for the road irregularity detection task in ADAS
systems. The YOLOv11n model obtained a mAP-
50 of 74.9%, with an average speed of 70.92 FPS).
The Faster R-CNN model presented a mAP-50 of
72.187%, with an average rate of 17 FPS. These re-
sults demonstrate that, although both models are ac-
curate, YOLOv11n offers superior performance in
terms of speed, being more suitable for real-time de-
tection.
Table 4: Comparison between the YOLOv11n and Faster
R-CNN.
Metrics YOLOv11n Faster R-CNN
mAP@50 (%) 74.90 72.20
mAP@50:95 (%) 42.30 47.30
Recall (%) 65.57 60.80
FPS 70.92 17.00
5 CONCLUSION AND FUTURE
WORK
This paper proposes an efficient computer vision ar-
chitecture for vehicle-based ADASs aimed at detect-
ing and tracking objects, obstacles, pedestrians, and
traffic signs in urban traffic environments (external
perception) in conjunction with driver behavior anal-
ysis (internal perception). Using the Depth-Anything
V2 deep learning model, it was possible to estimate
3D data from monocular cameras, reducing costs and
increasing accuracy compared to our previous work
based on LIDAR and stereo cameras. The YOLOv11
network was applied to detect and classify objects,
enabling our computer vision architecture to achieve
92% average accuracy (mAP) and 79.2% Intersection
over Union (IoU) in object detection.
A performance comparison between the
YOLOv11n and Faster R-CNN models was also
applied to the task of road irregularity detection in
ADAS systems. The YOLOv11n model obtained a
mAP-50 of 74.9%, with an average speed of 70.92
FPS, while the Faster R-CNN model presented a
mAP-50 of 72.187%,with an average rate of 17 FPS.
This system allows you to perform maneuvers to
avoid accidents in potholes on the road.
In addition, the proposed architecture identifies
driver distraction, inappropriate behavior, and traffic
laws violation with 95% accuracy. The data generated
in internal and external perception provides support
for a decision-making model based on fuzzy logic al-
lowing alerts to be issued to correct the driver’s pos-
ture and, if the risk persists, activates an autonomous
system that can activate the actuators (brake, accel-
erator and steering) performing safety maneuvers to
avoid a possible accident.
The next steps of this work involve optimizing the
analyzed algorithms to achieve even more efficient
performance in real-time applications.
REFERENCES
Akrout, B. and Mahdi, W. (2013). A visual based approach
for drowsiness detection. In Intelligent Vehicles Sym-
Robotic Visual Attention Architecture for ADAS in Critical Embedded Systems for Smart Vehicles
877

posium (IV), 2013 IEEE, pages 1324–1329.
Berri, R. and Os
´
orio, F. (2018). A 3d vision system for de-
tecting use of mobile phones while driving. In 2018
International Joint Conference on Neural Networks
(IJCNN), pages 1–8.
Berri, R. A., Bruno, D. R., Borges, E., Lucca, G., and Oso-
rio, F. S. (2022). Adas classifier for driver monitoring
and driving qualification using both internal and ex-
ternal vehicle data. In Proceedings of the 17th Inter-
national Joint Conference on Computer Vision, Imag-
ing and Computer Graphics Theory and Applications
(VISIGRAPP 2022) - Volume 4: VISAPP, pages 560–
567. INSTICC, SciTePress.
Bruno, D. R., Berri, R. A., Barbosa, F. M., and Os
´
orio, F. S.
(2023). Carina project: Visual perception systems
applied for autonomous vehicles and advanced driver
assistance systems (adas). IEEE Access, 11:69720–
69749.
Bruno, D. R. and Os
´
orio, F. S. (2023). Real-time pedestrian
detection and tracking system using deep learning and
kalman filter: Applications on embedded systems in
advanced driver assistance systems. In 2023 Latin
American Robotics Symposium (LARS), 2023 Brazil-
ian Symposium on Robotics (SBR), and 2023 Work-
shop on Robotics in Education (WRE), pages 549–
554.
Calonder, M., Lepetit, V., Ozuysal, M., Trzcinski, T.,
Strecha, C., and Fua, P. (2012). Brief: Computing
a local binary descriptor very fast. IEEE Transac-
tions on Pattern Analysis and Machine Intelligence,
34(7):1281–1298.
Camara, F., Bellotto, N., Cosar, S., Nathanael, D., Althoff,
M., Wu, J., Ruenz, J., Dietrich, A., and Fox, C. W.
(2020). Pedestrian models for autonomous driving
part I: low level models, from sensing to tracking.
CoRR, abs/2002.11669.
Chen, J., Zhao, P., Liang, H., and Mei, T. (2014). A
multiple attribute-based decision making model for
autonomous vehicle in urban environment. In 2014
IEEE Intelligent Vehicles Symposium Proceedings,
pages 480–485.
Chen, S., Hong, J., Zhang, T., Li, J., and Guan, Y. (2019).
Object detection using deep learning: Single shot de-
tector with a refined feature-fusion structure. In 2019
IEEE International Conference on Real-time Comput-
ing and Robotics (RCAR), pages 219–224.
Cortes, C. and Vapnik, V. (1995). Support-vector networks.
Machine learning, 20(3):273–297.
Craye, C. and Karray, F. (2015). Driver distraction detec-
tion and recognition using rgb-d sensor. arXiv preprint
arXiv:1502.00250.
Dai, J., Teng, J., Bai, X., Shen, Z., and Xuan, D. (2010).
Mobile phone based drunk driving detection. In Per-
vasive Computing Technologies for Healthcare (Per-
vasiveHealth), 2010 4th International Conference on-
NO PERMISSIONS, pages 1–8. IEEE.
Gavrilescu, R., Zet, C., Fos
,
al
˘
au, C., Skoczylas, M., and Co-
tovanu, D. (2018). Faster r-cnn:an approach to real-
time object detection. In 2018 International Confer-
ence and Exposition on Electrical And Power Engi-
neering (EPE), pages 0165–0168.
Girshick, R. (2015). Fast r-cnn. In 2015 IEEE International
Conference on Computer Vision (ICCV), pages 1440–
1448.
Jain, A. K., Mao, J., and Mohiuddin, K. M. (1996). Ar-
tificial neural networks: A tutorial. IEEE computer,
29(3):31–44.
Kohavi, R. (1995). A study of cross-validation and boot-
strap for accuracy estimation and model selection.
In International joint Conference on artificial intelli-
gence, volume 14, pages 1137–1145. Lawrence Erl-
baum Associates Ltd.
Pach
ˆ
eco Gomes, I., Renan Bruno, D., Santos Os
´
orio, F.,
and Fernando Wolf, D. (2018). Diagnostic analysis
for an autonomous truck using multiple attribute deci-
sion making. In 2018 Latin American Robotic Sympo-
sium, 2018 Brazilian Symposium on Robotics (SBR)
and 2018 Workshop on Robotics in Education (WRE),
pages 283–290.
Redmon, J., Divvala, S., Girshick, R., and Farhadi, A.
(2016). You only look once: Unified, real-time ob-
ject detection. In 2016 IEEE Conference on Computer
Vision and Pattern Recognition (CVPR), pages 779–
788.
Redmon, J. and Farhadi, A. (2017). Yolo9000: Better,
faster, stronger. In 2017 IEEE Conference on Com-
puter Vision and Pattern Recognition (CVPR), pages
6517–6525.
Ren, S., He, K., Girshick, R., and Sun, J. (2017). Faster r-
cnn: Towards real-time object detection with region
proposal networks. IEEE Transactions on Pattern
Analysis and Machine Intelligence, 39(6):1137–1149.
Riedmiller, M. and Braun, H. (1992). Rprop-a fast adaptive
learning algorithm. In Proc. of ISCIS VII), Universitat.
Citeseer.
Soil
´
an, M., Riveiro, B., Mart
´
ınez-S
´
anchez, J., and Arias,
P. (2016). Traffic sign detection in mls acquired point
clouds for geometric and image-based semantic inven-
tory. ISPRS Journal of Photogrammetry and Remote
Sensing, 114:92 – 101.
Timofte, R., Zimmermann, K., and Van Gool, L. (2014).
Multi-view traffic sign detection, recognition, and 3d
localisation. Mach. Vision Appl., 25(3):633–647.
Wu, S., Wen, C., Luo, H., Chen, Y., Wang, C., and Li, J.
(2015). Using mobile lidar point clouds for traffic sign
detection and sign visibility estimation. In 2015 IEEE
International Geoscience and Remote Sensing Sympo-
sium (IGARSS), pages 565–568.
Yang, L., Kang, B., Huang, Z., Zhao, Z., Xu, X., Feng, J.,
and Zhao, H. (2024). Depth anything v2.
Zhou, L. and Deng, Z. (2014). Lidar and vision-based
real-time traffic sign detection and recognition algo-
rithm for intelligent vehicle. In 17th International
IEEE Conference on Intelligent Transportation Sys-
tems (ITSC), pages 578–583.
VISAPP 2025 - 20th International Conference on Computer Vision Theory and Applications
878
