
Enhancing IoT Network Intrusion Detection with a New GraphSAGE
Embedding Algorithm Using Centrality Measures
Mortada Termos
1,2
, Zakariya Ghalmane
1
, Mohamed-el-Amine Brahmia
1
, Ahmad Fadlallah
2,3
,
Ali Jaber
2
and Mourad Zghal
1
1
CESI LINEACT UR 7527, Strasbourg, France
2
Computer Science Department, Faculty of Sciences, Lebanese University, Beirut, Lebanon
3
Computer Science Department, University of Sciences and Arts in Lebanon (USAL), Beirut, Lebanon
Keywords:
Intrusion Detection, Complex Networks, Graph Neural Networks, Artificial Intelligence, Cyber Security.
Abstract:
The rapid expansion of the Internet of Things (IoT) has led to many opportunities in addition to introduc-
ing complex security challenges, necessitating more powerful Network Intrusion Detection Systems (NIDS).
This study addresses this challenge by enhancing Graph Neural Networks (GNNs) with centrality measures
to improve intrusion detection performance in IoT environments. We propose the so-called ”Centrality-based
E-GraphSAGE”, an extension to the E-GraphSAGE model incorporating the centrality measures: Degree,
Betweenness, Closeness, PageRank, and K-truss. These centrality measures, which highlight both the local
and global influence of nodes (IoT devices), can uncover hidden patterns and relationships in network traf-
fic data, thereby enhancing the performance of IDS systems. The centrality-informed initialization of node
embeddings aids the model in capturing critical structural insights in the graph. The inclusion of residual con-
nections further improves classification accuracy. Our models were evaluated on four datasets: NF-UQ-NIDS,
NF-CSE-CIC-IDS2018, CCD-INID, and X-IIoTID. Results showed significant performance gains in accuracy
of detection evaluated using F1-score and reduced number of false alarms. This work paves the way for more
advanced and robust intrusion detection systems to improve the security of IoT networks.
1 INTRODUCTION
Access to the internet has become easier, especially
with the increased availability and affordability of IoT
devices. While these developments create opportuni-
ties for innovation and connectivity, they also intro-
duce numerous threats. Cyberattacks in IoT networks
pose significant financial risks and potential harm to
users. Consequently, cybersecurity has gained in-
creasing attention among researchers, to mitigate this
threat. Detecting attacks is one of the main chal-
lenges, and the Network Intrusion Detection System
(NIDS) is a critical tool used for monitoring and ana-
lyzing networks.
Deep Learning (DL) based NIDS have been in-
creasingly used in literature due to their ability to
detect complex and unseen attacks, effectively over-
coming the limitations of Signature-based NIDS in
detecting zero-day attacks (Chou and Jiang, 2021).
An Additional advantage of DL approaches is the ap-
plicability of Federated Learning (FL), a decentral-
ized iterative learning approach (Arbaoui et al., 2022;
Arbaoui et al., 2024). This guarantees collaborative
learning while preserving privacy and ensuring scala-
bility (Agrawal et al., 2022).
Graph Neural Networks (GNNs) have achieved
state-of-the-art results in detecting threats, due to their
capability to capture and leverage the graphical struc-
ture of networks (Zhong et al., 2024). However,
in network flow datasets, the available data is edge-
centric, with no predefined node features. This fun-
damental difference requires architectural changes to
node-centric traditional GNN. One adaptation is done
by Lo et al. in E-GraphSAGE (Lo et al., 2022), which
derives node representations from edge features. In
the absence of node-specific attributes, nodes are of-
ten initialized with a simple vector of ones, allowing
the model to begin learning from the edge-based in-
teractions.
While this approach enables the use of GNNs in
network flow datasets, it treats all nodes equally at
the start. This blind initialization limits the model’s
capacity to recognize key nodes that may play critical
roles in network security. Thus, there is a need for a
Termos, M., Ghalmane, Z., Brahmia, M.-E.-A., Fadlallah, A., Jaber, A. and Zghal, M.
Enhancing IoT Network Intr usion Detection with a New GraphSAGE Embedding Algorithm Using Centrality Measures.
DOI: 10.5220/0013363000003944
In Proceedings of the 10th International Conference on Internet of Things, Big Data and Security (IoTBDS 2025), pages 329-336
ISBN: 978-989-758-750-4; ISSN: 2184-4976
Copyright © 2025 by Paper published under CC license (CC BY-NC-ND 4.0)
329

more informed initialization strategy that provides the
model with a clearer starting point, helping it differ-
entiate nodes based on their structural and functional
significance from the outset.
In this work, we propose a novel node feature ini-
tialization strategy that provides the model with an
initial understanding of a node’s position and signif-
icance within the network. Our approach integrates
centrality measures to enhance the model’s contextual
awareness (Ghalmane et al., 2021). In this paper we
utilized the Degree, Betweenness, PageRank, Close-
ness, and the K-Truss centrality measures to capture
the connectivity and role of each node. By incorporat-
ing these centrality measures we advance the GNN’s
capability to discover both local and global network
structures, thereby improving intrusion detection ac-
curacy. In order to validate our proposed approach,
we held extensive experimental evaluations on four
different known and publicly available NIDS datasets:
NF-UQ-NIDS, NF-CSE-CIC-IDS2018, CCD-INID,
and X-IIoTID. Comparing the centrality-enhanced E-
GraphSage model with the traditional version shows
that the initial understanding of networks using cen-
trality measures improves the model’s ability to detect
intrusions.
The remainder of this paper is structured as fol-
lows: Section 2 presents related work, highlighting
prior research on GNN-based NIDS and the use of
centrality measures. Section 3 describes our proposed
methodology, including the integration of centralities
in E-GraphSAGE. Section 4 outlines our experimen-
tal evaluation results, demonstrating the effectiveness
of our approach. Finally, Section 5 concludes the pa-
per and discusses future research directions.
2 RELATED WORK
The use of AI in NIDS has significantly improved the
performance in detecting and classifying attacks, sur-
passing traditional signature-based NIDS (Sowmya
and Mary Anita, 2023; Brahmia et al., 2022). How-
ever, these models are trained on inherently flat data.
This overlooks the patterns present in the graphical
representation of the network of the devices. These
patterns allow GNN to have superior performance
compared to traditional deep learning models (Bilot
et al., 2023; Chaudhary et al., 2019; Protogerou et al.,
2021).
Graph Neural Networks (GNNs) are a specialized
class of deep learning models capable of learning in-
teractions between devices in a network and uncover-
ing complex patterns within network flow data (Wu
et al., 2021; Zhang et al., 2022). A GNN variant
called E-GraphSAGE was proposed by Lo et al. to
capture both the edge features of a graph as well as
the topological information. E-GraphSAGE initial-
izes the node feature vectors as a simple vector of
ones. After that, new features are learned by aggregat-
ing edge features and performing graph convolutions
(Lo et al., 2022).
Beyond GNNs, Graph patterns and information
can be derived from sources other than GNNs, such
as centrality measures, which have demonstrated their
effectiveness in various applications (Ghalmane et al.,
2019a; Ghalmane et al., 2020). Recent research
shows that complex networks measures can be used
to enhance the performance of NIDS (Termos et al.,
2024; Park et al., 2023). For instance, Termos et al.
recently incorporated Degree and Betweenness cen-
tralities to improve the accuracy of AI-driven NIDS
(Termos et al., 2023). Their results highlight the
promising integration between AI and complex net-
work analysis in enhancing NIDS performance.
Building upon the advancements in GNNs and
the integration of centrality measures in NIDS, our
work aims to enhance the E-GraphSAGE model by
integrating centrality measures into the node features
initialization process. Unlike the original approach,
where the feature vector of nodes is initialized as a
simple vector of ones, our method provides the model
with immediate insights into the structural importance
of each node in the graph. This informed initializa-
tion improves the model’s capacity to detect complex
attack patterns.
3 PROPOSED METHOD
In this section, we propose a method to enhance Net-
work Intrusion Detection Systems (NIDS) in IoT net-
works by integrating centrality measures into the E-
GraphSAGE model. The so-called ”Centrality-based
E-GraphSAGE” model combines edge features with
meaningful node initialization to improve the abil-
ity of the model to learn robust new node embed-
dings, enhancing its ability to detect complex at-
tack patterns in IoT networks. Below, we outline
the E-GraphSAGE model, explain the centrality mea-
sures used, and present the new Centrality-based E-
GraphSAGE.
The graph representation is derived from the net-
work flow data. The flows between different IP ad-
dresses naturally create a graph where each device,
represented by its IP address, is a node, and every
connection between a source IP and a destination IP
creates an edge. Each edge is characterized by the
features found in the records of the dataset. Since a
IoTBDS 2025 - 10th International Conference on Internet of Things, Big Data and Security
330

pair of nodes can have multiple connections, the type
of the graph is MultiDiGraph.
3.1 E-GraphSAGE
In our approach, we adopt the E-GraphSAGE model,
an extended version of the GraphSAGE algorithm that
supports edge classification. This is done by incorpo-
rating edge features into the aggregation phase makes
the E-GraphSAGE model. This is well-suited for net-
work flow data where only edge features are given. In
a graph G with nodes V and edges E, initial embed-
dings of nodes are initialized as a vector of ones called
h
0
v
. After that, the model aggregates the information
from the neighboring edges to create h
k
N(v)
. This oper-
ation is done at each layer k of E-GraphSAGE, having
its own weights of the aggregation function AGG
k
:
h
k
N(v)
= AGG
k
n
e
k−1
uv
, ∀u ∈ N(v), ∀uv ∈ E
o
(1)
where e
k−1
uv
is the edge embedding from previous
layer and N(v) is the neighborhood of node v.
The aggregated information from the edges is then
concatenated with the embedding of the node from
the last layer. A fully connected layer is applied on
the concatenated vector to produce a new embedding
of the node:
h
k
v
= σ
W
k
· CONCAT
h
k−1
v
, h
k
N(v)
(2)
where σ is a non-linear activation function, W
k
is
a wight matrix, and h
k−1
v
is the embedding of the node
v from the previous layer.
After K layers, the algorithm returns the final em-
bedding of node v, denoted as z
v
.
To classify the edges, both the embeddings of the
source node and the destination nodes are used to cre-
ate the final embedding of the edge:
z
uv
= AGG
edge
(z
u
, z
v
), ∀uv ∈ E (3)
If Residual connections are used, then edge fea-
tures are added in the aggregation
Building on these concepts, our contribution en-
hances the model in the initialization phase where we
used centrality measures as node features.
3.2 Centrality Measures as Node
Features for Graph Learning
Node features are a crucial component in the train-
ing of GNNs. Since the nodes in the network flow
graph are featureless, in this work, we use the central-
ity measures as a form of meaningful and insightful
feature vectors denoted c
v
for each node v ∈ V . We
use Degree, Betweenness, Closeness, PageRank, and
K-truss to quantify the importance of the node in the
graph revealing its structural properties. The GNN
model will better capture the patterns in the network
using these centrality measures as initial embeddings
of nodes.
In graph theory and complex networks, centrality
measures quantify the importance of a node accord-
ing to its position in the graph, and how they influ-
ence connections. The centrality measures used in our
work are:
Degree Centrality: Reflects the node’s connec-
tivity by capturing the number of direct neighbors
(Ghalmane et al., 2019b).
Betweenness Centrality: Highlights a node’s
role in traffic transmission by measuring how often it
lies on the shortest paths between other nodes (Ghal-
mane et al., 2018b).
Closeness Centrality: Indicates a node’s accessi-
bility by measuring the average distance to all other
nodes (Ghalmane et al., 2018a).
PageRank centrality: Evaluates a node’s influ-
ence based on its connections and the importance of
its neighbors (Ghalmane et al., 2018a). Nodes with
high PageRank are viewed as authoritative and influ-
ential.
K-truss: Reveals the node’s involvement in dense
subgraphs, emphasizing its participation in cohesive
communities (Ghalmane et al., 2018a). This process
is iterative, and can be described as follows: For each
edge in the network, count how many triangles it be-
longs to. Edges belonging to fewer than k − 2 trian-
gles are removed from the network. Repeat this pro-
cess iteratively until no edges are left to remove. The
remaining edges, along with the nodes they connect,
form the k-truss.
After the computation of these measures, they are
normalized and concatenated into a vector c
v
forming
an informative initial feature set for each node. This
ensures that the GNN starts with meaningful repre-
sentations, enhancing its ability to learn complex pat-
terns.
3.3 Centrality-Based E-GraphSAGE
Model
To detect intrusions in IoT networks, the NIDS mon-
itors the flows in the network. Network flow data
is naturally represented as a graph due to its inher-
ent structure of connections between devices. Un-
derstanding these interconnections significantly aids
in classifying and identifying patterns in the data.
A GNN is well capable of exploiting these patterns
Enhancing IoT Network Intrusion Detection with a New GraphSAGE Embedding Algorithm Using Centrality Measures
331
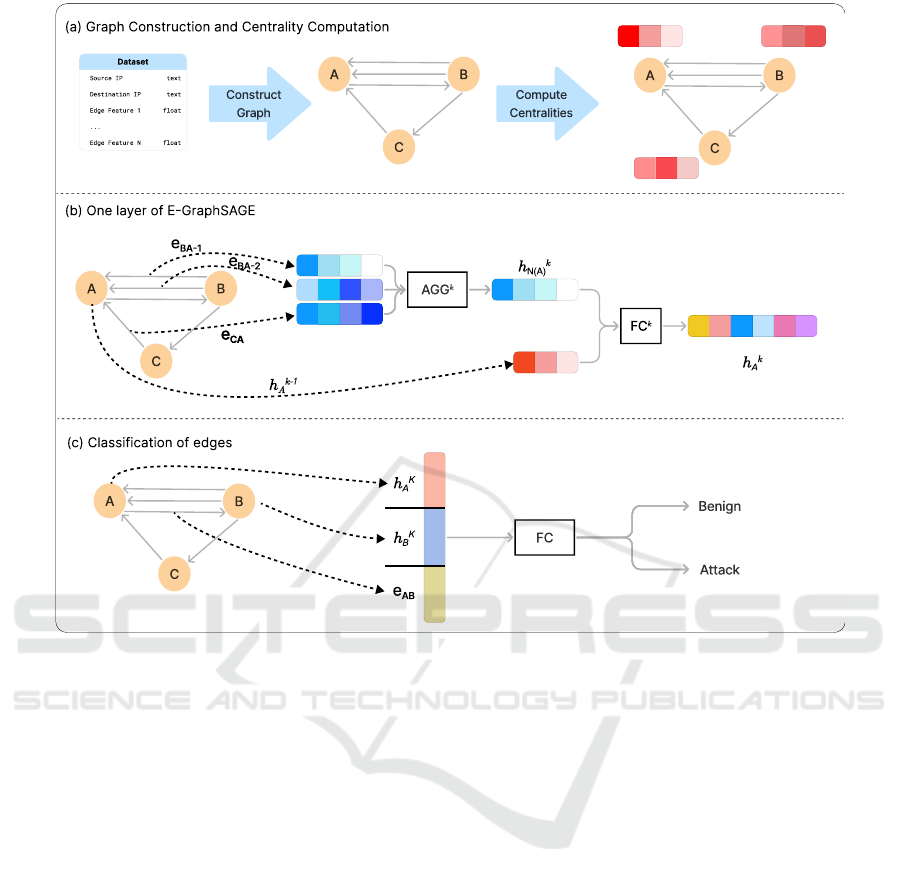
Figure 1: Overview of the proposed approach presented in three parts: (a) The graph is constructed from the dataset using IP
addresses and used both for GNN training and centrality measure computation. (b) The GNN architecture incorporates edge
features for node embedding generation. (c) Edge classification leverages embeddings of source and destination nodes along
with original edge features as residuals.
found in the graph. As a first step in our approach, we
create the graph, to be used by GNN, and at the same
time to calculate centrality measures, which we use
as informed initialization of nodes, as demonstrated
in Figure 1 (a). The second step is to incorporate the
node features into the architecture of GNN and how
it learns new embeddings of nodes. We alter the E-
GraphSAGE in order to make it use these node fea-
tures as shown in Figure 1 (b). At each layer k, the
GNN takes the edge feature vectors and aggregates
them to create a new vector h
k
N(v)
, which is fed to a
fully connected layer after being concatenated with
the node features from the previous layer. After com-
pleting all layers of GNN and learning the final em-
beddings of nodes, the third step is to classify each
edge in the graph. As demonstrated in Figure 1 (c),
we feed a fully connected layer with the embeddings
of the source node, the embedding of the destina-
tion node, and the features of the edge itself. The
edge features act as residuals in this step, preserv-
ing the original data from the corresponding record in
the dataset. This improvement is crucial to the origi-
nal E-GraphSAGE model, since if there are multiple
edges between the same pair of nodes they are classi-
fied as one class. Therefore, using the residual mech-
anism, the model is able to personalize each edge in
the graph. This improvement addresses the limitation
of the original E-GraphSAGE model, where multiple
edges between the same pair of nodes were classified
under a single class.
To ensure scalability without compromising per-
formance, we applied neighbor sampling in our
model. Instead of aggregating information from all
neighbors, we sampled 25 neighbors in the first layer
and reduced this to 10 in the second layer. This
approach balances computational efficiency with in-
formation retention, maintaining a trade-off between
breadth and depth. Our experiments, consistent with
findings from the original GraphSAGE paper, con-
firmed that this configuration delivers the best results
compared to other sampling strategies.
The steps of the Centrality-based E-GraphSAGE
Model are formalized in Algorithm 1. This algorithm
outlines the integration of centralities as node fea-
IoTBDS 2025 - 10th International Conference on Internet of Things, Big Data and Security
332

tures, the iterative embeddings updates, and residual
connections for edge classification.
Input :
• G(V , E): The graph with nodes V and edges E
• c
v
: Centralities vector for each node v ∈ V
• e
uv
: Edge features for each edge uv ∈ E
• K: Depth of the GNN model
• σ: Non-linear activation function
• AGG: Aggregation function
• N
k
(v): Sampled neighborhood at layer k
Output: New edge embeddings z
uv
, ∀uv ∈ E
Step1: Initialize node features
h
0
v
← c
v
, ∀v ∈ V
Step 2: Iterative Embedding Computation
for k = 1 to K do
for v ∈ V do
h
k
N(v)
=
AGG
k
e
k−1
uv
, ∀u ∈ N(v), ∀uv ∈ E
h
k
v
=
σ
W
k
· CONCAT
h
k−1
v
, h
k
N(v)
end
end
Final node embeddings:
z
v
= h
K
v
, ∀v ∈ V
Step 3: Compute New Edge Embeddings
foreach uv ∈ E do
if with residual then
z
uv
= AGG
edge
(z
u
, z
v
, e
uv
)
else
z
uv
= AGG
edge
(z
u
, z
v
)
end
end
return z
uv
, ∀uv ∈ E
Algorithm 1: Centrality-based E-GraphSAGE
Model.
4 EXPERIMENTAL EVALUATION
In this section, we present the experimental evaluation
of our proposed Centrality-Enhanced E-GraphSAGE
model. We consider four publicly available network
intrusion datasets, each varying in size, topology, and
format. We begin by describing these datasets, then
introduce the evaluation metrics, and finally present
and analyze our results, offering comparisons, in-
sights, and discussion.
4.1 Datasets
In this study, we use four public datasets commonly
employed for benchmarking NIDS models. Each
dataset provides labeled network flows, enabling us
to construct MultiDiGraphs and compute centrality
measures.
NF-UQ-NIDS: A comprehensive compilation of
network flows that merges multiple smaller datasets
into a universal NIDS benchmark with diverse attack
scenarios across different networks, including over
11.9 million records (Sarhan et al., 2021).
NF-CSE-CIC-IDS2018: A NetFlow-based ver-
sion of the original CSE-CIC-IDS2018, offering a to-
tal of 8,392,401 flows of which 12.14% are attack
samples and 87.86% are benign (Sarhan et al., 2021).
CCD-INID: The Center for Cyber Defense IoT
Network Intrusion Dataset (CCD-INID) provides a
modern dataset reflective of IoT network behaviors
(Liu et al., 2021). After cleaning and preprocessing,
the resulting dataset consists of 64,199 records, with
52% benign and 48% attacks.
X-IIoTID: Addressing the Industrial Internet of
Things (IIoT) systems, it contains 631,814 records,
of which 51.4% are benign and 48.6% are attacks (Al-
Hawawreh et al., 2022).
The four datasets have graphs with different prop-
erties. To show how connectivity between devices
varies between these datasets, Table 1 displays the
values of two measures that describe graphs: aver-
age degree and density. The average degree provides
a measure of the general connectivity of the graph,
while the density reflects how densely connected the
graph is, comparing the actual number of edges to the
maximum possible edges.
Table 1: Properties of graphs from datasets used in the ex-
periments: average degree and density.
Dataset
Average
Degree
Density
NF-UQ-NIDS 114.82 0.001
NF-CSE-CIC-IDS2018 79.83 0.00072
CCD-INID 453.17 2.697
X-IIoTID 4076.23 22.15
4.2 Experimental Setup
The proposed Centrality-based E-GraphSAGE model
was implemented using PyTorch and the Deep Graph
Library (DGL). We trained the GNN on a training
graph for 100 epochs. The learning rate was set to
0.001, with the Adam optimizer used for optimiza-
tion. We set the number of GNN layers to 2, with 25
Enhancing IoT Network Intrusion Detection with a New GraphSAGE Embedding Algorithm Using Centrality Measures
333
and 10 neighbors sampled for aggregation in the first
and second layers, respectively. The final embedding
dimension for nodes was set to 128, and a ReLU acti-
vation function was used.
To evaluate our approach , we used the weighted
F1-score as a key metric, a balanced measure of per-
formance, especially for imbalanced datasets. In ad-
dition to False Positive Rate (FPR), a critical metric
to know the proportion of benign samples that were
incorrectly classified as attacks.
4.3 Results and Discussion
In this study, we proposed a new approach to im-
prove GNN-based intrusion detection by using cen-
trality measures as node features. To evaluate
the performance of our approach, we tested it on
multiple datasets with varying characteristics and
compared it to the original E-GraphSAGE model,
which initializes node embeddings with a vector of
ones. Our comparison includes both the standard E-
GraphSAGE and its Residual variant.
To analyze and compare the performance of the
models in the traditional and informed initializa-
tion, we presented all quantitative results of F1-score
and False Positive Rates (FPR) across all datasets
in Table 2. The consistent improvements of the
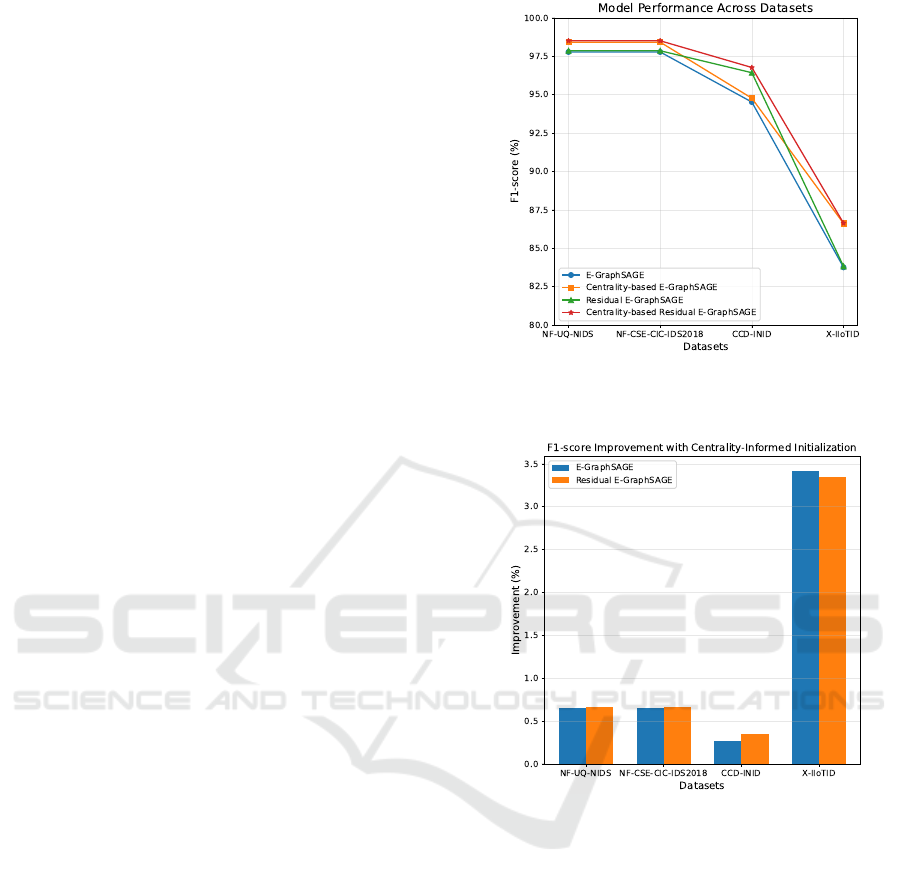
weighted F1-score and FPR across all datasets prove
that centrality-informed initialization enhances intru-
sion detection performance as shown in Figure 2. The
Residual E-GraphSAGE outperforms E-GraphSAGE
in terms of F1-score, notably on the NF-CSE-CIC-
IDS2018 dataset (98.51% vs. 98.42%) and CCD-
INID dataset (96.77% vs. 94.77%). Similarly,
the FPR decreases with informed initialization, un-
derscoring its contribution to reducing false alarms.
However, adding residual connections does not uni-
formly reduce the number of false alarms.
Our evaluation results demonstrate a consistent
improvement in performance across all datasets when
incorporating centrality-informed initialization of the
node embeddings into the E-GraphSAGE model.
These results highlight the significant impact of pro-
viding nodes with meaningful and structurally in-
formed features in enhancing the performance of de-
tecting intrusions. By initializing the node embed-
dings with centrality measures, the model starts train-
ing with features that quantify the importance of each
node in the graph, reflecting their connectivity and in-
fluence. This information plays a great role in ex-
ploiting the graph structure. When combined with
edge features to create new embeddings, the model
gains a holistic view of the global patterns in the graph
alongside the interaction of each node with its neigh-
Figure 2: F1-score comparison of E-GraphSAGE and
Residual E-GraphSAGE models with traditional and
centrality-informed initialization across multiple datasets.
Figure 3: Percentage improvement in F1-score with
centrality-informed initialization for E-GraphSAGE and
Residual E-GraphSAGE models across tested datasets.
bors. This combination enabled the model to increase
the F1-score on the X-IIoTID dataset from 83.76% to
86.62% as shown in Figure 3.
Moreover, centrality measures work well with
adding residual to the classification layer, proven by
the increase in the F1-score and the reduced FPR.
Residual E-GraphSAGE gives the model an advan-
tage by taking into account the edge features them-
selves in the last layer. This works better when the
graph has the density of the graph is high as in the X-
IIoTID and the CCD-INID datasets, as the residual in-
creases the model’s capability to distinguish between
different edges of the same node pair. The high den-
sity of a graph means that the number of edges is high
in relation to the number of nodes. However, this ad-
ditional information didn’t give consistent results in
IoTBDS 2025 - 10th International Conference on Internet of Things, Big Data and Security
334

Table 2: Weighted F1-scores and False Positive Rate (FPR) of E-GraphSAGE and Residual E-GraphSAGE models across
datasets, demonstrating improvements with centrality-informed initialization.
Dataset Model
F1-Score FPR
Traditional
Informed
Initialization
Traditional
Informed
Initialization
NF-UQ-NIDS
E-GraphSAGE 97.01 97.62 0.02994 0.02572
E-ResGraphSAGE 97.03 97.70 0.02876 0.02741
NF-CSE-CIC-IDS2018
E-GraphSAGE 97.78 98.42 0.02204 0.01605
E-ResGraphSAGE 97.86 98.51 0.01818 0.01451
CCD-INID
E-GraphSAGE 94.52 94.77 0.0001 0.00007
E-ResGraphSAGE 96.43 96.77 0.0059 0.0005
X-IIoTID
E-GraphSAGE 83.76 86.62 0.3061 0.2563
E-ResGraphSAGE 83.83 86.64 0.3046 0.2559
reducing FPR, proving that edge features alone may
increase the detection rate, but is not sufficient to re-
duce the number of false alarms.
In general, the centrality-informed initialization
when combined with Residual E-GraphSAGE had
the best accuracy in identifying intrusions, achiev-
ing 97.70% on the NF-UQ-NIDS dataset, 98.51%
on the NF-CSE-CIC-IDS2018 dataset, 96.77% on
the CCD-INID dataset, and 86.61% on the X-IIoTID
dataset. However, dropping the residual mechanism
has shown more consistent results with the False Pos-
itive Rates.
Overall, these findings demonstrate that resid-
ual connections stabilize learning and maintain cru-
cial information while combining node and edge fea-
tures into a single embedding framework capitalizes
on the advantages of both feature types. Apply-
ing these strategies together has been demonstrated
to increase model accuracy, lower false alarms, and
promise reliable results on a variety of network intru-
sion datasets, even with class imbalance as in the case
of the NF-CSE-CIC-IDS2018 dataset. These find-
ings were consistent with multi-class classifications,
where the model classify different kinds of attacks.
These improvements justify the additional computa-
tional overhead due to integrating centrality measures,
as their complexity is considerably lower than that
of Deep Learning models. Deploying GNN-based
NIDS in environments with limited resources pose
challenges that we plan to address in future work.
5 CONCLUSION AND FUTURE
WORK
Network Intrusion Detection Systems (NIDS) play
a critical role in ensuring the security of IoT net-
works against increasingly sophisticated threats. In
this study, we aimed to enhance the performance
of NIDS by integrating centrality measures into
graph neural network (GNN) architectures. Specifi-
cally, we employed E-GraphSAGE and Residual E-
GraphSAGE models with centrality-informed initial-
ization to improve classification accuracy. Our re-
sults demonstrated notable performance gains across
diverse datasets, with weighted F1-scores improving
by up to 3.4% over traditional initialization strate-
gies, with weighted F1-scores increasing by up to
3.4% for models employing centrality-informed ini-
tialization compared to traditional setups. Addition-
ally, we observed a consistent decrease in False Pos-
itive Rate (FPR), underscoring the effectiveness of
combining node and edge features within a unified
embedding framework. Incorporating centrality mea-
sures and residual connections proved beneficial in
addressing challenges posed by imbalanced datasets,
thereby increasing the models’ robustness in detect-
ing intrusions. Our primary contribution lies in the
novel integration of centrality measures with graph-
based NIDS.
As a direction for our future work, we plan to
focus on exploring more complex network proper-
ties and integrating them into the GraphSAGE algo-
rithm. By incorporating richer topological indica-
tors and structural patterns, we aim to provide even
more discriminative features at initialization. This ap-
proach holds the potential to further improve detec-
tion accuracy, reduce false alarms, and enhance the
adaptability of NIDS in diverse and evolving IoT en-
vironments.
Enhancing IoT Network Intrusion Detection with a New GraphSAGE Embedding Algorithm Using Centrality Measures
335

ACKNOWLEDGEMENTS
This work is supported by CESI EAST Region and
Ektidar, a Lebanese project aimed at empowering
youth.
REFERENCES
Agrawal, S., Sarkar, S., Aouedi, O., Yenduri, G., Piamrat,
K., Alazab, M., Bhattacharya, S., Maddikunta, P.
K. R., and Gadekallu, T. R. (2022). Federated learn-
ing for intrusion detection system: Concepts, chal-
lenges and future directions. Computer Communica-
tions, 195:346–361.
Al-Hawawreh, M., Sitnikova, E., and Aboutorab, N. (2022).
X-iiotid: A connectivity-agnostic and device-agnostic
intrusion data set for industrial internet of things.
IEEE Internet of Things Journal, 9(5):3962–3977.
Arbaoui, M., Brahmia, M.-E.-A., and Rahmoun, A. (2022).
Towards secure and reliable aggregation for federated
learning protocols in healthcare applications. In 2022
Ninth International Conference on Software Defined
Systems (SDS), pages 1–3.
Arbaoui, M., Brahmia, M.-e.-A., Rahmoun, A., and Zghal,
M. (2024). Federated learning survey: A multi-level
taxonomy of aggregation techniques, experimental in-
sights, and future frontiers. ACM Trans. Intell. Syst.
Technol., 15(6).
Bilot, T., Madhoun, N. E., Agha, K. A., and Zouaoui, A.
(2023). Graph neural networks for intrusion detection:
A survey. IEEE Access, 11:49114–49139.
Brahmia, M.-e.-A., Babouche, S., Ouchani, S., and Zghal,
M. (2022). An adaptive attack prediction framework
in cyber-physical systems. In 2022 Ninth Interna-
tional Conference on Software Defined Systems (SDS),
pages 1–7.
Chaudhary, A., Mittal, H., and Arora, A. (2019). Anomaly
detection using graph neural networks. In 2019 Inter-
national Conference on Machine Learning, Big Data,
Cloud and Parallel Computing (COMITCon), pages
346–350.
Chou, D. and Jiang, M. (2021). A survey on data-driven net-
work intrusion detection. ACM Comput. Surv., 54(9).
Ghalmane, Z., Cherifi, C., Cherifi, H., and Hassouni,
M. E. (2019a). Centrality in complex networks with
overlapping community structure. Scientific Reports,
9(1):10133.
Ghalmane, Z., Cherifi, C., Cherifi, H., and Hassouni, M. E.
(2020). Exploring hubs and overlapping nodes inter-
actions in modular complex networks. IEEE Access,
8:79650–79683.
Ghalmane, Z., Cherifi, C., Cherifi, H., and Hassouni,
M. E. (2021). Extracting modular-based backbones in
weighted networks. Information Sciences, 576:454–
474.
Ghalmane, Z., El Hassouni, M., Cherifi, C., and Cherifi, H.
(2018a). k-truss decomposition for modular centrality.
In 2018 9th International Symposium on Signal, Im-
age, Video and Communications (ISIVC), pages 241–
248.
Ghalmane, Z., Hassouni, M. E., and Cherifi, H. (2018b).
Betweenness centrality for networks with non-
overlapping community structure. In 2018 IEEE
Workshop on Complexity in Engineering (COM-
PENG), pages 1–5.
Ghalmane, Z., Hassouni, M. E., and Cherifi, H. (2019b).
Immunization of networks with non-overlapping com-
munity structure. Social Network Analysis and Min-
ing, 9(1):45.
Liu, Z., Thapa, N., Shaver, A., Roy, K., Siddula, M., Yuan,
X., and Yu, A. (2021). Using embedded feature selec-
tion and CNN for classification on CCD-INID-V1-A
new IoT dataset. Sensors (Basel), 21(14).
Lo, W. W., Layeghy, S., Sarhan, M., Gallagher, M., and
Portmann, M. (2022). E-graphsage: A graph neu-
ral network based intrusion detection system for iot.
In NOMS 2022-2022 IEEE/IFIP Network Operations
and Management Symposium, pages 1–9.
Park, S. B., Jo, H. J., and Lee, D. H. (2023). G-idcs: Graph-
based intrusion detection and classification system for
can protocol. IEEE Access, 11:39213–39227.
Protogerou, A., Papadopoulos, S., Drosou, A., Tzovaras,
D., and Refanidis, I. (2021). A graph neural net-
work method for distributed anomaly detection in iot.
Evolving Systems, 12(1):19–36.
Sarhan, M., Layeghy, S., Moustafa, N., and Portmann, M.
(2021). Netflow datasets for machine learning-based
network intrusion detection systems. In Deze, Z.,
Huang, H., Hou, R., Rho, S., and Chilamkurti, N., ed-
itors, Big Data Technologies and Applications, pages
117–135, Cham. Springer International Publishing.
Sowmya, T. and Mary Anita, E. (2023). A comprehensive
review of ai based intrusion detection system. Mea-
surement: Sensors, 28:100827.
Termos, M., Ghalmane, Z., Brahmia, M.-E.-A., Fadlallah,
A., Jaber, A., and Zghal, M. (2023). Intrusion detec-
tion system for iot based on complex networks and
machine learning. In 2023 IEEE Intl Conf on De-
pendable, Autonomic and Secure Computing (DASC),
pages 0471–0477.
Termos, M., Ghalmane, Z., el Amine Brahmia, M., Fad-
lallah, A., Jaber, A., and Zghal, M. (2024). Gdlc: A
new graph deep learning framework based on central-
ity measures for intrusion detection in iot networks.
Internet of Things, 26:101214.
Wu, Z., Pan, S., Chen, F., Long, G., Zhang, C., and Yu,
P. S. (2021). A comprehensive survey on graph neural
networks. IEEE Transactions on Neural Networks and
Learning Systems, 32(1):4–24.
Zhang, B., Li, J., Chen, C., Lee, K., and Lee, I. (2022). A
practical botnet traffic detection system using gnn. In
Meng, W. and Conti, M., editors, Cyberspace Safety
and Security, pages 66–78, Cham. Springer Interna-
tional Publishing.
Zhong, M., Lin, M., Zhang, C., and Xu, Z. (2024). A sur-
vey on graph neural networks for intrusion detection
systems: Methods, trends and challenges. Computers
& Security, 141:103821.
IoTBDS 2025 - 10th International Conference on Internet of Things, Big Data and Security
336
