
Automated Social Media Feedback Analysis for Software Requirements
Elicitation: A Case Study in the Streaming Industry
Melissa Silva
1
and Jo
˜
ao Pascoal Faria
1,2
1
Faculty of Engineering, University of Porto, Porto, Portugal
2
INESC TEC, Porto, Portugal
Keywords:
Requirements Engineering, Social Media, Requirements Mining.
Abstract:
Requirements Engineering (RE) is crucial for product success but challenging for software with a broad user
base, such as streaming platforms. Developers must analyze vast user feedback, but manual methods are im-
practical due to volume and diversity. This research addresses these challenges by automating the collection,
filtering, summarization, and clustering of user feedback from social media, suggesting feature requests and
bug fixes through an interactive platform. Data from Reddit, Twitter, iTunes, and Google Play is gathered via
web crawlers and APIs and processed using a novel combination of natural language processing (NLP), ma-
chine learning (ML), large language models (LLMs), and incremental clustering. We evaluated our approach
with a partner company in the streaming industry, extracting 66,168 posts related to 10 streaming services and
identifying 22,847 as relevant with an ML classifier (75.5% precision, 74.2% recall). From the top 100 posts,
a test user found 89 relevant and generated 47 issues in 80 minutes—a significant reduction in effort compared
to a manual process. A usability study with six specialists yielded a SUS score of 83.33 (“Good”) and very
positive feedback. The platform reduces cognitive overload by prioritizing high-impact posts and suggesting
structured issue details, ensuring focus on insights while supporting scalability.
1 INTRODUCTION
Requirements Engineering (RE) is crucial in software
development, encompassing activities such as elicita-
tion, analysis, negotiation, documentation, and vali-
dation of requirements. A software product’s success
largely depends on this process’s effectiveness, as re-
quirements form the foundation of software quality.
According to (Li et al., 2018), approximately 60% of
errors in software development projects originate dur-
ing the RE phase, and rectifying these errors later is
costly.
Despite its importance, RE is often plagued by
challenges stemming from poorly defined require-
ments and limited user involvement (Ali and Hong,
2019). User feedback is essential for success, align-
ing the RE process with end-users’ visions and needs.
However, involving end-users can be difficult due to
their unavailability, uncertainty about their identities
(particularly in market-driven development), and the
high costs associated with traditional RE techniques,
which are particularly burdensome for small startups
(Ali and Hong, 2019).
Recent advancements in data-driven RE and
Crowd-based RE (CrowdRE) have highlighted the po-
tential of leveraging social media and other crowd-
sourced data to address these challenges. Studies have
explored using natural language processing (NLP)
and machine learning (ML) to classify and analyze
feedback, laying a foundation for integrating social
media insights into RE workflows (Maalej et al.,
2016b); (Groen et al., 2017). However, many of these
studies remain theoretical, with limited practical ap-
plications or interaction with industry partners. There
is a lack of end-to-end approaches applied in indus-
trial environments.
This research extends these foundations by intro-
ducing an interactive platform that bridges the gap
between feedback extraction and actionable require-
ments. Unlike prior works, our platform not only col-
lects and processes social media feedback but also in-
tegrates directly with tools like GitLab, automating
issue creation and pre-filling all relevant fields. Users
can easily refine these fields, streamlining the transi-
tion from feedback to implementation.
In this case study, we applied the platform to
gather feedback on various streaming platforms, pro-
viding our industrial partner with a clear picture of
Silva, M. and Faria, J. P.
Automated Social Media Feedback Analysis for Software Requirements Elicitation: A Case Study in the Streaming Industry.
DOI: 10.5220/0013364300003928
In Proceedings of the 20th International Conference on Evaluation of Novel Approaches to Software Engineering (ENASE 2025), pages 149-160
ISBN: 978-989-758-742-9; ISSN: 2184-4895
Copyright © 2025 by Paper published under CC license (CC BY-NC-ND 4.0)
149

user expectations to improve their Over-The-Top TV
platform. By analyzing social media feedback, the
platform helped the company understand which fea-
tures users are requesting and the most common is-
sues they encounter, enabling them to make informed
decisions to remain competitive in the streaming in-
dustry.
Contributions to the state of the art include an
innovative end-to-end workflow and interactive plat-
form for processing social media feedback, validated
by industry professionals. This workflow uses ad-
vanced techniques such as Large Language Models
(LLMs) and introduces new features like automated
issue creation and requirement suggestions.
In addition to the introduction, this document is
structured as follows: Chapter 2 discusses the state
of the art regarding social media-based requirements
gathering. Chapter 3 outlines the development of the
feedback processing workflow. Chapter 4 explains
the creation of the visualization platform. Chapter
5 presents the experiments to evaluate the platform.
Chapter 6 discusses limitations, and Chapter 7 sum-
marizes the findings. For further details, please con-
sult (Silva, 2024).
2 STATE OF THE ART
This study seeks to address the lack of tools that
not only extract and classify requirements from social
media but also allow stakeholders to actively interact
with and act upon these requirements. Our goal is to
bridge the gap between academic research and practi-
cal application by creating an interactive platform that
integrates automation and actionable workflows.
To develop this platform, we first needed to un-
derstand the current use of social media for RE. This
exploration was essential to identify gaps and guide
the design of our approach.
We started by asking:
RQ1: What works exist to extract require-
ments from social networks?
Several studies have explored mining user feed-
back from social media platforms, such as app stores,
Twitter, Reddit, and Facebook (Iqbal et al., 2021);
(Nayebi et al., 2018); (Oehri and Guzman, 2020);
(Williams and Mahmoud, 2017). These studies high-
light the potential of social media feedback to provide
profound insights into user needs, including bug re-
ports and feature requests (Iqbal et al., 2021). Most
studies collect feedback from the product’s page (in
app stores), posts on the product’s forum (like Red-
dit), or posts where users directly address the prod-
uct’s accounts (such as on Twitter). However, ap-
proaches that rely on manual intervention lack scal-
ability or fail to capture diverse sources effectively,
highlighting the need for automatic extraction, which
led us to the following question:
RQ2: What works exist about automatically
classifying candidate requirements extracted
from social networks?
Initial efforts in this field were manual (Kanchev
and Chopra, 2015); (Scanlan et al., 2022), but the vol-
ume of social media data required the development of
automated or semi-automated mechanisms. Common
workflows include data extraction (via scrapers or
APIs), pre-processing, and classification using algo-
rithms such as Decision Trees (DT), Random Forest
(RF), Support Vector Machines (SVM), Naive Bayes
(NB), and Multinomial Naive Bayes (MNB). These
algorithms categorize feedback into relevant and ir-
relevant categories. The relevant feedback is divided
into three typical groups: feature requests, bug re-
ports, and other (Guzman et al., 2017); (Williams and
Mahmoud, 2017).
Some studies introduced specific preprocessing
steps to enhance performance, such as stemming,
lemmatization, verb tense detection, sentiment analy-
sis, and handling data imbalance. Others added post-
classification techniques like clustering, topic model-
ing and summarization to improve the organization
and interpretation of classified data (Guzman et al.,
2017); (Williams and Mahmoud, 2017); (Iqbal et al.,
2021); (Oehri and Guzman, 2020); (Ebrahimi and
Barforoush, 2019); (McIlroy et al., 2016); (Panichella
et al., 2016); (Maalej et al., 2016a); (Di Sorbo et al.,
2017); (Villarroel et al., 2016).
However, many approaches stop at classification,
failing to integrate workflows that connect extracted
feedback to actionable tasks in real-world software
development. This leads to the need for interactive
interfaces, as addressed in our third research question:
RQ3: What works exist about the visualiza-
tion of candidate requirements extracted from
social networks?
While many tools focus on classifying and prior-
itizing feedback, fewer address interactive visualiza-
tion. We identified five key works in this area:
• ARdoc: Offers a simple GUI for importing
and classifying reviews into categories like “Fea-
ture Request”, “Problem Discovery”, “Informa-
tion Seeking” and “Information Giving” with
category-specific color highlights. It lacks au-
tomated feedback gathering, filtering and navi-
gation, among other features (Panichella et al.,
2016);
ENASE 2025 - 20th International Conference on Evaluation of Novel Approaches to Software Engineering
150
• OpenReq Analytics: Displays feedback trends
via heat maps, sentiment analysis, and keyword
searches, organized into problem reports and in-
quiries. ML models classify feedback, allow-
ing refinement through user interaction. While
comprehensive, it lacks dynamic feedback navi-
gation and integration with social media platforms
(Stanik and Maalej, 2019);
• CLAP: Automatically clusters and prioritizes
user feedback into “Bug Report”, “Feature Re-
quest” and “Other”. However, reviews must be
manually imported, and the tool does not include
search or advanced filtering options (Villarroel
et al., 2016);
• SURF: A command-line tool for summarizing
user feedback stored in XML files, categorized by
topic. It generates bar charts for intent distribu-
tion, but lacks built-in visualization or navigation
capabilities, requiring external tools to display re-
sults (Di Sorbo et al., 2017);
• The Automatic Classification Tool: Retrieves
app reviews automatically and visualizes trends
via bar and pie charts but it is limited to app stores
(Maalej et al., 2016a).
While these tools provide valuable functionality,
they often lack dynamic interaction, task integration,
or validation in industrial contexts.
The limitations identified in RQ1, RQ2, and RQ3
reveal a critical need for tools that integrate extrac-
tion, classification, and interactive visualization into
actionable workflows validated in industrial settings.
Building on these insights, our work addresses three
key gaps:
• A lack of practical, end-to-end workflows that
transition seamlessly from data extraction to ac-
tionable tasks;
• Limited interactive features to allow stakeholders
to explore and refine extracted requirements;
• A disconnect between academic tools and their
application in industrial settings.
To address these gaps, we developed and validated
an interactive platform that integrates requirement ex-
traction, classification, interaction, and GitLab issue
creation. By bridging these gaps, we aim to enable
stakeholders to transition smoothly from raw feed-
back to actionable tasks, improving decision-making
and fostering collaboration.
3 SOCIAL MEDIA FEEDBACK
PROCESSING WORKFLOW
Our goal is to automatically collect user feedback
from diverse social media platforms related to a do-
main or product of interest (in this case, streaming ser-
vices of interest to our industrial partner), and present
processed user feedback to stakeholders in a way that
facilitates the derivation of actionable issues (new fea-
tures, bug fixes, etc.) for product evolution.
As such, our solution comprises two main compo-
nents: (i) a social media feedback processing work-
flow implemented by modular Python scripts (de-
scribed in this Section) and (ii) a Web-based user in-
terface for generating actionable issues from the pro-
cessed feedback (described in Section 4).
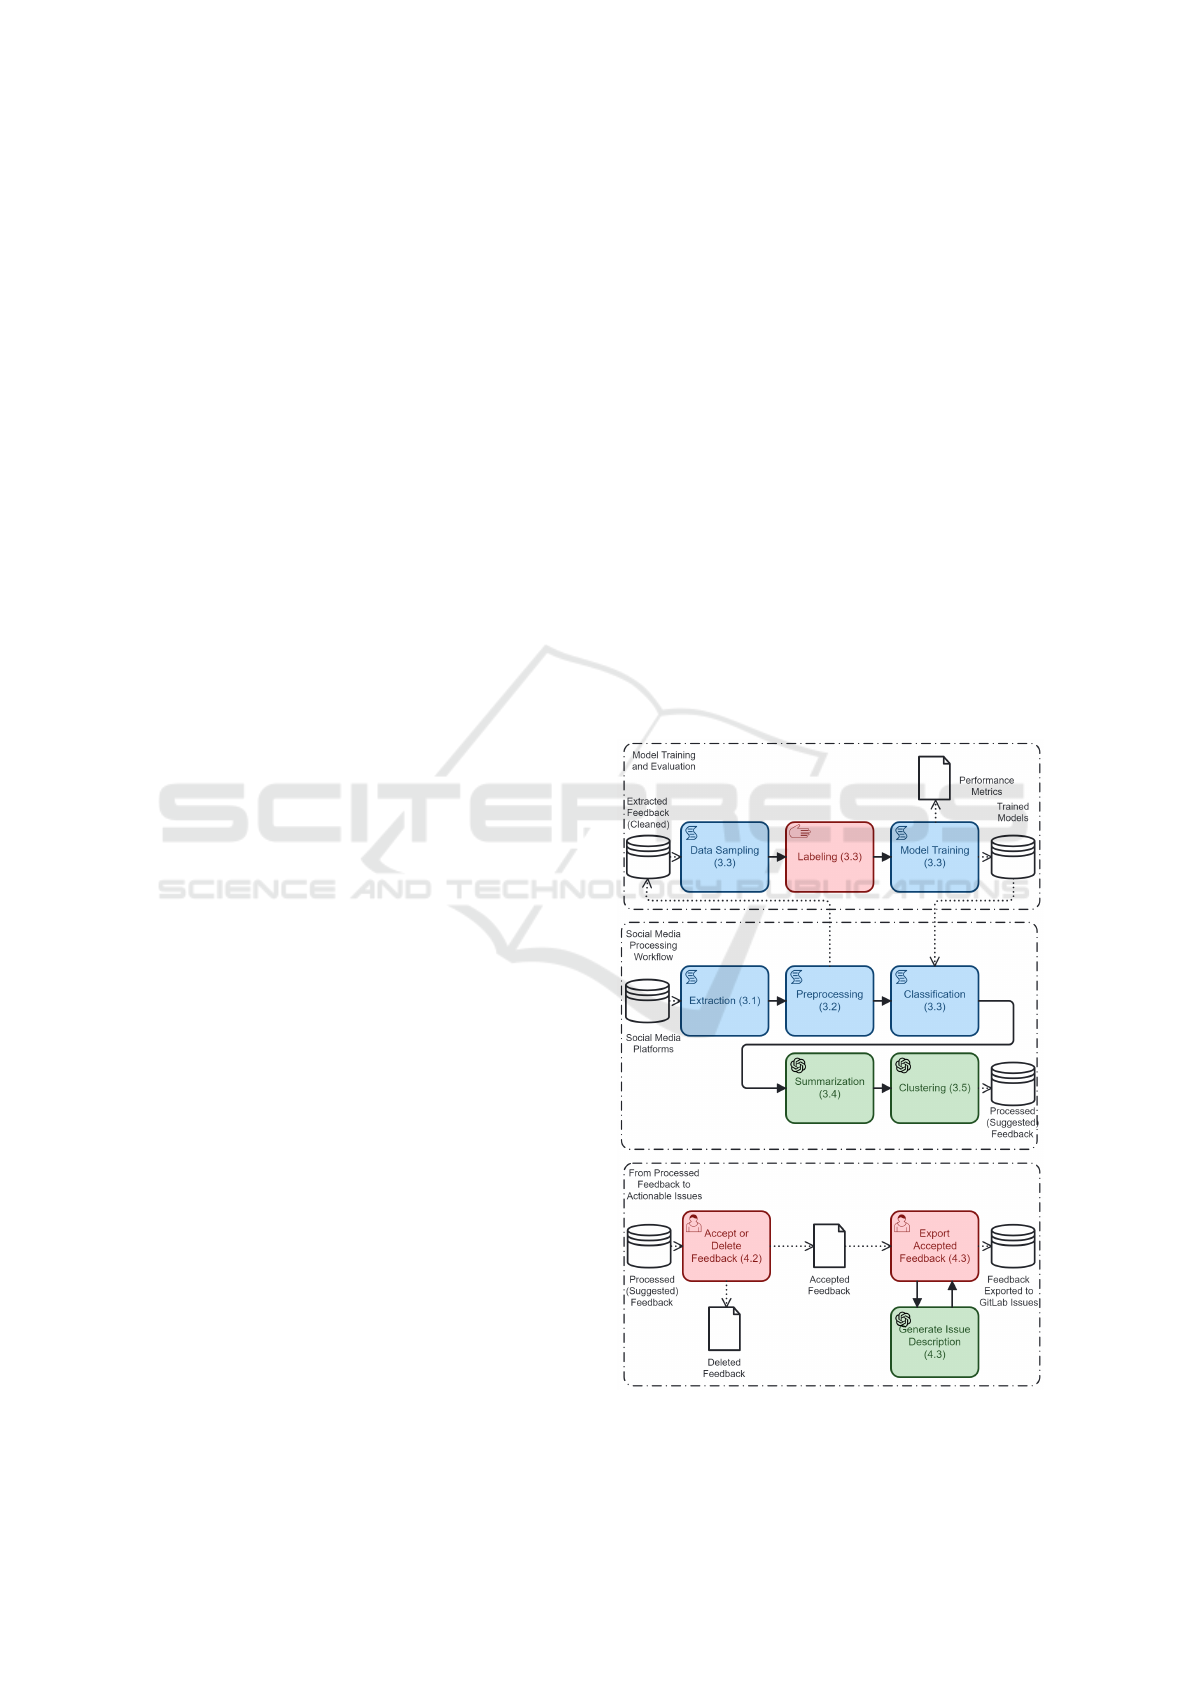
Figure 1 depicts the system and user workflows
in our approach, distinguishing manual or interac-
tive user tasks (pink), system tasks implemented by
Python scripts (blue), and system tasks that rely on
OpenAI’s GPT-3.5 Turbo model (green). The section
of the paper where each task is described is indicated
in parentheses.
Figure 1: Bpmn Diagram of the Processing Workflows.
Automated Social Media Feedback Analysis for Software Requirements Elicitation: A Case Study in the Streaming Industry
151

We distinguish three sub-processes, which may
occur with different frequencies:
• Social Media Processing Workflow: comprises
the steps performed automatically by Python
scripts to extract posts from selected social me-
dia platforms based on predefined keywords and a
user-defined timeframe, clean the extracted data,
classify the extracted posts regarding their rele-
vance and type, and summarize and cluster the
posts that were classified as potentially relevant;
• Model Training and Evaluation: comprises the
steps conducted to generate classification mod-
els using supervised machine learning techniques;
model training can be repeated as new labelled
data is generated in the next sub-process;
• From Processed Feedback to Actionable Items:
comprises the steps performed by the user, with
system support, to generate actionable issues in
an issue tracking system (currently GitLab) from
the processed feedback.
3.1 Data Extraction
To capture a broad and representative sample of user
feedback, we selected four key sources: iTunes,
Google Play, Twitter, and Reddit. While existing lit-
erature typically relies on at most two sources, our ap-
proach reflects a strategic effort to combine structured
app store reviews, real-time social media interactions,
and in-depth forum discussions.
The selection of these platforms was guided by
three main criteria:
• Textual Feedback Availability: We prioritized
platforms with substantial user-generated textual
content, ensuring suitability for NLP analysis;
• Public Accessibility: Only platforms with pub-
licly available data, accessible via APIs or
custom-built scrapers, were included;
• Relevance to Streaming Services: The chosen
platforms provide rich datasets related to user ex-
periences, feature requests, and issue reporting.
To further ensure the relevance and diversity of the
collected feedback, we analyzed ten streaming ser-
vices, selected based on the following considerations:
• Service Relevance: Four services were chosen
due to their direct association with our industrial
partner, aligning with their strategic interests;
• Market Popularity: The remaining six services
were selected based on their global user base,
subscription numbers, social media activity, and
market presence at the time of the study. This
approach ensured a balanced representation of
widely used and emerging platforms.
Our data collection was limited to posts from Jan-
uary 2023 to March 2024, to focus on recent insights
and maintain a manageable yet representative dataset.
Feedback from app stores was collected directly from
the apps’ pages using APIs and custom scrapers.
On Twitter, we performed targeted searches com-
bining the streaming service’s name with keywords
such as “feature,” “option,” “fix,” “issue,” and “bug”
to extract posts specifically discussing features or
problems. A similar approach was applied to Red-
dit, where we analyzed posts from relevant subreddits
identified through prior research. These subreddits in-
cluded:
• Official Subreddits dedicated to the streaming
platforms, where available;
• Popular Alternatives with high user engagement
for platforms lacking official subreddits;
• Subreddits focused on devices frequently used to
access streaming services (e.g., smart TVs and
streaming devices) to capture device-related user
experiences.
In total, 73,214 posts were extracted across the
four platforms. These included app store reviews and
social media posts, with replies on Twitter and Red-
dit counting toward the total. Table 1 summarizes
the number of posts extracted per streaming service
and social media platform. The last two rows are dis-
cussed in the next subsections.
Table 1: Statistics of Extracted, Cleaned and Relevant Posts.
Streaming Social Media Platform (i) Total
Service iTunes Google Twitter Reddit
Play
ACL Player NA NA 69 428 497
Gas Digital Network 52 NA 64 99 215
Ita
´
u Cultural Play 5 3000 300 4 3309
RTP Play 15 199 1029 6157 7400
Netflix 1013 3000 2222 6636 12871
(HBO) Max 302 3000 1838 5432 10572
Hulu 1004 3000 1845 3032 8881
Prime Video
1008 3000 1492 4440 9940
Peacock 1008 3000 1788 3343 9139
Disney Plus 1008 3000 1109 5251 10368
Total Extracted 5415 21199 11756 34822 73214
Cleaned Total 5413 14230 11706 34819 66168
Classified Relevant (N
i
) 2591 8623 2888 8745 22847
3.2 Preprocessing
We standardized the data formats and ensured unifor-
mity across datasets using the following steps:
1. Date Formatting: Unified all date formats to
“month day year time” (e.g., “May 01 2023
ENASE 2025 - 20th International Conference on Evaluation of Novel Approaches to Software Engineering
152

04:43:01”);
2. Column Standardization: Harmonized column
names across datasets and removed irrelevant
columns;
3. Data Concatenation: Merged titles and feedback
text into a single string for iTunes and Reddit
datasets, following a similar approach as (Oehri
and Guzman, 2020).
Further data cleaning involved:
1. Null and Duplicate Removal: Eliminated null
content, duplicate entries, and bot-generated con-
tent. The latter was primarily identified through
explicit self-declarations (e.g., posts containing
the phrase “I am a bot”);
2. Keyword and Content Filtering: Removed ex-
tra whitespaces, unnecessary keywords, mark-
down tags, and content from official accounts;
3. Connect Tweets with Their Replies: Linked
tweets with their replies to facilitate conversation
analysis.
To standardize text and prepare it for classification
models, we performed the following text processing
steps:
1. Text Normalization: Converted text to lowercase
and removed special characters;
2. URL Replacement: Replaced URLS with the
marker link , as recommended by (Guzman et al.,
2017);
3. Word and Abbreviation Expansion: Expanded
contractions (e.g., “couldn’t” to “could not”) us-
ing a list of common English contractions
1
(McIl-
roy et al., 2016). Futhermore, replaced common
abbreviations (e.g., “op” to “original poster”) to
improve readability and understanding;
4. Verb Tense Identification: Following (Tizard
et al., 2019) and (Maalej et al., 2016a), we ana-
lyzed verb tense to understand the temporal nature
of user feedback. Past tense often indicates re-
ported experiences (e.g., bugs), while future tense
frequently highlights feature requests or hypothet-
ical scenarios. We used the Python library nltk
to identify verb tenses by tokenizing sentences
and applying a POS tagger. For composite future
tenses and irregular verbs, we implemented man-
ual rules, and for non-English posts, we translated
them into English using googletrans. Out of
66,168 posts, 5,795 were non-English and trans-
lated for analysis. Additionally, for posts with
1
https://www.yourdictionary.com/articles/
contractions-correctly
multiple sentences, we calculated the ratio of past,
present, and future tenses to gain insights into
temporal patterns of user feedback;
5. Sentiment Analysis: We employed the
PySentiStr library with the SentiStrength
algorithm to perform sentiment analysis, discern-
ing polarity (positive, negative, neutral) in user
feedback. Sentiment polarity provides insights
into user satisfaction, with negative sentiment
often highlighting bugs or complaints, and
positive sentiment indicating praise or successful
features. Following (Villarroel et al., 2016), we
averaged sentiment scores for each author’s posts
and systematically removed negations to improve
accuracy;
6. Typo Correction: To address typos in social me-
dia posts, we used the SpellChecker library, ver-
ifying posts are in English before applying correc-
tions. While this improves text accuracy, it is not
flawless due to context-dependent errors, such as
confusing “loose” with “lose.”
After these processing steps, we obtained refined
datasets that were ready for further analysis, totaling
66,168 posts (second row from the bottom in Table 1).
3.3 Classification
To prepare the data for supervised classification, we
manually labeled a statistical sample of 1% of the
dataset (picking a random sample of 1% of the posts
extracted from each social media platform). Posts
were marked as relevant or irrelevant based on their
potential utility to the industrial partner. Posts were
considered relevant if they discussed features, bugs,
or user experiences and excluded if they solely fo-
cused on content (e.g., specific shows).
We trained and tested classification models using
supervised learning to predict the relevance of posts,
with the target variable being “relevant.” We used var-
ious algorithms, including DT, RF, SVM, NB, and
MNB, alongside preprocessing techniques like stop-
word removal, stemming, and lemmatization. We se-
lected widely used algorithms based on their preva-
lence in the literature and proven effectiveness.
For tokenization, stemming, and lemmatization,
we used the nltk library. Feature engineering in-
volved TfidfVectorizer, CountVectorizer (CV), post
length, and word/sentence embeddings (Word2Vec,
FastText, SBERT, USE). We tested models un-
der different data balance scenarios using SMOTE,
GridSearchCV, and RandomSearch for hyperparam-
eter tuning and evaluated performance using metrics
like precision (P), recall (R), F1-measure (F), accu-
racy (A), and area under the curve (AUC).
Automated Social Media Feedback Analysis for Software Requirements Elicitation: A Case Study in the Streaming Industry
153

The original scraped data, detailed variations, and
corresponding results can be found in GitHub
2
.
We selected the best model for each social media
platform by comprehensively analyzing the values of
F1-measure, accuracy, and AUC. Based on these met-
rics, we identified the combination of the model and
technique that produced the best results. It is essential
to acknowledge that our results might be subject to
biases, such as overfitting, and that real-world perfor-
mance could be lower than the training results due to
these factors. Table 2 showcases the algorithms (mod-
els and techniques) chosen to predict the relevance of
posts on each social media platform.
Table 2: Best Supervised Learning Algorithm per Platform.
Platform (i) Algorithm P
i
R
i
F
i
A
i
AUC
i
iTunes SVM+CV+SMOTE .80 1.00 .89 .91 .96
Google Play RF+CV+SMOTE .90 .90 .90 .86 .90
Reddit NB+USE .65 .57 .60 .76 .81
Twitter NB+CV+SMOTE .60 .67 .63 .78 .81
The last row in Table 1 summarizes the number
of posts classified as (potentially) relevant from the
cleaned dataset, totalling 22,847 posts.
Since we use distinct models for distinct datasets,
the overall precision (P) and recall (R) for the union
of the datasets can be calculated based on the number
of retrieved instances from each dataset (N
i
) and the
precision (P
i
) and recall (R
i
) of each model, as fol-
lows:
P =
∑
N
i
· P
i
∑
N
i
R =
∑
N
i
· P
i
∑
N
i
· P
i
/R
i
Using the precision (P
i
) and recall (R
i
) metrics
from Table 2 and the number of retrieved instances
(N
i
) from Table 1, we estimate the overall precision
and recall of our classification models for the com-
bined dataset as 75.5% and 74.2%, respectively.
3.4 Summarization
Summarization condenses individual posts to high-
light their key points, simplifying the visualization of
user feedback. This enables stakeholders to quickly
identify critical information, such as bugs, feature re-
quests, or user experiences, without reading lengthy
texts.
To achieve this, we adopted an LLM-based ap-
proach using GPT-3.5 Turbo via the OpenAI API
3
.
The summarization was performed using the follow-
ing prompt, which was refined over several iterations
(where text represents the input to be summarized):
2
https://tinyurl.com/yrhd4k68
3
https://platform.openai.com/
prompt = f"Concisely summarize this feedback,
capturing its main idea: ’{text}’. Maintain the
original language style; avoid third-person.
Keep it under 20 words."
GPT-3.5 Turbo was chosen because it demon-
strated superior performance compared to tradi-
tional summarization methods like TextRank, T5,
and LexRank, and provided a better cost-benefit
ratio compared to other LLMs. Table 3 shows
that it achieved significantly higher ROUGE (Recall-
Oriented Understudy for Gisting Evaluation)
4
scores
for precision and recall across all metrics.
Table 3: Evaluation of Summarization Algorithms.
ROUGE-1 ROUGE-2 ROUGE-L ROUGE-Lsum
Algorithm P R P R P R P R
Spacy .24 .40 .14 .22 .21 .35 .21 .35
Pegasus .26 .34 .13 .18 .24 .30 .24 .30
XLNet .37 .37 .20 .21 .35 .34 .35 .34
GPT2 .37 .37 .20 .21 .35 .34 .35 .34
Txtai .40 .42 .23 .23 .36 .37 .36 .37
SumBasic .32 .59 .16 .32 .27 .51 .27 .51
TextRank .31 .66 .18 .38 .27 .57 .27 .57
LexRank .34 .67 .20 .39 .30 .58 .30 .58
BART .37 .59 .22 .35 .33 .53 .33 .53
T5 .39 .58 .24 .35 .35 .51 .35 .51
GPT-3.5 Turbo .81 .84 .76 .80 .80 .83 .80 .83
3.5 Clustering
Given the large number of user feedback posts, clus-
tering is important to organize user feedback into the-
matic groups, revealing critical trends and recurring
issues. This helps stakeholders identify high-priority
topics, such as frequently reported bugs or common
feature requests. By grouping similar posts, cluster-
ing improves data visualization and facilitates more
efficient analysis of large datasets.
We initially experimented with DBSCAN and K-
Means clustering methods, leveraging Principal Com-
ponent Analysis, but these approaches did not pro-
duce optimal results. Consequently, we developed
two custom algorithms inspired by ROUGE, priori-
tizing sentence similarity to group posts effectively.
The first algorithm assigns each post to the most
semantically similar cluster using cosine similarity on
sentence embeddings. A post is assigned to the clus-
ter with the highest similarity, provided it exceeds a
threshold of 0.7—determined experimentally by test-
ing a selection of posts from the dataset to ensure co-
herent initial clusters reflecting underlying themes.
The second algorithm iteratively refines these
clusters by re-evaluating post assignments. If a post
has a higher similarity to another cluster (above a
threshold of 0.5, also determined experimentally), it is
4
https://huggingface.co/spaces/evaluate-metric/rouge
ENASE 2025 - 20th International Conference on Evaluation of Novel Approaches to Software Engineering
154
reassigned. This process, involving threshold-driven
reassignment and finite iteration, maintains stability
and convergence, ultimately enhancing the overall
clustering quality.
We used GPT-3.5 Turbo to generate titles for each
cluster, in order to improve visualization. The prompt
crafted was:
prompt = f"Suggest a suitable title for this
cluster of user complaints or feedback:{text}"
With this approach, the 22,847 posts classified as
relevant in our dataset were grouped into 1,184 clus-
ters, with an average of 19.3 posts per cluster. This
represents a significant reduction in the number of
top-level items that require user attention. However,
as this number remains substantial, the filtering and
sorting features of our interactive platform, detailed
in the next section, are crucial in helping users focus
on the most relevant content.
4 FROM PROCESSED
FEEDBACK TO ACTIONABLE
ISSUES
To enable users to visualize feedback data generated
by the processing workflow described in the previ-
ous section and transform it into actionable issues, we
developed a web-based application comprising three
main components: a PostgreSQL database for storing
processed data, a Vue.js frontend for user interaction,
and a FastAPI backend to facilitate communication
between the database and the client.
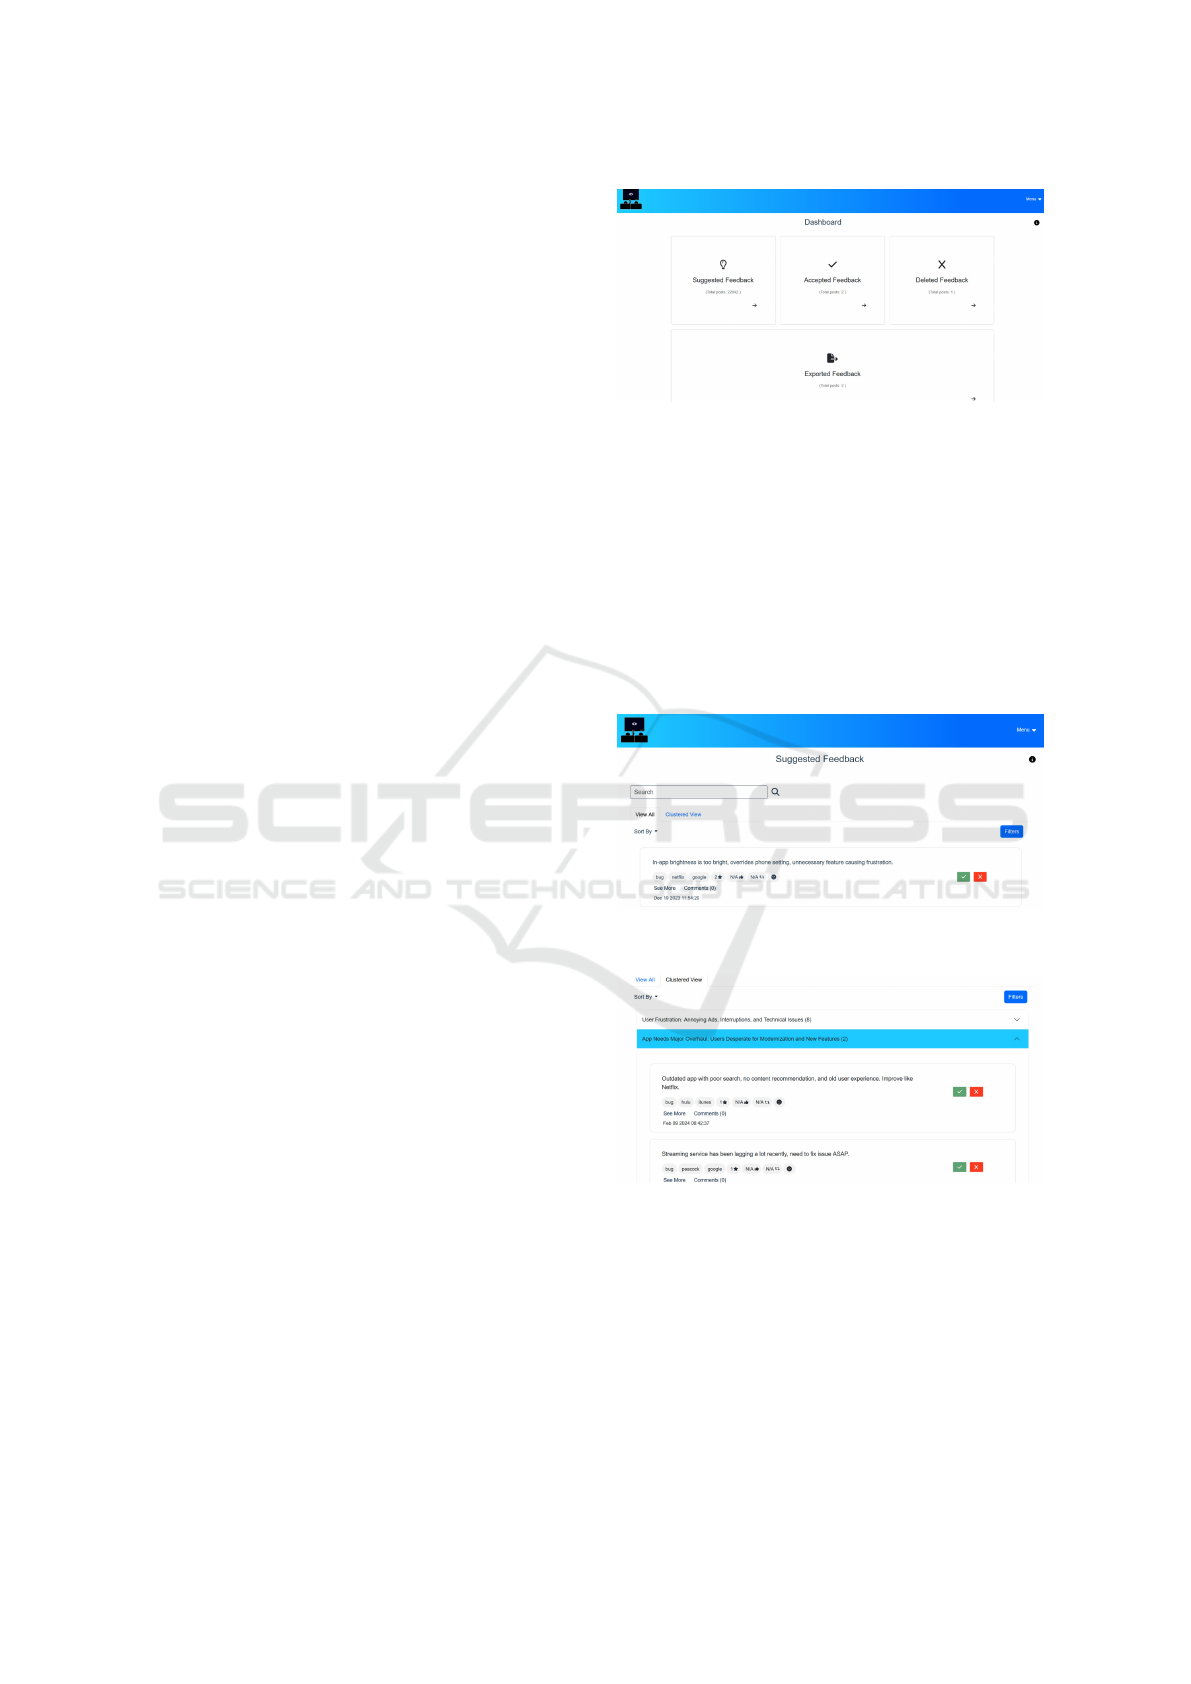
4.1 Dashboard Page
The application landing page features a Dashboard
for navigating feedback collections at various pro-
cessing stages (Figure 2):
• Suggested Feedback: Contains all new and unre-
viewed feedback. Users can evaluate these posts
for relevance and either move them to Accepted
Feedback or Deleted Feedback. Filtering and
sorting features help prioritise contents to review.
• Accepted Feedback: Includes posts reviewed
and deemed relevant. Users can create issues from
these posts or reclassify them as irrelevant, mov-
ing them to Deleted Feedback.
• Deleted Feedback: Contains posts marked as ir-
relevant, which users can still reclassify as rele-
vant and move to Accepted Feedback.
• Exported Feedback: An archive of all posts that
have been converted into issues, including links to
their corresponding GitLab issues.
Figure 2: Dashboard Page.
4.2 Accepting or Deleting Suggested
Feedback
The Suggested Feedback page presents unseen feed-
back in two views: View All, which lists all posts (Fig-
ure 3), and Clustered View, which groups posts into
clusters (Figure 4). Each post is displayed in a card
format, containing a summary and details such as cat-
egory, streaming service, social media source, rating,
likes, reposts, sentiment, and comments.
Figure 3: Suggested Feedback Page (Normal View).
Figure 4: Suggested Feedback Page (Clustered View).
Users can classify posts as relevant or irrelevant
using the green check and red cross buttons on each
card. The user is prompted to confirm the category of
posts marked as relevant (“Bug Report,” “Feature Re-
quest” or “User Experience”), a feature inspired by
(Villarroel et al., 2016), and indicate the reason for
marking posts as irrelevant (“Already Solved,” “Re-
peated” or “Out of Scope”), to improve the system’s
classification accuracy. Posts are then moved to Ac-
Automated Social Media Feedback Analysis for Software Requirements Elicitation: A Case Study in the Streaming Industry
155

Watch the Watchers: Create Issues from
Accepted Posts
1
24
1
3
Figure 5: Example of Issue Creation.
cepted or Deleted Feedback based on the user input.
To enhance navigation, users can search, filter, and
sort posts. The search bar allows keyword searches
within post text, while filters enable refinement by
date range, category, sentiment, social media, and
streaming service. Sorting options include date, sen-
timent, rating, likes, comments, reposts, and a default
criteria prioritizing negative sentiment.
4.3 Generating Issues from Accepted
Feedback
The Accepted Feedback page offers two visualiza-
tion options, akin to the Suggested Feedback Page,
but a different set of actions.
To generate one or more issues (new features, bug
fixes, etc.) based on a single post or a group of related
posts, the user has to perform the following steps (Fig-
ure 5):
1. Select complete clusters or individual posts as the
source for the new issue(s), using the check mark
on each post or cluster;
2. Press the “Create Issue” button and choose the ex-
portation method – via an issue-tracking system
API (currently GitLab) or as a CSV file;
3. Select one or more candidate requirements from
a list suggested by the platform with the help of
GPT-3.5 Turbo (based on the selected posts);
4. For each requirement selected in the previous
step, review the suggested issue description (title,
description, acceptance criteria, etc.) generated
by the system with the help of GPT-3.5 Turbo and
confirm exportation.
This way, users can combine multiple options into
a single issue or create multiple issues from one or
more posts, allowing flexibility in issue management
The system-generated form for issue creation con-
tains fields for Title and Description, and ad-
ditional fields like Private Token, Project Name,
Labels, and Due Date when connecting to GitLab.
The application suggests content for the first two
fields, using Markdown templates
5
tailored for differ-
ent post categories (bug, feature, or user experience).
Bug templates explain the bug and the expected be-
havior, while feature templates include user stories
and tasks. Furthermore, the full text of the selected
post(s) and general description and acceptance crite-
ria generated by the GPT-3.5 Turbo prompt are in-
cluded in both templates to provide additional context
for developers.
In summary, our platform improves upon existing
solutions by analyzing feedback from multiple social
media platforms, offering advanced filtering and sort-
ing, and enabling issue generation and export to an
issue tracking system (GitLab).
5 EVALUATION
Since the performance of the classification and sum-
marization algorithms used in our approach was al-
ready presented in Section 3, this section focuses only
on the user studies carried out to evaluate our interac-
tive platform (described in Section 4) using two com-
plementary methods:
• User Feedback Evaluation: Conducted through
a structured usability and relevance questionnaire,
along with qualitative discussions, involving 13
employees of the industrial partner;
• Performance in Use Evaluation: Monitored
platform usage by an employee from the industrial
partner specialized in requirement engineering to
assess relevance identification and issue creation
processes in different scenarios.
5.1 User Feedback
5.1.1 Design
This evaluation aimed to capture diverse perspectives
on usability and relevance, employing:
• Demographics Survey: Collected participants’
roles, tenure, and interaction frequency with user
feedback to contextualize their responses;
• Usability Questionnaire: Participants rated 10
statements of the standard System Usability Scale
(SUS) questionnaire (Brooke, 1996) on a 5-point
Likert scale (“Strongly Disagree” to “Strongly
Agree”);
5
https://tinyurl.com/md-templates
ENASE 2025 - 20th International Conference on Evaluation of Novel Approaches to Software Engineering
156

Figure 6: Platform Usability Survey Results.
• Relevance Questionnaire: Used a similar 5-
point Likert scale to measure participants’ percep-
tions of platform relevance and features.
5.1.2 Execution
Thirteen participants were selected by the industrial
partner based on their interaction with user feedback
and experience in roles related to RE or customer in-
teraction, including:
• Four participants with managerial roles: Chief
Marketing Officer (1 year experience), VP of Dig-
ital Strategy (over 2 years experience), Sales Man-
ager (2 years experience), and Sales Director (2
years experience);
• Nine participants with technical roles: five Soft-
ware Developers (varied tenure), two Communi-
cation Specialists (1 and 2 years experience), and
two Designers (1 and 3 years experience).
Participants were given a hands-on demonstration
of the platform in an interactive workshop, allow-
ing them to explore its features before completing the
questionnaire.
5.1.3 Results
Demographics. We received responses from 6 par-
ticipants. Regarding the frequency of interacting with
user feedback, we used a 5-point Likert scale, where
1 means “Never” and 5 means “Very Often”. The re-
sponses were equally distributed between 3, 4 and 5.
Usability. Figure 6 displays participant responses to
the usability questionnaire. The platform achieved a
SUS score of 83.3, categorizing it as Good according
to established benchmarks (Bangor et al., 2009).
Relevance. Figure 7 displays participant responses
to the platform relevance questionnaire. Relevance
was assessed through positive statements evaluated
Figure 7: Platform Relevance Survey Results.
on a 5-point Likert scale. Scores were averaged for
each statement, with all items scoring 3 (“Agree”)
or higher. Statements on the platform’s helpful-
ness in creating issues and recommendation likeli-
hood scored the highest, averaging 3.2.
5.1.4 Discussion
Participants consistently rated the platform highly,
underscoring its potential to streamline feedback
management and issue creation processes. Qualita-
tive feedback highlighted:
• Strengths: Effective aggregation of user feed-
back, actionable insights, intuitive interface, and
potential for use in other domains;
• Improvement Suggestions: Enhanced correla-
tion between feedback and platform changes, ex-
panded audience segmentation, and features to an-
alyze feedback trends over time.
5.2 Performance in Use
5.2.1 Design
We conducted three experiments with a RE expert
to evaluate the platform’s ability to identify relevant
posts and generate actionable issues. More specifi-
cally, the objectives were as follows:
1. Objective 1: Assess the platform’s impact on pro-
ductivity;
2. Objective 2: Assess the effectiveness of the plat-
form’s sorting and filtering mechanisms for prior-
itizing relevant posts.
The participant was tasked with:
• Reviewing posts on the Suggested Feedback
page and classifying them as relevant or not;
• Creating issues from relevant posts using the Ac-
cepted Feedback page, leveraging the Clustered
View to assess clustering effectiveness.
Automated Social Media Feedback Analysis for Software Requirements Elicitation: A Case Study in the Streaming Industry
157

Each experiment targeted different sets of posts:
• Experiment 1: Posts related to streaming ser-
vices that utilize the industrial partner’s platform;
• Experiment 2: The top 100 posts related to all
streaming services, sorted by “Default Sort” (neg-
ative sentiment and descending likes);
• Experiment 3: 100 randomly selected posts re-
lated to all streaming services.
5.2.2 Results
The main results of these experiments are summa-
rized in Table 4.
Table 4: Results of Platform Usage Experiments.
Dataset Posts Posts Precision Issues Duration
Analyzed Accepted (Relevance) Created (approx.)
1. Filtered set 55 47 85.4% 24 35 min
2. Top 100 sorted 100 89 89.0% 47 80 min
3. Random sample 100 68 68.0% 42 60 min
5.2.3 Discussion
Objective 1. Regarding the impact on productivity,
the results demonstrate the potential for a significant
reduction in the time required to process user feed-
back with our platform as compared to a manual pro-
cess. In an initial feasibility study, we manually col-
lected and classified hundreds of social media posts,
creating detailed issues for some of the posts deemed
relevant. The manual process required 2–3 minutes
per post for collection and classification, plus an ad-
ditional 8–10 minutes to create an issue for each rel-
evant post. With only about a third of posts classi-
fied as relevant, this amounts to 14–19 minutes per
generated issue in a manual process — an order of
magnitude higher than the times observed with our
platform in the 3 experiments, with 1.4-1.7 minutes
per generated issue with our platform.
Objective 2. The effectiveness of the platform’s
sorting and filtering mechanisms for prioritizing
relevant posts is demonstrated by comparing the per-
centage of posts accepted as relevant in experiments 1
(85.4%) and 2 (89.9%) to the baseline in experiment
3 (68.0%). Experiment 3 used a random selection of
posts, while in experiment 2 posts were sorted by neg-
ative sentiment and the number of likes (default sort-
ing criteria), yielding 21% more relevant posts than
the baseline. Experiment 1 used a filtered collection
of posts, focusing on the streaming services of great-
est interest for our industrial partner, yielding 19.4%
more relevant posts than the baseline.
The user found the application intuitive and partic-
ularly useful in creating issues and providing a clear
overview of feedback. The user also used the platform
to create issues from clusters and manually grouped
posts that addressed similar topics but used different
terminology, a task the clustering algorithm could not
accomplish due to its reliance on sentence similarity.
This highlighted a limitation in the algorithm, which
lacks the context awareness needed to group seman-
tically related but differently phrased posts. Address-
ing this requires models capable of deeper semantic
understanding, such as LLMs, which can capture con-
textual relationships beyond surface-level wording.
Overall, the experiments demonstrated the plat-
form’s ability to efficiently identify relevant posts and
generate actionable issues. However, future studies
should focus on evaluating the quality of generated
issues and developer satisfaction to ensure that issue
trackers are not overwhelmed.
6 LIMITATIONS AND THREATS
TO VALIDITY
While the platform has shown promising results in
aggregating and visualizing social media feedback,
some limitations and threats to the validity of our re-
search should be acknowledged.
6.1 Platform Limitations
• Contextual Understanding: The current cluster-
ing algorithm relies on sentence similarity, which
can miss posts that are contextually related but use
different terminology. This limitation affects the
precision of issue clustering and may require the
integration of more advanced models like LLMs
to improve context-awareness;
• Domain-Specific Adaptation: Although the
platform is modular, adapting it to new do-
mains requires modifications to data extraction
scripts. This could pose challenges in domains
with highly specialized or nuanced terminology;
• Longitudinal Impact: The platform’s impact
over extended periods has not been fully evalu-
ated. Long-term studies are needed to understand
how continuous use affects feedback management
and product development processes;
• Cost and Dependence on Proprietary APIs:
The platform uses GPT-3.5 Turbo for summariza-
tion and issue generation, enhancing automation
but raising concerns about cost and reliance on
proprietary technology. Future work aims to ex-
plore open-source LLMs and optimize API usage
with caching and batching strategies.
ENASE 2025 - 20th International Conference on Evaluation of Novel Approaches to Software Engineering
158

6.2 Threats to Validity
• Construct Validity: The classification and clus-
tering metrics used in our evaluation are standard
in natural language processing. However, these
metrics may not perfectly reflect the relevance or
usefulness of the results to stakeholders. Incorpo-
rating qualitative feedback from users into future
evaluations could provide a more holistic view;
• External Validity: The datasets used in our study
were sourced from a specific set of social media
platforms (e.g., Reddit, Twitter) and may not gen-
eralize to other feedback sources. Exploring other
platforms and data types is essential for validating
the platform’s scalability and versatility;
• Bias in Data Selection: While we aimed to gather
diverse feedback, the data collection process may
inadvertently introduce bias. For example, some
posts may have been excluded due to platform re-
strictions, potentially skewing the results;
• Temporal Validity: The platform was evaluated
over a short timeframe, limiting the ability to
study its long-term impact on the industrial part-
ner’s workflows. Metrics on real-world improve-
ments, such as productivity gains or changes in
decision-making processes, remain unmeasured.
Long-term evaluations are necessary to assess the
platform’s sustained utility in industrial settings.
By addressing these limitations and threats, future
research can improve the robustness of the platform
while deepening our understanding of its long-term
impact on RE practices.
7 CONCLUSIONS
This paper presented an approach and platform de-
signed to leverage social media for gathering user
feedback, offering stakeholders an intuitive visualiza-
tion tool to interpret and act on this feedback. Vali-
dated through collaboration with an industry partner
in the streaming domain, the platform demonstrated
its potential to streamline feedback management, en-
hance decision-making, and provide actionable in-
sights.
Key contributions of this work include:
• Industry Evaluation: The platform has been
evaluated in a real-world industry context, offer-
ing insights into its practical utility and adapt-
ability. This study contributes a focused explo-
ration of integrating indirect social media feed-
back into actionable workflows, with direct stake-
holder feedback affirming its relevance;
• Automated Social Media Feedback Processing:
The platform automates data extraction across
multiple social media platforms, utilizing innova-
tive techniques such as LLM-based summariza-
tion and custom clustering algorithms. This ap-
proach enhances efficiency and scalability, align-
ing with but extending beyond traditional methods
found in the literature;
• Integrated Feedback Visualization, Issue Cre-
ation, and Requirement Suggestion: Our plat-
form integrates data aggregation, and actionable
workflows, enabling stakeholders to move seam-
lessly from feedback interpretation to task im-
plementation. It suggests requirements and ac-
ceptance criteria, directly aiding issue creation in
tools like GitLab. This end-to-end approach rep-
resents a significant step toward bridging the gap
between feedback collection and practical imple-
mentation;
• Indirect Feedback Acquisition: This platform
captures user feedback on various streaming ap-
plications by searching for posts referencing prod-
ucts rather than requiring users to directly engage
with specific accounts. This method provides a
comprehensive view of multiple related products
on the market, providing insights that traditional
academic approaches often overlook.
The results of this work highlight the potential
of leveraging social media as a scalable source of
indirect feedback for requirements engineering. By
demonstrating how automation and visualization can
transform unstructured user posts into actionable in-
sights, the study contributes to the growing body of
research on data-driven and crowd-based RE.
Our findings suggest that platforms like ours can
complement traditional feedback channels by inte-
grating broader user perspectives from public discus-
sions, which is particularly valuable for market-driven
development. The platform’s features, such as in-
tegrated issue creation and requirement suggestions,
show promise for reducing cognitive load and im-
proving team productivity.
Future enhancements include improving classifi-
cation and clustering algorithms, adding post-refresh
options, user notifications, and adapting the platform
to other domains. Thanks to its modular design,
adapting the platform requires only redefining search
parameters to collect domain-specific data. Once con-
figured, the platform follows standardized processing
steps to analyze relevant user posts and extract action-
able requirements, regardless of the application do-
main. Initially applied to a streaming platform, the
methodology is scalable and generalizable to other in-
dustries where social media feedback is available.
Automated Social Media Feedback Analysis for Software Requirements Elicitation: A Case Study in the Streaming Industry
159

Long-term studies are required to assess the plat-
form’s impact on feedback management and product
development through qualitative user feedback analy-
sis and usability testing.
In conclusion, this work addresses the need for au-
tomated, scalable tools to interpret social media feed-
back, enhancing the RE process and helping stake-
holders meet evolving user expectations. Its contri-
butions to integrating feedback workflows into issue
management tools and expanding feedback sources
highlight its relevance in dynamic software develop-
ment environments.
REFERENCES
Ali, N. and Hong, J. E. (2019). A bird’s eye view on
social network sites and requirements engineering.
In ICSOFT 2019 - Proceedings of the 14th Interna-
tional Conference on Software Technologies, pages
347–354.
Bangor, A., Kortum, P. T., and Miller, J. T. (2009). De-
termining what individual sus scores mean: adding
an adjective rating scale. Journal of Usability Stud-
ies archive, 4:114–123.
Brooke, J. B. (1996). Sus: A ’quick and dirty’ usability
scale.
Di Sorbo, A., Panichella, S., Alexandru, C. V., Visaggio,
C. A., and Canfora, G. (2017). Surf: Summarizer
of user reviews feedback. In Proceedings - 2017
IEEE/ACM 39th International Conference on Soft-
ware Engineering Companion, ICSE-C 2017, pages
55–58.
Ebrahimi, A. M. and Barforoush, A. A. (2019). Prepro-
cessing role in analyzing tweets towards requirement
engineering. In ICEE 2019 - 27th Iranian Conference
on Electrical Engineering, pages 1905–1911.
Groen, E. C., Seyff, N., Ali, R., Dalpiaz, F., Doerr, J., Guz-
man, E., Hosseini, M., Marco, J., Oriol, M., Perini, A.,
and Stade, M. (2017). The crowd in requirements en-
gineering: The landscape and challenges. IEEE Soft-
ware, 34(2):44–52.
Guzman, E., Alkadhi, R., and Seyff, N. (2017). An ex-
ploratory study of twitter messages about software
applications. Requirements Engineering, 22(3):387–
412.
Iqbal, T., Khan, M., Taveter, K., and Seyff, N. (2021). Min-
ing reddit as a new source for software requirements.
In Proceedings of the IEEE International Conference
on Requirements Engineering, pages 128–138.
Kanchev, G. M. and Chopra, A. K. (2015). Social media
through the requirements lens: A case study of google
maps. In 1st International Workshop on Crowd-Based
Requirements Engineering, CrowdRE 2015 - Proceed-
ings, pages 7–12.
Li, C., Huang, L., Ge, J., Luo, B., and Ng, V. (2018). Au-
tomatically classifying user requests in crowdsourc-
ing requirements engineering. Journal of Systems and
Software, 138:108–123.
Maalej, W., Kurtanovi
´
c, Z., Nabil, H., and Stanik, C.
(2016a). On the automatic classification of app re-
views. Requirements Engineering, 21(3):311–331.
Maalej, W., Nayebi, M., Johann, T., and Ruhe, G. (2016b).
Toward data-driven requirements engineering. IEEE
Software, 33(1):48–54.
McIlroy, S., Ali, N., Khalid, H., and E. Hassan, A. (2016).
Analyzing and automatically labelling the types of
user issues that are raised in mobile app reviews. Em-
pirical Software Engineering, 21(3):1067–1106.
Nayebi, M., Cho, H., and Ruhe, G. (2018). App store min-
ing is not enough for app improvement. Empirical
Software Engineering.
Oehri, E. and Guzman, E. (2020). Same same but dif-
ferent: Finding similar user feedback across multiple
platforms and languages. In Proceedings of the IEEE
International Conference on Requirements Engineer-
ing, volume 2020-August, pages 44–54.
Panichella, S., Di Sorbo, A., Guzman, E., Visaggio, C. A.,
Canfora, G., and Gall, H. (2016). Ardoc: App re-
views development oriented classifier. In Proceedings
of the ACM SIGSOFT Symposium on the Foundations
of Software Engineering, volume 13-18-November-
2016, pages 1023–1027.
Scanlan, J., de Salas, K., Lim, D., and Roehrer, E. (2022).
Using social media to support requirements gathering
when users are not available. In Proceedings of the
Annual Hawaii International Conference on System
Sciences, pages 4227–4236.
Silva, M. (2024). Automated user feedback mining for
software requirements elicitation - a case study in the
streaming industry. Master’s thesis, Faculty of Engi-
neering of University of Porto. Available at: https:
//repositorio-aberto.up.pt/handle/10216/161054.
Stanik, C. and Maalej, W. (2019). Requirements intelli-
gence with openreq analytics. In Proceedings of the
IEEE International Conference on Requirements En-
gineering, volume 2019-September, pages 482–483.
Tizard, J., Wang, H., Yohannes, L., and Blincoe, K. (2019).
Can a conversation paint a picture? mining require-
ments in software forums.
Villarroel, L., Bavota, G., Russo, B., Oliveto, R., and
Di Penta, M. (2016). Release planning of mobile apps
based on user reviews. In Proceedings - International
Conference on Software Engineering, volume 14-22-
May-2016, pages 14–24.
Williams, G. and Mahmoud, A. (2017). Mining twitter
feeds for software user requirements. In Proceedings
- 2017 IEEE 25th International Requirements Engi-
neering Conference, RE 2017, pages 1–10.
ENASE 2025 - 20th International Conference on Evaluation of Novel Approaches to Software Engineering
160
